Schematic overview of the cellular and molecular mechanisms involved in the cancer progression, including the proposed cellular and molecular mechanisms in cancer cells trajectory. AT1: alveolar type 1 cells; AT2: alveolar type 2 cells; AAH: atypical adenomatous hyperplasia; AIS: adenocarcinoma in situ; MIA: minimally invasive adenocarcinoma; IA: invasive adenocarcinoma; EMT: epithelial-mesenchymal transition

Home

Download

Statistics

Help

Contact

Center for Computational Systems Medicine
leaf

Gene summary

leaf

Malignant transformation analysis

leaf

Malignant transformation related pathway analysis

leaf

Cell-cell communication analysis

leaf

Single-cell gene regulatory network inference analysis

leaf

Somatic mutation of malignant transformation related genes

leaf

Related drugs of malignant transformation related genes

Gene: OAZ2

Gene summary for OAZ2

check button Gene summary.

Gene informationSpeciesHuman
Gene symbol

OAZ2

Gene ID

4947

Gene nameornithine decarboxylase antizyme 2
Gene AliasAZ2
Cytomap15q22.31
Gene Typeprotein-coding
GO ID

GO:0006576

UniProtAcc

O95190


Top

Malignant transformation analysis

check button Identification of the aberrant gene expression in precancerous and cancerous lesions by comparing the gene expression of stem-like cells in diseased tissues with normal stem cells
check button Malignant transformation involving gene list.
Entrez IDSymbolReplicatesSpeciesOrganTissueAdj P-valueLog2FCMalignancy
4947OAZ2P48T-EHumanEsophagusESCC4.84e-102.55e-010.0959
4947OAZ2P49T-EHumanEsophagusESCC4.58e-151.19e+000.1768
4947OAZ2P52T-EHumanEsophagusESCC7.91e-184.89e-010.1555
4947OAZ2P54T-EHumanEsophagusESCC4.94e-091.23e-010.0975
4947OAZ2P56T-EHumanEsophagusESCC4.04e-121.12e+000.1613
4947OAZ2P57T-EHumanEsophagusESCC3.27e-203.66e-010.0926
4947OAZ2P61T-EHumanEsophagusESCC1.14e-163.94e-010.099
4947OAZ2P62T-EHumanEsophagusESCC3.33e-231.97e-010.1302
4947OAZ2P65T-EHumanEsophagusESCC1.79e-192.65e-010.0978
4947OAZ2P74T-EHumanEsophagusESCC6.78e-246.88e-010.1479
4947OAZ2P75T-EHumanEsophagusESCC5.12e-144.02e-010.1125
4947OAZ2P76T-EHumanEsophagusESCC4.90e-224.84e-010.1207
4947OAZ2P79T-EHumanEsophagusESCC1.01e-194.73e-010.1154
4947OAZ2P80T-EHumanEsophagusESCC2.00e-193.73e-010.155
4947OAZ2P82T-EHumanEsophagusESCC4.85e-083.16e-010.1072
4947OAZ2P83T-EHumanEsophagusESCC3.30e-244.97e-010.1738
4947OAZ2P84T-EHumanEsophagusESCC7.74e-049.76e-020.0933
4947OAZ2P89T-EHumanEsophagusESCC6.75e-126.37e-010.1752
4947OAZ2P91T-EHumanEsophagusESCC1.07e-111.09e+000.1828
4947OAZ2P107T-EHumanEsophagusESCC1.68e-226.03e-010.171
Page: 1 2 3 4 5 6 7 

check button Transcriptomic changes along malignancy continuum.
TissueExpression DynamicsAbbreviation
Colorectum (GSE201348)The image shows the transcriptomic changes along malignancy continuum.log2FC in expression of this searched gene in stem-like cells from each diseased tissue sample relative to stem-like cells in normal samples in each tissue plotted against the malignancy continuum. Samples are colored based on if they are from different disease stage.
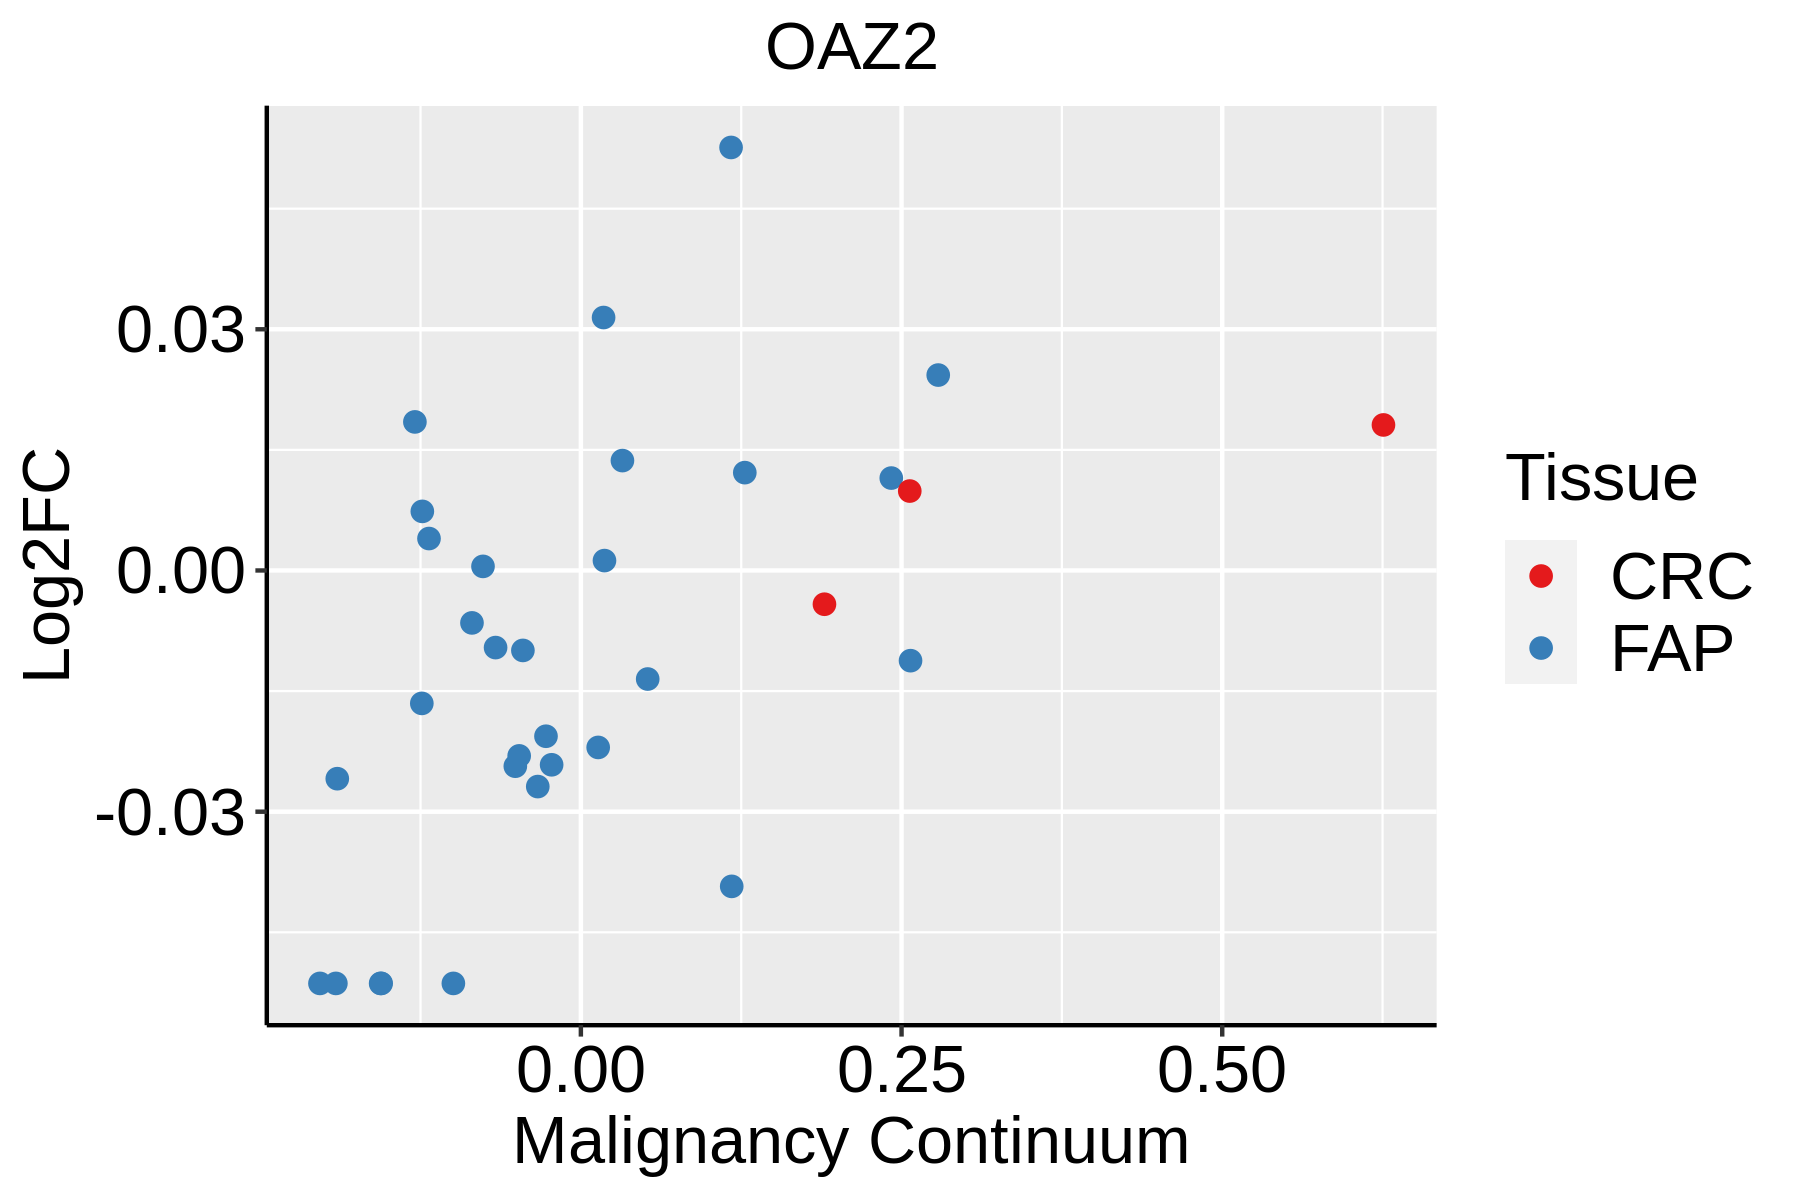
FAP: Familial adenomatous polyposis
CRC: Colorectal cancer
Colorectum (HTA11)The image shows the transcriptomic changes along malignancy continuum.log2FC in expression of this searched gene in stem-like cells from each diseased tissue sample relative to stem-like cells in normal samples in each tissue plotted against the malignancy continuum. Samples are colored based on if they are from different disease stage.AD: Adenomas
SER: Sessile serrated lesions
MSI-H: Microsatellite-high colorectal cancer
MSS: Microsatellite stable colorectal cancer
EsophagusThe image shows the transcriptomic changes along malignancy continuum.log2FC in expression of this searched gene in stem-like cells from each diseased tissue sample relative to stem-like cells in normal samples in each tissue plotted against the malignancy continuum. Samples are colored based on if they are from different disease stage.
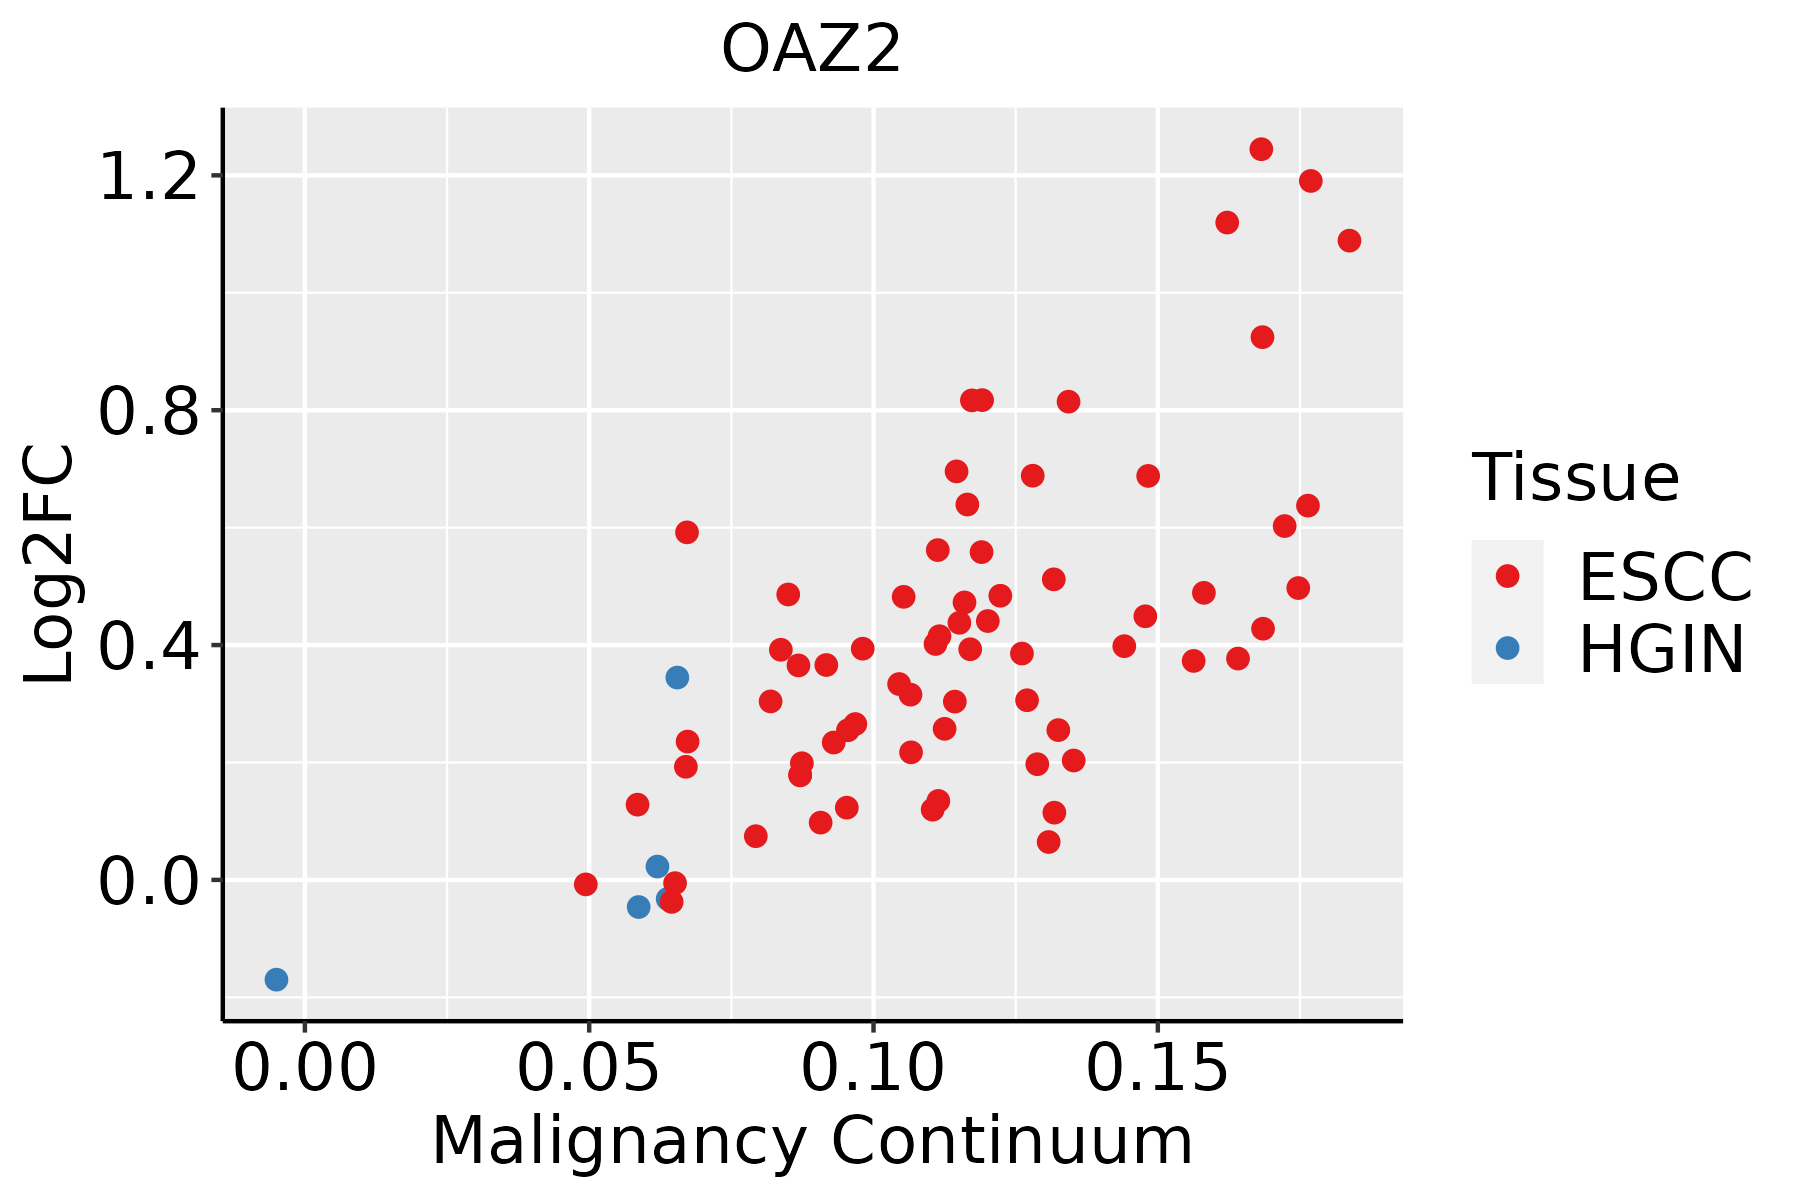
ESCC: Esophageal squamous cell carcinoma
HGIN: High-grade intraepithelial neoplasias
LGIN: Low-grade intraepithelial neoplasias
LiverThe image shows the transcriptomic changes along malignancy continuum.log2FC in expression of this searched gene in stem-like cells from each diseased tissue sample relative to stem-like cells in normal samples in each tissue plotted against the malignancy continuum. Samples are colored based on if they are from different disease stage.HCC: Hepatocellular carcinoma
NAFLD: Non-alcoholic fatty liver disease
Oral CavityThe image shows the transcriptomic changes along malignancy continuum.log2FC in expression of this searched gene in stem-like cells from each diseased tissue sample relative to stem-like cells in normal samples in each tissue plotted against the malignancy continuum. Samples are colored based on if they are from different disease stage.EOLP: Erosive Oral lichen planus
LP: leukoplakia
NEOLP: Non-erosive oral lichen planus
OSCC: Oral squamous cell carcinoma
SkinThe image shows the transcriptomic changes along malignancy continuum.log2FC in expression of this searched gene in stem-like cells from each diseased tissue sample relative to stem-like cells in normal samples in each tissue plotted against the malignancy continuum. Samples are colored based on if they are from different disease stage.AK: Actinic keratosis
cSCC: Cutaneous squamous cell carcinoma
SCCIS:squamous cell carcinoma in situ
ThyroidThe image shows the transcriptomic changes along malignancy continuum.log2FC in expression of this searched gene in stem-like cells from each diseased tissue sample relative to stem-like cells in normal samples in each tissue plotted against the malignancy continuum. Samples are colored based on if they are from different disease stage.
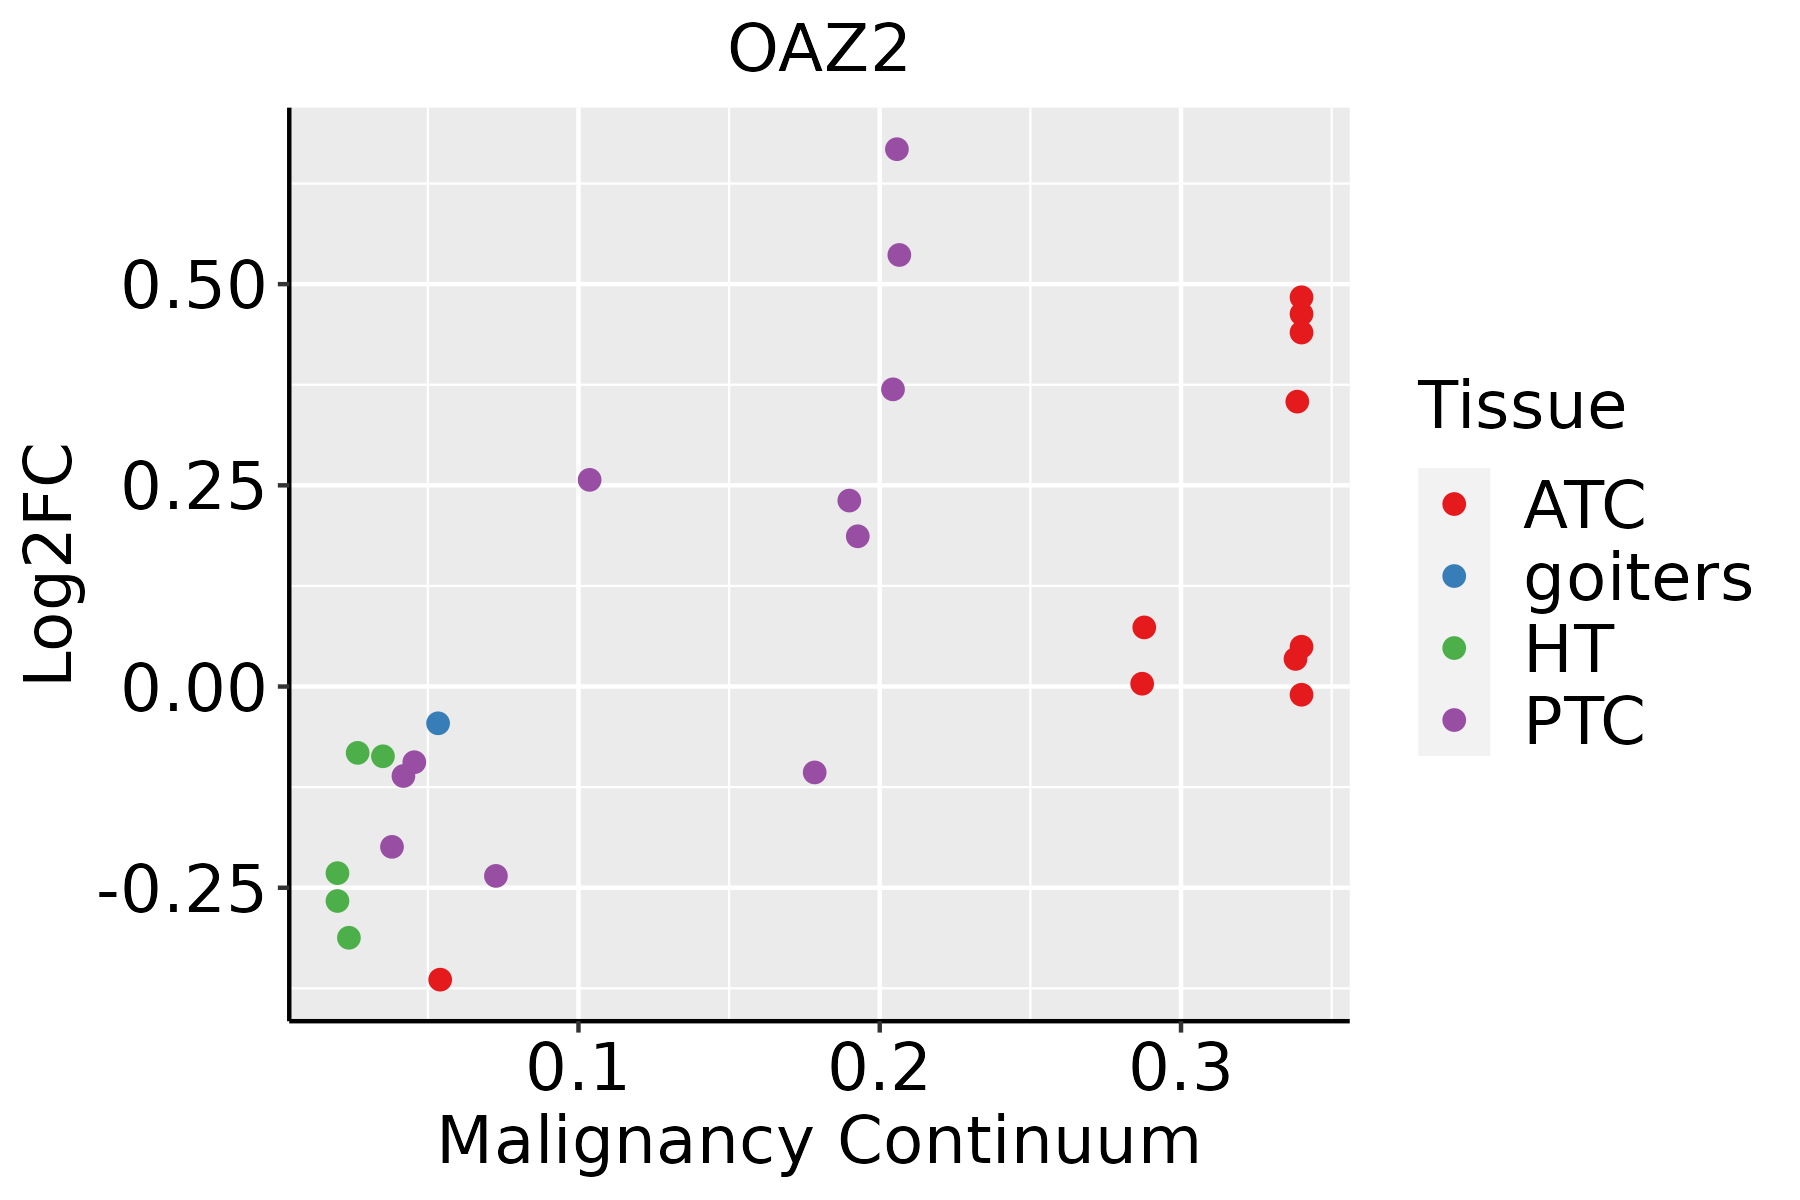
ATC: Anaplastic thyroid cancer
HT: Hashimoto's thyroiditis
PTC: Papillary thyroid cancer
∗log2FC in expression of this searched gene in stem-like cells from each diseased tissue sample relative to stem-like cells in normal samples in each tissue plotted against the malignancy continuum. Samples are colored based on if they are from different disease stage.

Top

Malignant transformation related pathway analysis

check buttonFind out the enriched GO biological processes and KEGG pathways involved in transition from healthy to precancer to cancer
check button Figure of enriched GO biological processes.
TissueDisease StageEnriched GO biological Processes
ColorectumADGO analysis - Figure of enriched GO biological processes: Top 15 enriched GO BP terms are showed in the bar plot of each disease state in each tissue. Each row represents a significant GO biological process which is colored according to the -log10(p.adjust).
ColorectumSERGO analysis - Figure of enriched GO biological processes: Top 15 enriched GO BP terms are showed in the bar plot of each disease state in each tissue. Each row represents a significant GO biological process which is colored according to the -log10(p.adjust).
ColorectumMSSGO analysis - Figure of enriched GO biological processes: Top 15 enriched GO BP terms are showed in the bar plot of each disease state in each tissue. Each row represents a significant GO biological process which is colored according to the -log10(p.adjust).
ColorectumMSI-HGO analysis - Figure of enriched GO biological processes: Top 15 enriched GO BP terms are showed in the bar plot of each disease state in each tissue. Each row represents a significant GO biological process which is colored according to the -log10(p.adjust).
ColorectumFAPGO analysis - Figure of enriched GO biological processes: Top 15 enriched GO BP terms are showed in the bar plot of each disease state in each tissue. Each row represents a significant GO biological process which is colored according to the -log10(p.adjust).
∗Top 15 enriched GO BP terms are showed in the bar plot of each disease state in each tissue. Each row represents a significant GO biological process which is colored according to the -log10(p.adjust).
Page: 1 2 3 4 5 6 7 8 9 

check button Enriched GO biological processes.
GO IDTissueDisease StageDescriptionGene RatioBg Ratiopvaluep.adjustCount
GO:0042176ColorectumADregulation of protein catabolic process160/3918391/187231.06e-197.34e-17160
GO:0009896ColorectumADpositive regulation of catabolic process180/3918492/187234.33e-161.94e-13180
GO:0045732ColorectumADpositive regulation of protein catabolic process92/3918231/187233.85e-114.47e-0992
GO:1904951ColorectumADpositive regulation of establishment of protein localization112/3918319/187232.55e-091.80e-07112
GO:0051222ColorectumADpositive regulation of protein transport106/3918303/187238.45e-095.08e-07106
GO:0090316ColorectumADpositive regulation of intracellular protein transport62/3918160/187231.82e-077.79e-0662
GO:0032388ColorectumADpositive regulation of intracellular transport74/3918202/187231.83e-077.80e-0674
GO:0032386ColorectumADregulation of intracellular transport109/3918337/187235.33e-071.95e-05109
GO:0033157ColorectumADregulation of intracellular protein transport80/3918229/187235.81e-072.09e-0580
GO:00421761ColorectumSERregulation of protein catabolic process126/2897391/187235.33e-172.52e-14126
GO:00457321ColorectumSERpositive regulation of protein catabolic process77/2897231/187239.91e-121.90e-0977
GO:00098961ColorectumSERpositive regulation of catabolic process132/2897492/187234.16e-116.72e-09132
GO:19049511ColorectumSERpositive regulation of establishment of protein localization91/2897319/187231.69e-091.68e-0791
GO:00512221ColorectumSERpositive regulation of protein transport85/2897303/187231.36e-081.05e-0685
GO:00331571ColorectumSERregulation of intracellular protein transport68/2897229/187233.41e-082.30e-0668
GO:00903161ColorectumSERpositive regulation of intracellular protein transport52/2897160/187235.64e-083.72e-0652
GO:00323861ColorectumSERregulation of intracellular transport89/2897337/187231.34e-077.96e-0689
GO:00323881ColorectumSERpositive regulation of intracellular transport59/2897202/187234.98e-072.48e-0559
GO:0051051ColorectumSERnegative regulation of transport98/2897470/187231.01e-031.19e-0298
GO:00421762ColorectumMSSregulation of protein catabolic process145/3467391/187232.03e-181.17e-15145
Page: 1 2 3 4 5 6 

check button Enriched KEGG pathways.
Pathway IDTissueDisease StageDescriptionGene RatioBg Ratiopvaluep.adjustqvalueCount
Page: 1 

Top

Cell-cell communication analysis

check buttonIdentification of potential cell-cell interactions between two cell types and their ligand-receptor pairs for different disease states
LigandReceptorLRpairPathwayTissueDisease Stage
Page: 1 

Top

Single-cell gene regulatory network inference analysis

check buttonFind out the significant the regulons (TFs) and the target genes of each regulon across cell types for different disease states
TFCell TypeTissueDisease StageTarget GeneRSSRegulon Activity
∗The dot plots of a searched regulon are shown for all cell subpopulations in each disease state of each tissue based on the regulon specific score inferred using pySCENIC and by calculating the average expression.
Page: 1 

Top

Somatic mutation of malignant transformation related genes

check buttonAnnotation of somatic variants for genes involved in malignant transformation
Hugo SymbolVariant ClassVariant ClassificationdbSNP RSHGVScHGVSpHGVSp ShortSWISSPROTBIOTYPESIFTPolyPhenTumor Sample BarcodeTissueHistologySexAgeStageTherapy TypesDrugsOutcome
OAZ2SNVMissense_Mutationc.18N>Ap.Asp6Glup.D6EO95190protein_codingtolerated(1)benign(0.417)TCGA-A8-A07G-01Breastbreast invasive carcinomaFemale>=65I/IIChemotherapy5-fluorouracilCR
OAZ2deletionFrame_Shift_Delnovelc.77delNp.Pro26GlnfsTer31p.P26Qfs*31O95190protein_codingTCGA-D8-A27V-01Breastbreast invasive carcinomaFemale<65I/IIHormone TherapytamoxiphenSD
OAZ2SNVMissense_Mutationc.521N>Cp.Val174Alap.V174AO95190protein_codingtolerated(0.64)benign(0.018)TCGA-AY-6197-01Colorectumcolon adenocarcinomaMale<65I/IIUnknownUnknownSD
OAZ2SNVMissense_Mutationrs369960638c.181N>Ap.Glu61Lysp.E61KO95190protein_codingtolerated(0.48)benign(0.163)TCGA-AJ-A3BH-01Endometriumuterine corpus endometrioid carcinomaFemaleUnknownI/IIUnknownUnknownSD
OAZ2SNVMissense_Mutationnovelc.223N>Cp.Lys75Glnp.K75QO95190protein_codingtolerated(0.07)benign(0.037)TCGA-AJ-A3EL-01Endometriumuterine corpus endometrioid carcinomaFemale<65I/IIUnknownUnknownSD
OAZ2SNVMissense_Mutationnovelc.202G>Tp.Asp68Tyrp.D68YO95190protein_codingdeleterious(0.01)possibly_damaging(0.907)TCGA-AJ-A5DW-01Endometriumuterine corpus endometrioid carcinomaFemale<65I/IIUnknownUnknownSD
OAZ2SNVMissense_Mutationnovelc.419N>Ap.Arg140Lysp.R140KO95190protein_codingtolerated(0.27)benign(0.246)TCGA-AP-A1DK-01Endometriumuterine corpus endometrioid carcinomaFemale<65I/IIUnknownUnknownSD
OAZ2SNVMissense_Mutationnovelc.549G>Tp.Gln183Hisp.Q183HO95190protein_codingdeleterious(0)benign(0.059)TCGA-AX-A2HC-01Endometriumuterine corpus endometrioid carcinomaFemale<65III/IVChemotherapypaclitaxelPD
OAZ2SNVMissense_Mutationnovelc.27N>Gp.Ile9Metp.I9MO95190protein_codingtolerated(0.13)benign(0.374)TCGA-DF-A2KN-01Endometriumuterine corpus endometrioid carcinomaFemaleUnknownI/IIUnknownUnknownSD
OAZ2SNVMissense_Mutationnovelc.296G>Tp.Ser99Ilep.S99IO95190protein_codingdeleterious(0.01)benign(0.14)TCGA-DF-A2KU-01Endometriumuterine corpus endometrioid carcinomaFemaleUnknownI/IIUnknownUnknownSD
Page: 1 2 

Top

Related drugs of malignant transformation related genes

check buttonIdentification of chemicals and drugs interact with genes involved in malignant transfromation
(DGIdb 4.0)
Entrez IDSymbolCategoryInteraction TypesDrug Claim NameDrug NamePMIDs
Page: 1