Schematic overview of the cellular and molecular mechanisms involved in the cancer progression, including the proposed cellular and molecular mechanisms in cancer cells trajectory. AT1: alveolar type 1 cells; AT2: alveolar type 2 cells; AAH: atypical adenomatous hyperplasia; AIS: adenocarcinoma in situ; MIA: minimally invasive adenocarcinoma; IA: invasive adenocarcinoma; EMT: epithelial-mesenchymal transition

Home

Download

Statistics

Help

Contact

Center for Computational Systems Medicine
leaf

Gene summary

leaf

Malignant transformation analysis

leaf

Malignant transformation related pathway analysis

leaf

Cell-cell communication analysis

leaf

Single-cell gene regulatory network inference analysis

leaf

Somatic mutation of malignant transformation related genes

leaf

Related drugs of malignant transformation related genes

Gene: NVL

Gene summary for NVL

check button Gene summary.

Gene informationSpeciesHuman
Gene symbol

NVL

Gene ID

4931

Gene namenuclear VCP like
Gene AliasNVL2
Cytomap1q42.11
Gene Typeprotein-coding
GO ID

GO:0006139

UniProtAcc

O15381


Top

Malignant transformation analysis

check button Identification of the aberrant gene expression in precancerous and cancerous lesions by comparing the gene expression of stem-like cells in diseased tissues with normal stem cells
check button Malignant transformation involving gene list.
Entrez IDSymbolReplicatesSpeciesOrganTissueAdj P-valueLog2FCMalignancy
4931NVLP39T-EHumanEsophagusESCC8.84e-051.16e-010.0894
4931NVLP40T-EHumanEsophagusESCC5.74e-039.54e-020.109
4931NVLP42T-EHumanEsophagusESCC1.13e-092.56e-010.1175
4931NVLP44T-EHumanEsophagusESCC2.30e-051.56e-010.1096
4931NVLP47T-EHumanEsophagusESCC9.02e-111.46e-010.1067
4931NVLP48T-EHumanEsophagusESCC2.03e-091.79e-010.0959
4931NVLP49T-EHumanEsophagusESCC3.08e-054.66e-010.1768
4931NVLP52T-EHumanEsophagusESCC1.23e-203.08e-010.1555
4931NVLP54T-EHumanEsophagusESCC2.41e-071.72e-010.0975
4931NVLP56T-EHumanEsophagusESCC1.84e-055.77e-010.1613
4931NVLP57T-EHumanEsophagusESCC1.96e-051.16e-010.0926
4931NVLP61T-EHumanEsophagusESCC2.36e-081.97e-010.099
4931NVLP62T-EHumanEsophagusESCC8.65e-173.10e-010.1302
4931NVLP65T-EHumanEsophagusESCC5.82e-071.64e-010.0978
4931NVLP74T-EHumanEsophagusESCC7.99e-133.67e-010.1479
4931NVLP75T-EHumanEsophagusESCC2.60e-203.81e-010.1125
4931NVLP76T-EHumanEsophagusESCC3.28e-142.41e-010.1207
4931NVLP79T-EHumanEsophagusESCC2.56e-162.26e-010.1154
4931NVLP80T-EHumanEsophagusESCC3.81e-205.43e-010.155
4931NVLP82T-EHumanEsophagusESCC8.37e-073.10e-010.1072
Page: 1 2 3 4 5 

check button Transcriptomic changes along malignancy continuum.
TissueExpression DynamicsAbbreviation
Colorectum (GSE201348)The image shows the transcriptomic changes along malignancy continuum.log2FC in expression of this searched gene in stem-like cells from each diseased tissue sample relative to stem-like cells in normal samples in each tissue plotted against the malignancy continuum. Samples are colored based on if they are from different disease stage.FAP: Familial adenomatous polyposis
CRC: Colorectal cancer
Colorectum (HTA11)The image shows the transcriptomic changes along malignancy continuum.log2FC in expression of this searched gene in stem-like cells from each diseased tissue sample relative to stem-like cells in normal samples in each tissue plotted against the malignancy continuum. Samples are colored based on if they are from different disease stage.AD: Adenomas
SER: Sessile serrated lesions
MSI-H: Microsatellite-high colorectal cancer
MSS: Microsatellite stable colorectal cancer
EsophagusThe image shows the transcriptomic changes along malignancy continuum.log2FC in expression of this searched gene in stem-like cells from each diseased tissue sample relative to stem-like cells in normal samples in each tissue plotted against the malignancy continuum. Samples are colored based on if they are from different disease stage.
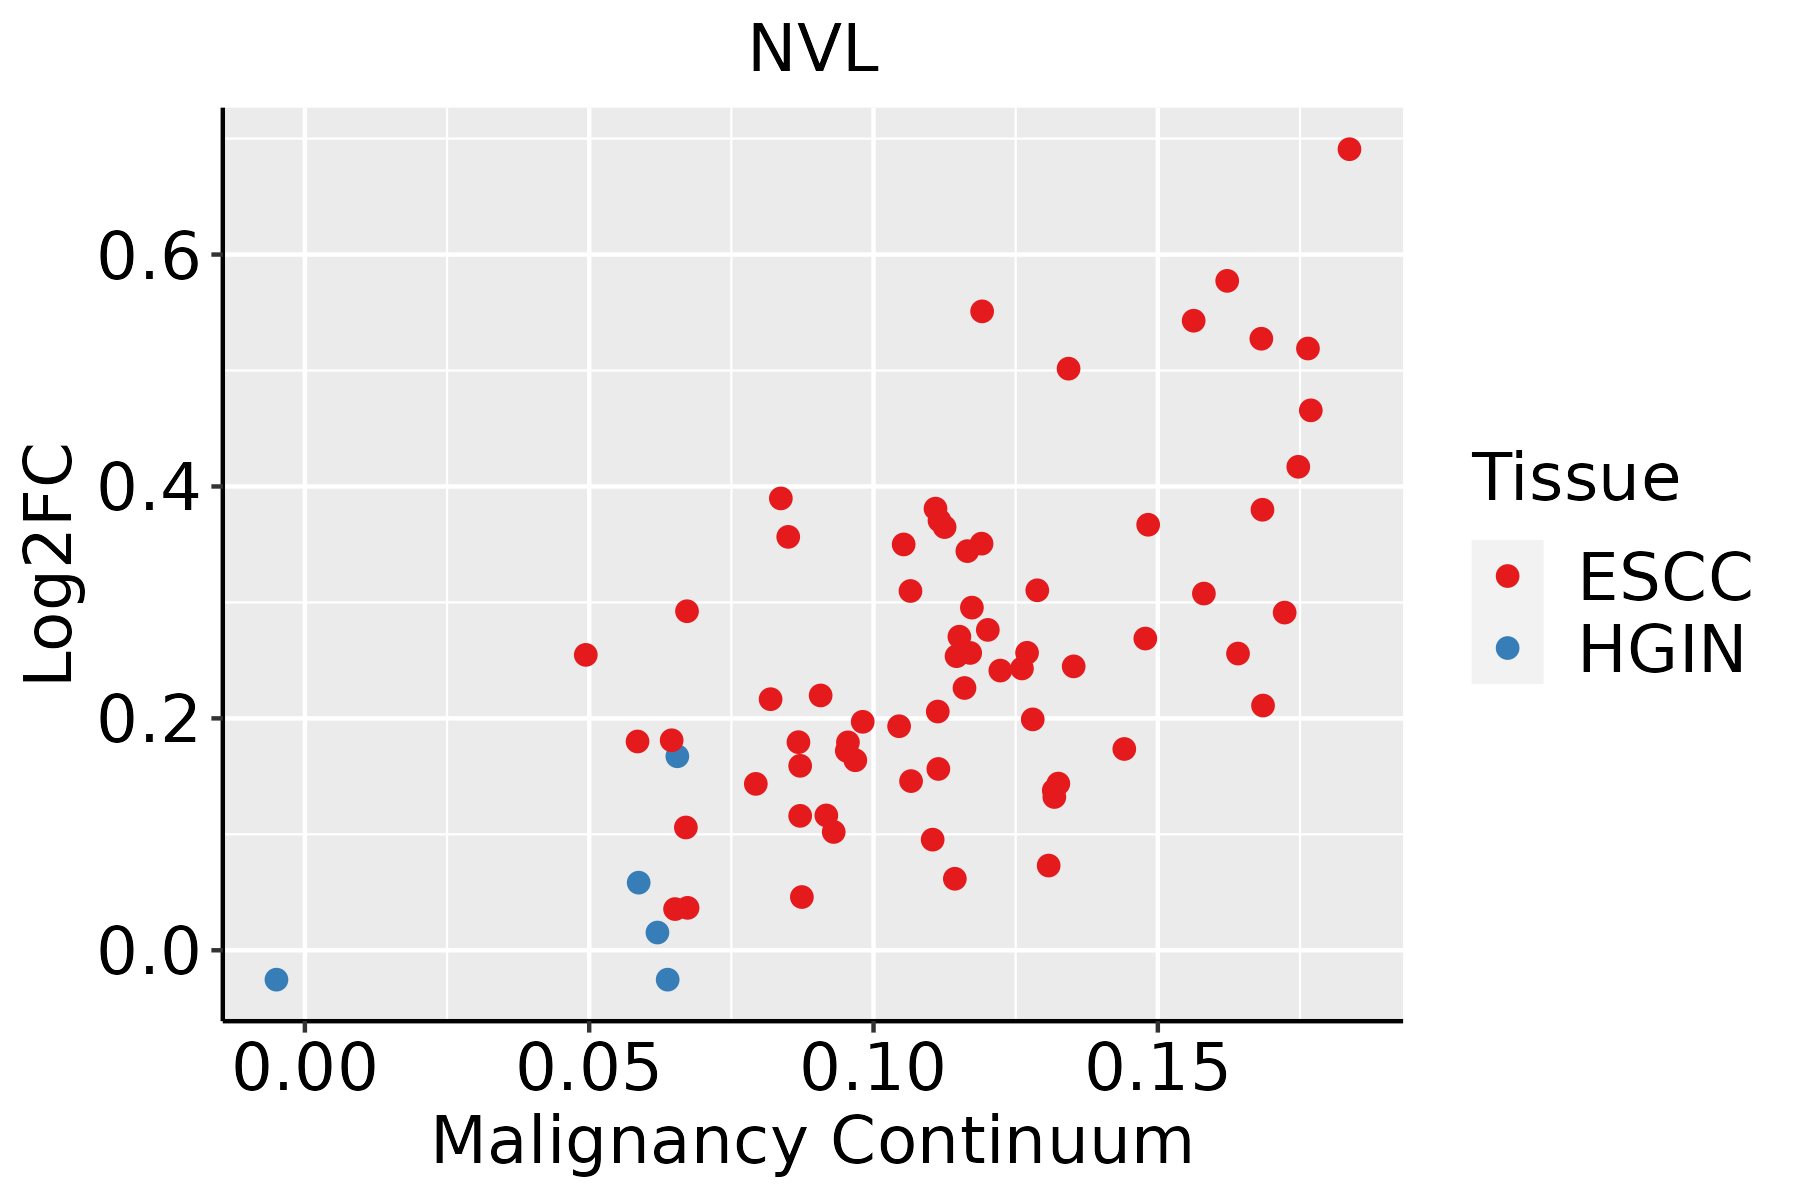
ESCC: Esophageal squamous cell carcinoma
HGIN: High-grade intraepithelial neoplasias
LGIN: Low-grade intraepithelial neoplasias
LiverThe image shows the transcriptomic changes along malignancy continuum.log2FC in expression of this searched gene in stem-like cells from each diseased tissue sample relative to stem-like cells in normal samples in each tissue plotted against the malignancy continuum. Samples are colored based on if they are from different disease stage.HCC: Hepatocellular carcinoma
NAFLD: Non-alcoholic fatty liver disease
∗log2FC in expression of this searched gene in stem-like cells from each diseased tissue sample relative to stem-like cells in normal samples in each tissue plotted against the malignancy continuum. Samples are colored based on if they are from different disease stage.

Top

Malignant transformation related pathway analysis

check buttonFind out the enriched GO biological processes and KEGG pathways involved in transition from healthy to precancer to cancer
check button Figure of enriched GO biological processes.
TissueDisease StageEnriched GO biological Processes
ColorectumADGO analysis - Figure of enriched GO biological processes: Top 15 enriched GO BP terms are showed in the bar plot of each disease state in each tissue. Each row represents a significant GO biological process which is colored according to the -log10(p.adjust).
ColorectumSERGO analysis - Figure of enriched GO biological processes: Top 15 enriched GO BP terms are showed in the bar plot of each disease state in each tissue. Each row represents a significant GO biological process which is colored according to the -log10(p.adjust).
ColorectumMSSGO analysis - Figure of enriched GO biological processes: Top 15 enriched GO BP terms are showed in the bar plot of each disease state in each tissue. Each row represents a significant GO biological process which is colored according to the -log10(p.adjust).
ColorectumMSI-HGO analysis - Figure of enriched GO biological processes: Top 15 enriched GO BP terms are showed in the bar plot of each disease state in each tissue. Each row represents a significant GO biological process which is colored according to the -log10(p.adjust).
ColorectumFAPGO analysis - Figure of enriched GO biological processes: Top 15 enriched GO BP terms are showed in the bar plot of each disease state in each tissue. Each row represents a significant GO biological process which is colored according to the -log10(p.adjust).
∗Top 15 enriched GO BP terms are showed in the bar plot of each disease state in each tissue. Each row represents a significant GO biological process which is colored according to the -log10(p.adjust).
Page: 1 2 3 4 5 6 7 8 9 

check button Enriched GO biological processes.
GO IDTissueDisease StageDescriptionGene RatioBg Ratiopvaluep.adjustCount
GO:0051098ColorectumADregulation of binding126/3918363/187236.01e-104.88e-08126
GO:0022613ColorectumADribonucleoprotein complex biogenesis151/3918463/187231.96e-091.39e-07151
GO:0051099ColorectumADpositive regulation of binding66/3918173/187231.47e-076.64e-0666
GO:1900180ColorectumADregulation of protein localization to nucleus55/3918136/187231.70e-077.34e-0655
GO:0051052ColorectumADregulation of DNA metabolic process116/3918359/187232.47e-071.00e-05116
GO:0051054ColorectumADpositive regulation of DNA metabolic process73/3918201/187233.27e-071.29e-0573
GO:0034504ColorectumADprotein localization to nucleus94/3918290/187232.83e-068.09e-0594
GO:0043393ColorectumADregulation of protein binding68/3918196/187235.17e-061.34e-0468
GO:2000278ColorectumADregulation of DNA biosynthetic process41/3918106/187232.17e-054.33e-0441
GO:2000573ColorectumADpositive regulation of DNA biosynthetic process28/391866/187236.35e-051.05e-0328
GO:0051972ColorectumADregulation of telomerase activity22/391847/187236.45e-051.07e-0322
GO:0032092ColorectumADpositive regulation of protein binding33/391885/187231.22e-041.78e-0333
GO:0051973ColorectumADpositive regulation of telomerase activity17/391834/187231.59e-042.20e-0317
GO:0042273ColorectumADribosomal large subunit biogenesis28/391872/187233.74e-044.31e-0328
GO:0071897ColorectumADDNA biosynthetic process55/3918180/187231.46e-031.24e-0255
GO:0042254ColorectumADribosome biogenesis84/3918299/187231.82e-031.50e-0284
GO:00226132ColorectumMSSribonucleoprotein complex biogenesis144/3467463/187232.76e-113.67e-09144
GO:00510982ColorectumMSSregulation of binding113/3467363/187233.55e-092.41e-07113
GO:19001802ColorectumMSSregulation of protein localization to nucleus54/3467136/187236.20e-093.95e-0754
GO:00345042ColorectumMSSprotein localization to nucleus92/3467290/187233.66e-081.98e-0692
Page: 1 2 3 4 5 

check button Enriched KEGG pathways.
Pathway IDTissueDisease StageDescriptionGene RatioBg Ratiopvaluep.adjustqvalueCount
Page: 1 

Top

Cell-cell communication analysis

check buttonIdentification of potential cell-cell interactions between two cell types and their ligand-receptor pairs for different disease states
LigandReceptorLRpairPathwayTissueDisease Stage
Page: 1 

Top

Single-cell gene regulatory network inference analysis

check buttonFind out the significant the regulons (TFs) and the target genes of each regulon across cell types for different disease states
TFCell TypeTissueDisease StageTarget GeneRSSRegulon Activity
∗The dot plots of a searched regulon are shown for all cell subpopulations in each disease state of each tissue based on the regulon specific score inferred using pySCENIC and by calculating the average expression.
Page: 1 

Top

Somatic mutation of malignant transformation related genes

check buttonAnnotation of somatic variants for genes involved in malignant transformation
Hugo SymbolVariant ClassVariant ClassificationdbSNP RSHGVScHGVSpHGVSp ShortSWISSPROTBIOTYPESIFTPolyPhenTumor Sample BarcodeTissueHistologySexAgeStageTherapy TypesDrugsOutcome
NVLSNVMissense_Mutationrs755757900c.1366G>Ap.Ala456Thrp.A456TO15381protein_codingtolerated(0.44)benign(0)TCGA-A2-A0CX-01Breastbreast invasive carcinomaFemale<65I/IIChemotherapyadriamycinSD
NVLSNVMissense_Mutationrs751450518c.1543N>Gp.Arg515Glyp.R515GO15381protein_codingtolerated(0.41)benign(0)TCGA-A8-A09A-01Breastbreast invasive carcinomaFemale<65I/IIHormone TherapytamoxiphenSD
NVLSNVMissense_Mutationc.2527G>Ap.Asp843Asnp.D843NO15381protein_codingdeleterious(0.02)possibly_damaging(0.717)TCGA-A8-A09K-01Breastbreast invasive carcinomaFemale>=65I/IIUnknownUnknownSD
NVLSNVMissense_Mutationnovelc.968N>Cp.Asp323Alap.D323AO15381protein_codingtolerated(0.22)benign(0.014)TCGA-AQ-A1H3-01Breastbreast invasive carcinomaFemale<65III/IVChemotherapyadriamycinSD
NVLSNVMissense_Mutationnovelc.968A>Cp.Asp323Alap.D323AO15381protein_codingtolerated(0.22)benign(0.014)TCGA-BH-A1F5-01Breastbreast invasive carcinomaFemale<65I/IIUnknownUnknownSD
NVLSNVMissense_Mutationrs376797399c.2078G>Ap.Arg693Glnp.R693QO15381protein_codingtolerated(0.59)benign(0.108)TCGA-C8-A3M7-01Breastbreast invasive carcinomaFemale<65III/IVUnknownUnknownPD
NVLSNVMissense_Mutationc.2401T>Gp.Ser801Alap.S801AO15381protein_codingtolerated(0.35)benign(0.076)TCGA-D8-A1JK-01Breastbreast invasive carcinomaFemale>=65I/IIUnknownUnknownSD
NVLSNVMissense_Mutationnovelc.968N>Cp.Asp323Alap.D323AO15381protein_codingtolerated(0.22)benign(0.014)TCGA-D8-A1JP-01Breastbreast invasive carcinomaFemale>=65I/IIHormone TherapytamoxiphenSD
NVLSNVMissense_Mutationnovelc.1885A>Gp.Thr629Alap.T629AO15381protein_codingdeleterious(0)probably_damaging(0.999)TCGA-JL-A3YW-01Breastbreast invasive carcinomaFemale<65I/IIUnknownUnknownSD
NVLSNVMissense_Mutationrs761421541c.2351G>Ap.Arg784Hisp.R784HO15381protein_codingdeleterious(0.04)benign(0.013)TCGA-2W-A8YY-01Cervixcervical & endocervical cancerFemale<65I/IIChemotherapycisplatinCR
Page: 1 2 3 4 5 6 7 8 9 

Top

Related drugs of malignant transformation related genes

check buttonIdentification of chemicals and drugs interact with genes involved in malignant transfromation
(DGIdb 4.0)
Entrez IDSymbolCategoryInteraction TypesDrug Claim NameDrug NamePMIDs
Page: 1