Schematic overview of the cellular and molecular mechanisms involved in the cancer progression, including the proposed cellular and molecular mechanisms in cancer cells trajectory. AT1: alveolar type 1 cells; AT2: alveolar type 2 cells; AAH: atypical adenomatous hyperplasia; AIS: adenocarcinoma in situ; MIA: minimally invasive adenocarcinoma; IA: invasive adenocarcinoma; EMT: epithelial-mesenchymal transition

Home

Download

Statistics

Help

Contact

Center for Computational Systems Medicine
leaf

Gene summary

leaf

Malignant transformation analysis

leaf

Malignant transformation related pathway analysis

leaf

Cell-cell communication analysis

leaf

Single-cell gene regulatory network inference analysis

leaf

Somatic mutation of malignant transformation related genes

leaf

Related drugs of malignant transformation related genes

Gene: NUDT5

Gene summary for NUDT5

check button Gene summary.

Gene informationSpeciesHuman
Gene symbol

NUDT5

Gene ID

11164

Gene namenudix hydrolase 5
Gene AliasYSA1
Cytomap10p14
Gene Typeprotein-coding
GO ID

GO:0005975

UniProtAcc

Q9UKK9


Top

Malignant transformation analysis

check button Identification of the aberrant gene expression in precancerous and cancerous lesions by comparing the gene expression of stem-like cells in diseased tissues with normal stem cells
check button Malignant transformation involving gene list.
Entrez IDSymbolReplicatesSpeciesOrganTissueAdj P-valueLog2FCMalignancy
11164NUDT5P54T-EHumanEsophagusESCC1.10e-429.13e-010.0975
11164NUDT5P56T-EHumanEsophagusESCC1.80e-049.57e-010.1613
11164NUDT5P57T-EHumanEsophagusESCC4.23e-184.21e-010.0926
11164NUDT5P61T-EHumanEsophagusESCC2.16e-079.59e-020.099
11164NUDT5P62T-EHumanEsophagusESCC1.11e-417.19e-010.1302
11164NUDT5P65T-EHumanEsophagusESCC1.57e-276.80e-010.0978
11164NUDT5P74T-EHumanEsophagusESCC6.90e-631.94e+000.1479
11164NUDT5P75T-EHumanEsophagusESCC6.54e-551.14e+000.1125
11164NUDT5P76T-EHumanEsophagusESCC2.27e-326.66e-010.1207
11164NUDT5P79T-EHumanEsophagusESCC1.80e-275.35e-010.1154
11164NUDT5P80T-EHumanEsophagusESCC5.43e-341.07e+000.155
11164NUDT5P82T-EHumanEsophagusESCC3.97e-181.11e+000.1072
11164NUDT5P83T-EHumanEsophagusESCC1.82e-692.28e+000.1738
11164NUDT5P84T-EHumanEsophagusESCC2.15e-055.67e-010.0933
11164NUDT5P89T-EHumanEsophagusESCC2.76e-181.48e+000.1752
11164NUDT5P91T-EHumanEsophagusESCC2.99e-212.75e+000.1828
11164NUDT5P104T-EHumanEsophagusESCC1.36e-045.98e-010.0931
11164NUDT5P107T-EHumanEsophagusESCC1.42e-481.18e+000.171
11164NUDT5P126T-EHumanEsophagusESCC7.82e-078.60e-010.1125
11164NUDT5P127T-EHumanEsophagusESCC1.68e-204.77e-010.0826
Page: 1 2 3 4 5 6 7 8 

check button Transcriptomic changes along malignancy continuum.
TissueExpression DynamicsAbbreviation
BreastThe image shows the transcriptomic changes along malignancy continuum.log2FC in expression of this searched gene in stem-like cells from each diseased tissue sample relative to stem-like cells in normal samples in each tissue plotted against the malignancy continuum. Samples are colored based on if they are from different disease stage.
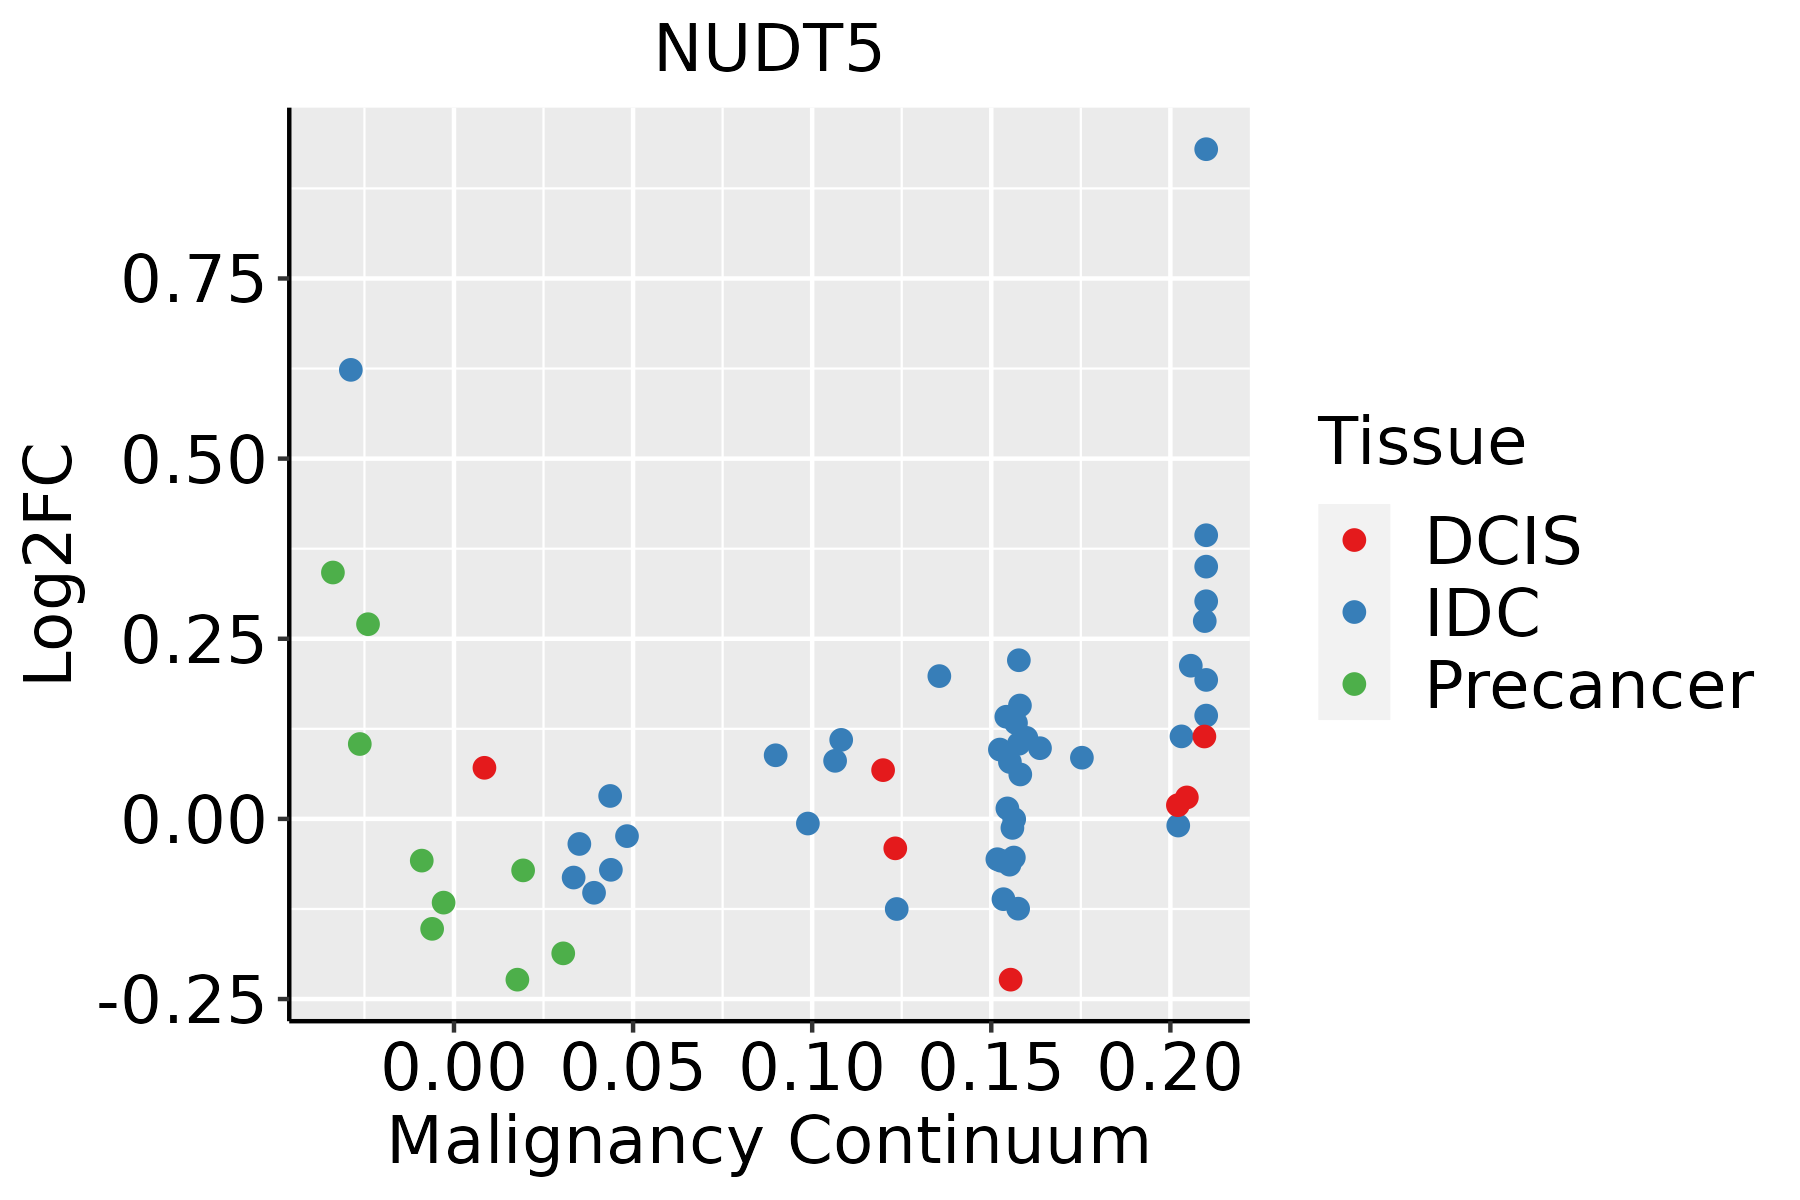
IDC: Invasive ductal carcinoma
DCIS: Ductal carcinoma in situ
Precancer(BRCA1-mut): Precancerous lesion from BRCA1 mutation carriers
EsophagusThe image shows the transcriptomic changes along malignancy continuum.log2FC in expression of this searched gene in stem-like cells from each diseased tissue sample relative to stem-like cells in normal samples in each tissue plotted against the malignancy continuum. Samples are colored based on if they are from different disease stage.
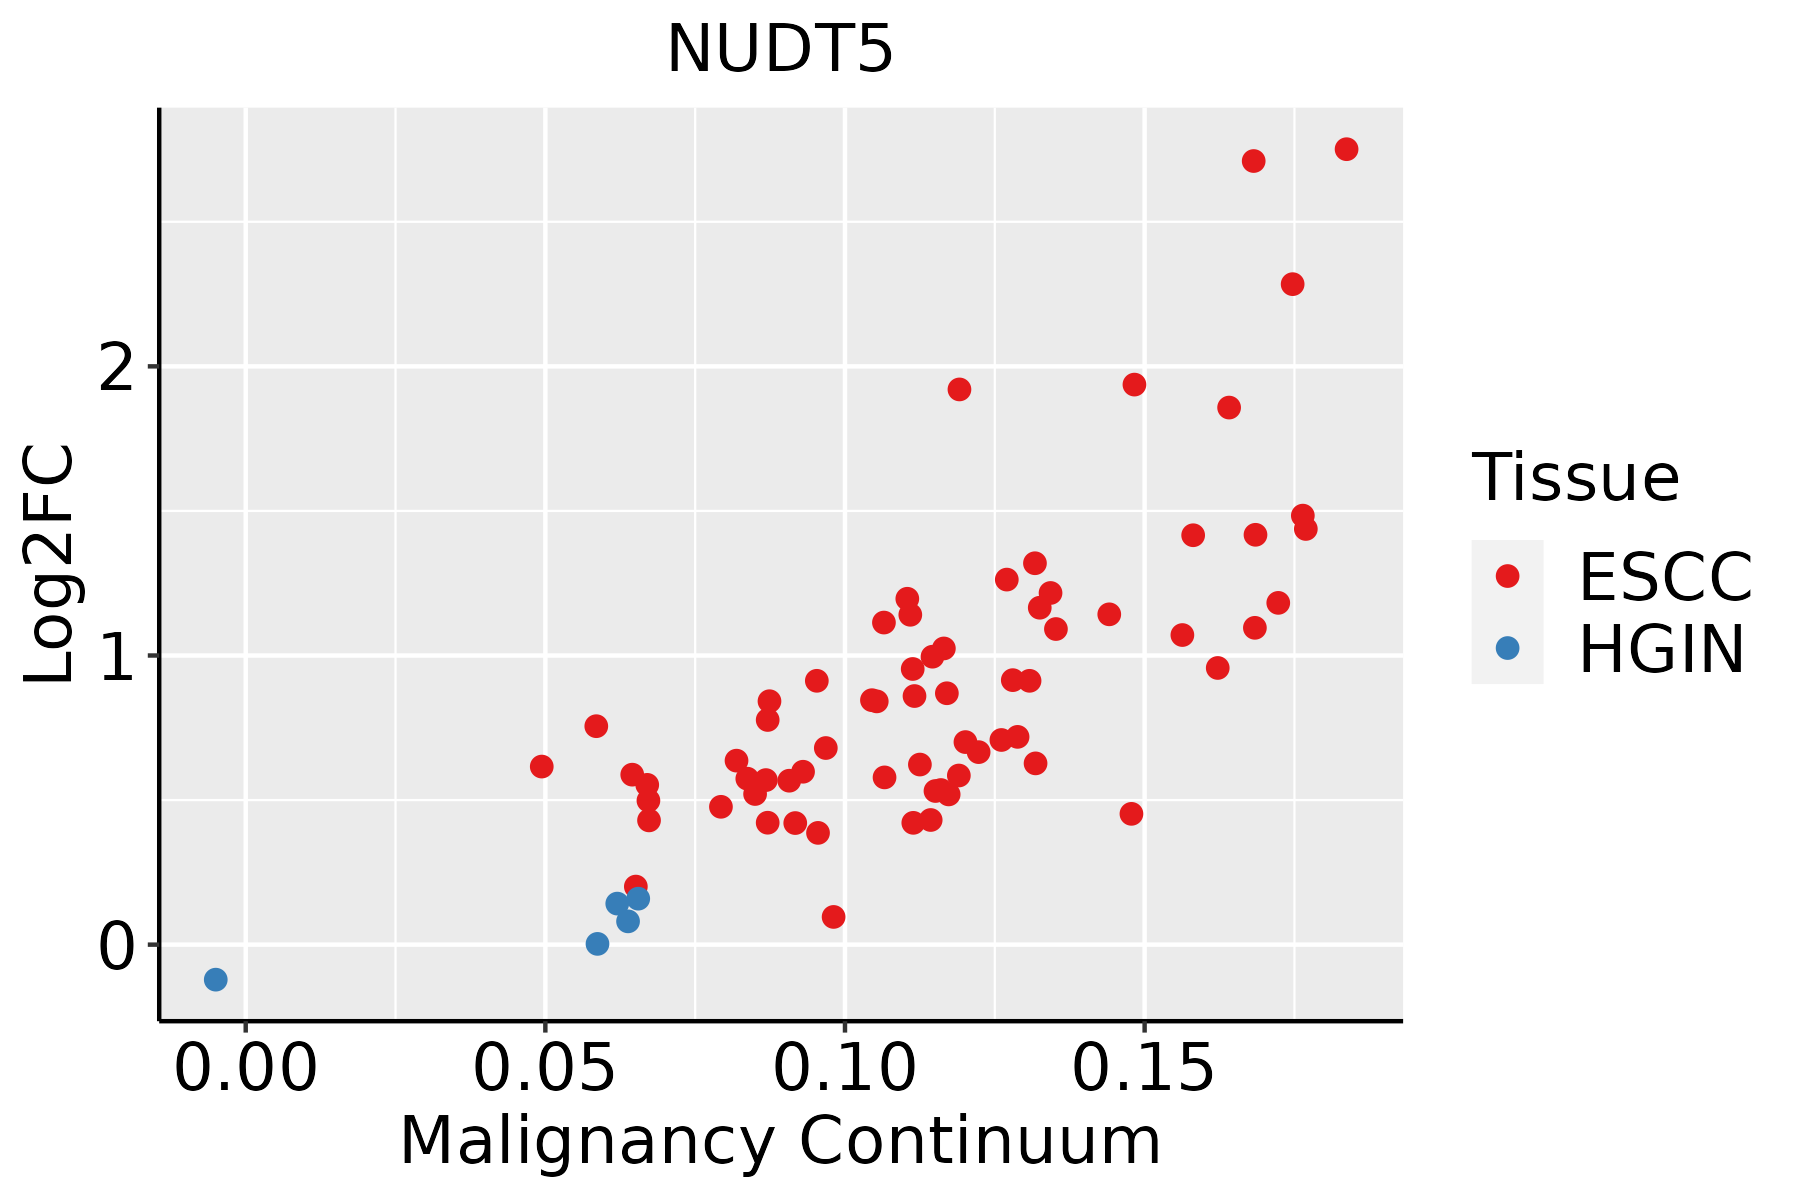
ESCC: Esophageal squamous cell carcinoma
HGIN: High-grade intraepithelial neoplasias
LGIN: Low-grade intraepithelial neoplasias
LiverThe image shows the transcriptomic changes along malignancy continuum.log2FC in expression of this searched gene in stem-like cells from each diseased tissue sample relative to stem-like cells in normal samples in each tissue plotted against the malignancy continuum. Samples are colored based on if they are from different disease stage.HCC: Hepatocellular carcinoma
NAFLD: Non-alcoholic fatty liver disease
Oral CavityThe image shows the transcriptomic changes along malignancy continuum.log2FC in expression of this searched gene in stem-like cells from each diseased tissue sample relative to stem-like cells in normal samples in each tissue plotted against the malignancy continuum. Samples are colored based on if they are from different disease stage.EOLP: Erosive Oral lichen planus
LP: leukoplakia
NEOLP: Non-erosive oral lichen planus
OSCC: Oral squamous cell carcinoma
SkinThe image shows the transcriptomic changes along malignancy continuum.log2FC in expression of this searched gene in stem-like cells from each diseased tissue sample relative to stem-like cells in normal samples in each tissue plotted against the malignancy continuum. Samples are colored based on if they are from different disease stage.AK: Actinic keratosis
cSCC: Cutaneous squamous cell carcinoma
SCCIS:squamous cell carcinoma in situ
ThyroidThe image shows the transcriptomic changes along malignancy continuum.log2FC in expression of this searched gene in stem-like cells from each diseased tissue sample relative to stem-like cells in normal samples in each tissue plotted against the malignancy continuum. Samples are colored based on if they are from different disease stage.
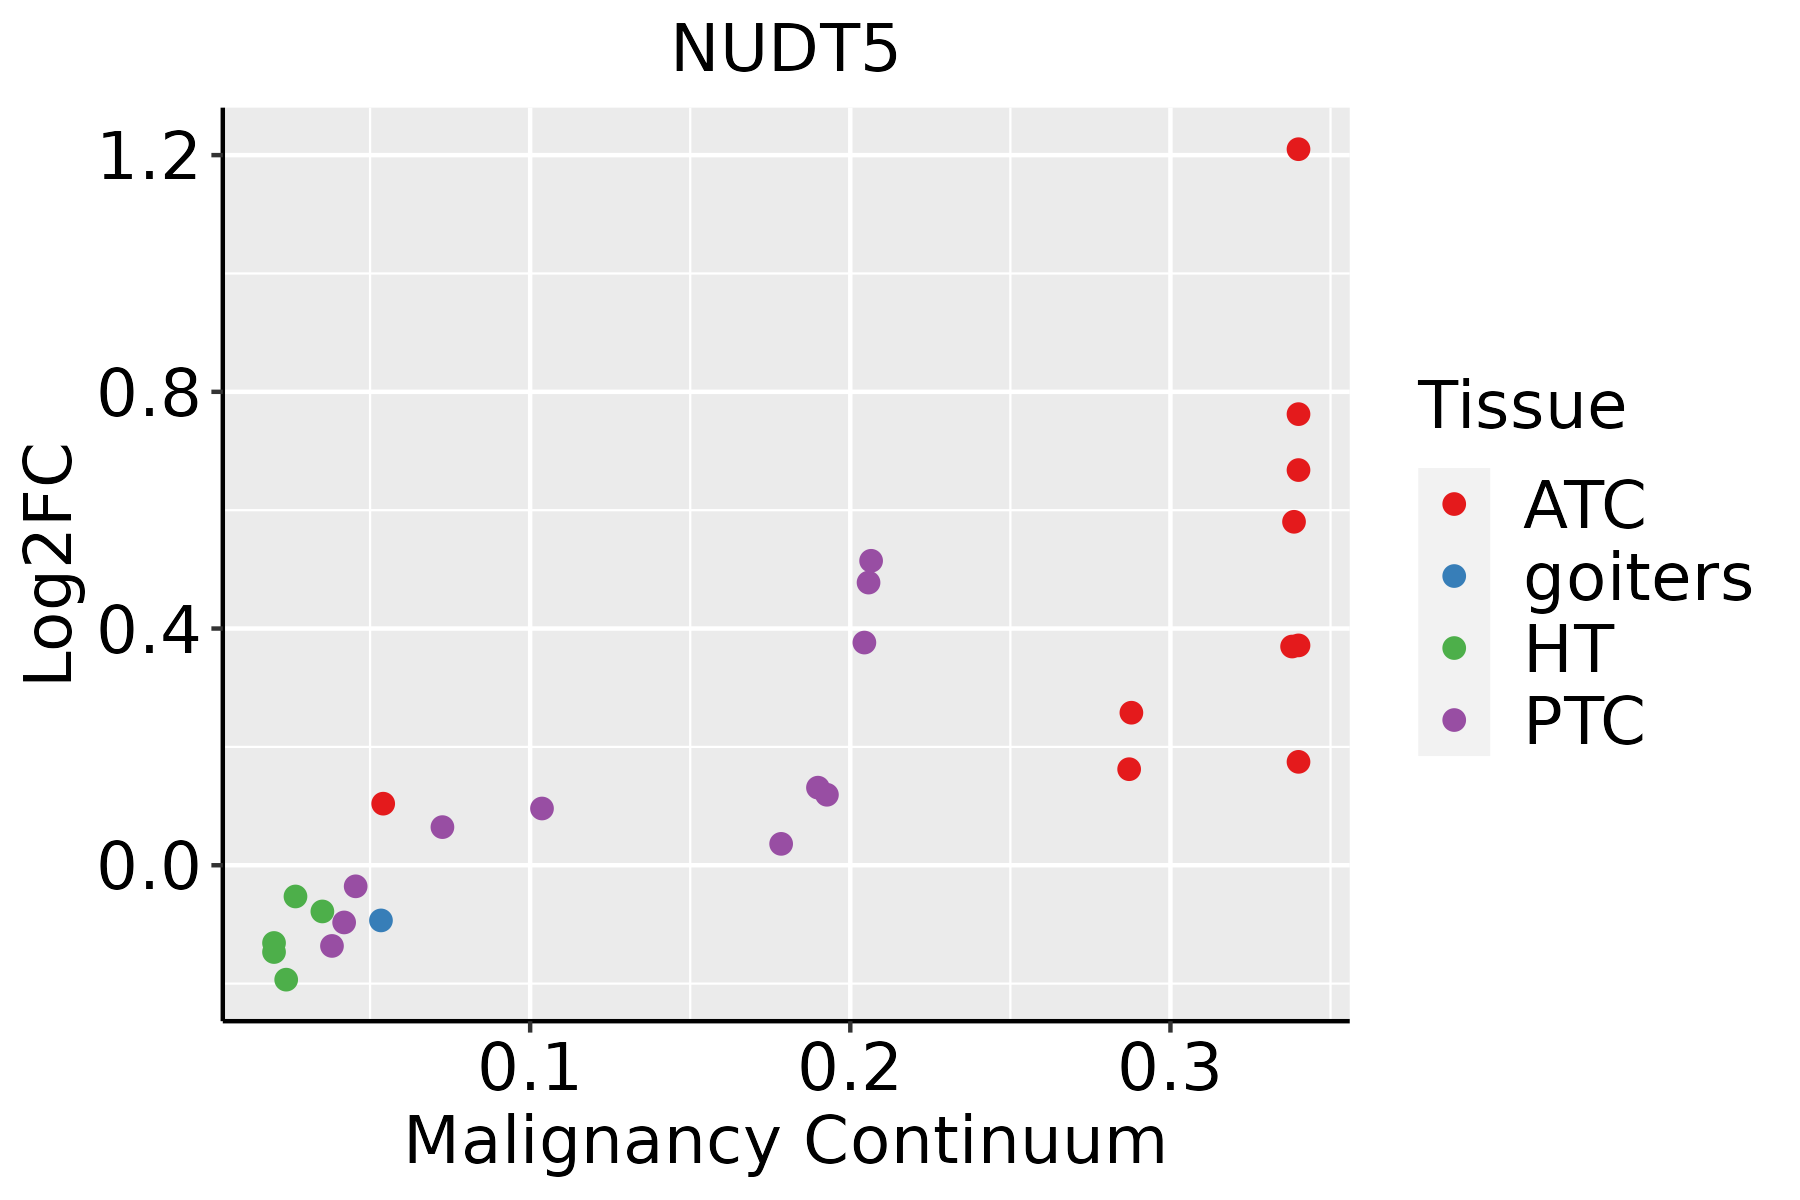
ATC: Anaplastic thyroid cancer
HT: Hashimoto's thyroiditis
PTC: Papillary thyroid cancer
∗log2FC in expression of this searched gene in stem-like cells from each diseased tissue sample relative to stem-like cells in normal samples in each tissue plotted against the malignancy continuum. Samples are colored based on if they are from different disease stage.

Top

Malignant transformation related pathway analysis

check buttonFind out the enriched GO biological processes and KEGG pathways involved in transition from healthy to precancer to cancer
check button Figure of enriched GO biological processes.
TissueDisease StageEnriched GO biological Processes
ColorectumADGO analysis - Figure of enriched GO biological processes: Top 15 enriched GO BP terms are showed in the bar plot of each disease state in each tissue. Each row represents a significant GO biological process which is colored according to the -log10(p.adjust).
ColorectumSERGO analysis - Figure of enriched GO biological processes: Top 15 enriched GO BP terms are showed in the bar plot of each disease state in each tissue. Each row represents a significant GO biological process which is colored according to the -log10(p.adjust).
ColorectumMSSGO analysis - Figure of enriched GO biological processes: Top 15 enriched GO BP terms are showed in the bar plot of each disease state in each tissue. Each row represents a significant GO biological process which is colored according to the -log10(p.adjust).
ColorectumMSI-HGO analysis - Figure of enriched GO biological processes: Top 15 enriched GO BP terms are showed in the bar plot of each disease state in each tissue. Each row represents a significant GO biological process which is colored according to the -log10(p.adjust).
ColorectumFAPGO analysis - Figure of enriched GO biological processes: Top 15 enriched GO BP terms are showed in the bar plot of each disease state in each tissue. Each row represents a significant GO biological process which is colored according to the -log10(p.adjust).
∗Top 15 enriched GO BP terms are showed in the bar plot of each disease state in each tissue. Each row represents a significant GO biological process which is colored according to the -log10(p.adjust).
Page: 1 2 3 4 5 6 7 8 9 

check button Enriched GO biological processes.
GO IDTissueDisease StageDescriptionGene RatioBg Ratiopvaluep.adjustCount
GO:00460349BreastPrecancerATP metabolic process82/1080277/187231.94e-365.19e-3382
GO:00196938BreastPrecancerribose phosphate metabolic process49/1080396/187233.81e-071.78e-0549
GO:00091179BreastPrecancernucleotide metabolic process56/1080489/187237.40e-073.00e-0556
GO:00067539BreastPrecancernucleoside phosphate metabolic process56/1080497/187231.24e-064.70e-0556
GO:00091858BreastPrecancerribonucleoside diphosphate metabolic process20/1080106/187232.37e-068.17e-0520
GO:00091328BreastPrecancernucleoside diphosphate metabolic process21/1080124/187237.98e-062.17e-0421
GO:00346558BreastPrecancernucleobase-containing compound catabolic process42/1080407/187231.91e-043.06e-0342
GO:00160527BreastPrecancercarbohydrate catabolic process21/1080154/187232.10e-043.28e-0321
GO:00467007BreastPrecancerheterocycle catabolic process44/1080445/187233.49e-044.88e-0344
GO:00442708BreastPrecancercellular nitrogen compound catabolic process44/1080451/187234.64e-046.12e-0344
GO:00194397BreastPrecanceraromatic compound catabolic process44/1080467/187239.55e-041.07e-0244
GO:19013617BreastPrecancerorganic cyclic compound catabolic process45/1080495/187231.73e-031.74e-0245
GO:00059966BreastPrecancermonosaccharide metabolic process27/1080257/187231.94e-031.88e-0227
GO:004603414BreastIDCATP metabolic process85/1434277/187236.42e-301.82e-2685
GO:001969314BreastIDCribose phosphate metabolic process58/1434396/187231.31e-065.73e-0558
GO:000675313BreastIDCnucleoside phosphate metabolic process68/1434497/187232.01e-068.23e-0568
GO:000911713BreastIDCnucleotide metabolic process67/1434489/187232.28e-069.05e-0567
GO:000913213BreastIDCnucleoside diphosphate metabolic process23/1434124/187236.08e-051.27e-0323
GO:000918513BreastIDCribonucleoside diphosphate metabolic process20/1434106/187231.41e-042.49e-0320
GO:190136112BreastIDCorganic cyclic compound catabolic process56/1434495/187232.12e-031.99e-0256
Page: 1 2 3 4 5 6 7 8 9 

check button Enriched KEGG pathways.
Pathway IDTissueDisease StageDescriptionGene RatioBg Ratiopvaluep.adjustqvalueCount
Page: 1 

Top

Cell-cell communication analysis

check buttonIdentification of potential cell-cell interactions between two cell types and their ligand-receptor pairs for different disease states
LigandReceptorLRpairPathwayTissueDisease Stage
Page: 1 

Top

Single-cell gene regulatory network inference analysis

check buttonFind out the significant the regulons (TFs) and the target genes of each regulon across cell types for different disease states
TFCell TypeTissueDisease StageTarget GeneRSSRegulon Activity
∗The dot plots of a searched regulon are shown for all cell subpopulations in each disease state of each tissue based on the regulon specific score inferred using pySCENIC and by calculating the average expression.
Page: 1 

Top

Somatic mutation of malignant transformation related genes

check buttonAnnotation of somatic variants for genes involved in malignant transformation
Hugo SymbolVariant ClassVariant ClassificationdbSNP RSHGVScHGVSpHGVSp ShortSWISSPROTBIOTYPESIFTPolyPhenTumor Sample BarcodeTissueHistologySexAgeStageTherapy TypesDrugsOutcome
NUDT5SNVMissense_Mutationc.307N>Ap.Glu103Lysp.E103KQ9UKK9protein_codingdeleterious(0)probably_damaging(0.997)TCGA-A2-A0CT-01Breastbreast invasive carcinomaFemale>=65I/IIChemotherapycytoxanSD
NUDT5insertionFrame_Shift_Insnovelc.202_203insACCCTGCCGTCTCCAGCCTTTTGAGTAATTGCCCp.Leu68HisfsTer19p.L68Hfs*19Q9UKK9protein_codingTCGA-AN-A0FV-01Breastbreast invasive carcinomaFemale<65I/IIUnknownUnknownSD
NUDT5deletionFrame_Shift_Delnovelc.490delGp.Asp164MetfsTer23p.D164Mfs*23Q9UKK9protein_codingTCGA-EW-A2FV-01Breastbreast invasive carcinomaFemale<65III/IVChemotherapydocetaxelSD
NUDT5SNVMissense_Mutationc.439N>Gp.Thr147Alap.T147AQ9UKK9protein_codingtolerated(0.61)benign(0.017)TCGA-G4-6588-01Colorectumcolon adenocarcinomaFemale<65I/IIUnknownUnknownSD
NUDT5SNVMissense_Mutationrs755821025c.151N>Tp.Arg51Cysp.R51CQ9UKK9protein_codingdeleterious(0)probably_damaging(0.965)TCGA-A5-A0G2-01Endometriumuterine corpus endometrioid carcinomaFemale<65III/IVUnknownUnknownSD
NUDT5SNVMissense_Mutationnovelc.611N>Gp.Leu204Argp.L204RQ9UKK9protein_codingdeleterious(0)probably_damaging(0.998)TCGA-A5-A1OF-01Endometriumuterine corpus endometrioid carcinomaFemale<65I/IIUnknownUnknownSD
NUDT5SNVMissense_Mutationc.472N>Ap.Pro158Thrp.P158TQ9UKK9protein_codingdeleterious(0)probably_damaging(0.993)TCGA-AP-A051-01Endometriumuterine corpus endometrioid carcinomaFemale>=65I/IIUnknownUnknownSD
NUDT5SNVMissense_Mutationnovelc.626N>Ap.Ala209Glup.A209EQ9UKK9protein_codingtolerated_low_confidence(1)benign(0)TCGA-AP-A0LM-01Endometriumuterine corpus endometrioid carcinomaFemale<65III/IVChemotherapycisplatinSD
NUDT5SNVMissense_Mutationnovelc.116C>Tp.Pro39Leup.P39LQ9UKK9protein_codingdeleterious(0)possibly_damaging(0.8)TCGA-AP-A1DV-01Endometriumuterine corpus endometrioid carcinomaFemale<65I/IIUnknownUnknownSD
NUDT5SNVMissense_Mutationrs755821025c.151N>Tp.Arg51Cysp.R51CQ9UKK9protein_codingdeleterious(0)probably_damaging(0.965)TCGA-AX-A05Z-01Endometriumuterine corpus endometrioid carcinomaFemale<65III/IVChemotherapyadriamycinSD
Page: 1 2 3 

Top

Related drugs of malignant transformation related genes

check buttonIdentification of chemicals and drugs interact with genes involved in malignant transfromation
(DGIdb 4.0)
Entrez IDSymbolCategoryInteraction TypesDrug Claim NameDrug NamePMIDs
Page: 1