
|
|||||
|
 | |
| |
| |
| |
| |
| |
|
Gene: NT5DC1 |
Gene summary for NT5DC1 |
| Gene information | Species | Human | Gene symbol | NT5DC1 | Gene ID | 221294 |
| Gene name | 5'-nucleotidase domain containing 1 | |
| Gene Alias | C6orf200 | |
| Cytomap | 6q22.1 | |
| Gene Type | protein-coding | GO ID | GO:0006793 | UniProtAcc | Q5TFE4 |
Top |
Malignant transformation analysis |
| Identification of the aberrant gene expression in precancerous and cancerous lesions by comparing the gene expression of stem-like cells in diseased tissues with normal stem cells |
| Entrez ID | Symbol | Replicates | Species | Organ | Tissue | Adj P-value | Log2FC | Malignancy |
| 221294 | NT5DC1 | NAFLD1 | Human | Liver | NAFLD | 5.24e-07 | 7.21e-01 | -0.04 |
| 221294 | NT5DC1 | S43 | Human | Liver | Cirrhotic | 3.19e-08 | -1.59e-01 | -0.0187 |
| 221294 | NT5DC1 | HCC1_Meng | Human | Liver | HCC | 2.78e-38 | -1.70e-01 | 0.0246 |
| 221294 | NT5DC1 | HCC2_Meng | Human | Liver | HCC | 3.30e-33 | 4.05e-02 | 0.0107 |
| 221294 | NT5DC1 | cirrhotic2 | Human | Liver | Cirrhotic | 8.50e-05 | 2.88e-02 | 0.0201 |
| 221294 | NT5DC1 | Pt14.d | Human | Liver | HCC | 2.69e-02 | -1.56e-01 | 0.0143 |
| 221294 | NT5DC1 | S014 | Human | Liver | HCC | 7.21e-11 | 5.52e-01 | 0.2254 |
| 221294 | NT5DC1 | S015 | Human | Liver | HCC | 1.06e-08 | 6.17e-01 | 0.2375 |
| 221294 | NT5DC1 | S016 | Human | Liver | HCC | 1.55e-17 | 6.46e-01 | 0.2243 |
| 221294 | NT5DC1 | S028 | Human | Liver | HCC | 3.02e-04 | 3.02e-01 | 0.2503 |
| 221294 | NT5DC1 | S029 | Human | Liver | HCC | 5.82e-07 | 5.20e-01 | 0.2581 |
| 221294 | NT5DC1 | RNA-P25T1-P25T1-1 | Human | Lung | AIS | 4.11e-07 | 5.00e-01 | -0.2116 |
| 221294 | NT5DC1 | RNA-P25T1-P25T1-2 | Human | Lung | AIS | 3.82e-02 | 6.80e-01 | -0.1941 |
| 221294 | NT5DC1 | RNA-P25T1-P25T1-4 | Human | Lung | AIS | 6.91e-08 | 6.78e-01 | -0.2119 |
| 221294 | NT5DC1 | RNA-P6T2-P6T2-1 | Human | Lung | IAC | 2.78e-06 | 3.51e-01 | -0.0166 |
| 221294 | NT5DC1 | RNA-P6T2-P6T2-2 | Human | Lung | IAC | 7.46e-09 | 3.57e-01 | -0.0132 |
| 221294 | NT5DC1 | RNA-P6T2-P6T2-3 | Human | Lung | IAC | 3.85e-07 | 2.87e-01 | -0.013 |
| 221294 | NT5DC1 | RNA-P6T2-P6T2-4 | Human | Lung | IAC | 5.99e-04 | 2.73e-01 | -0.0121 |
| 221294 | NT5DC1 | RNA-P7T1-P7T1-2 | Human | Lung | AIS | 3.14e-03 | 4.84e-01 | -0.0876 |
| 221294 | NT5DC1 | C04 | Human | Oral cavity | OSCC | 1.24e-03 | 4.31e-01 | 0.2633 |
| Page: 1 2 3 4 5 6 |
| Tissue | Expression Dynamics | Abbreviation |
| Esophagus | 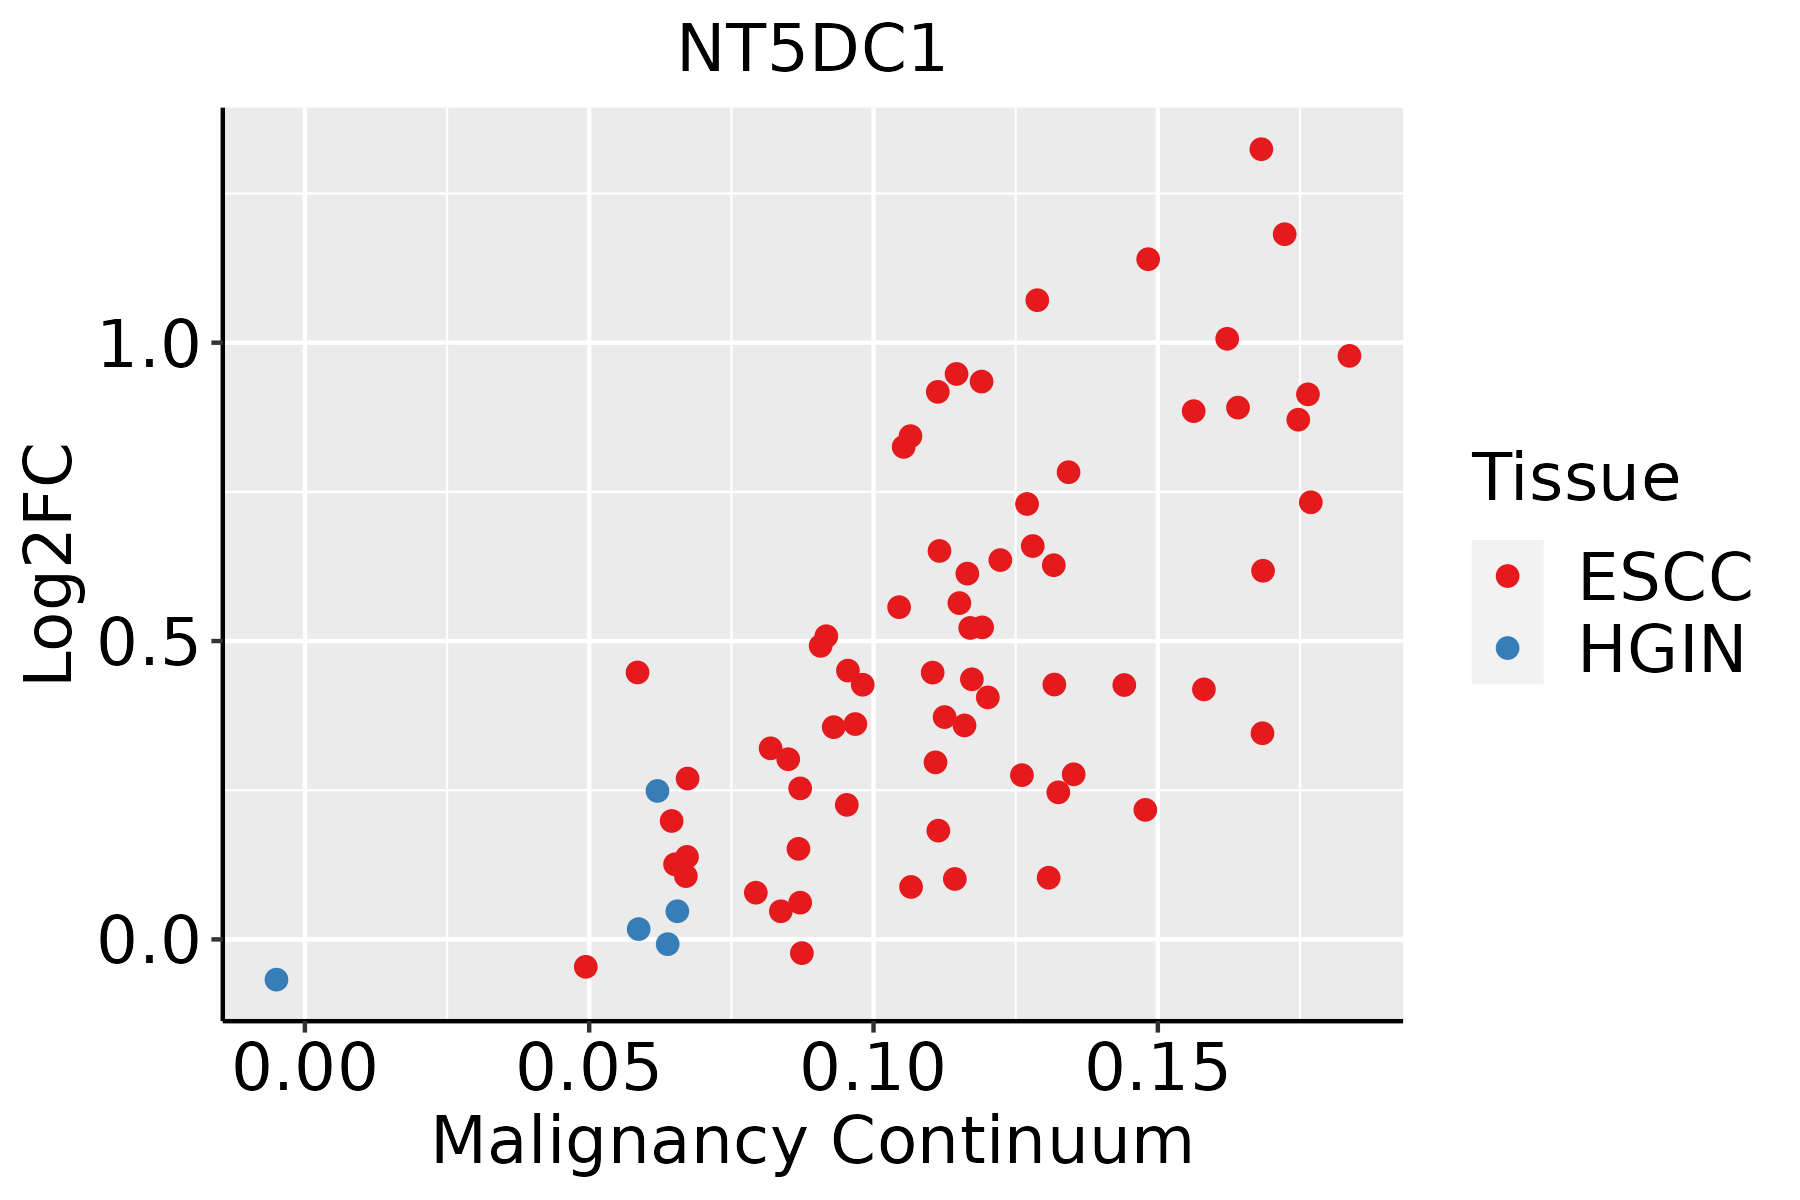 | ESCC: Esophageal squamous cell carcinoma |
| HGIN: High-grade intraepithelial neoplasias | ||
| LGIN: Low-grade intraepithelial neoplasias | ||
| Liver | 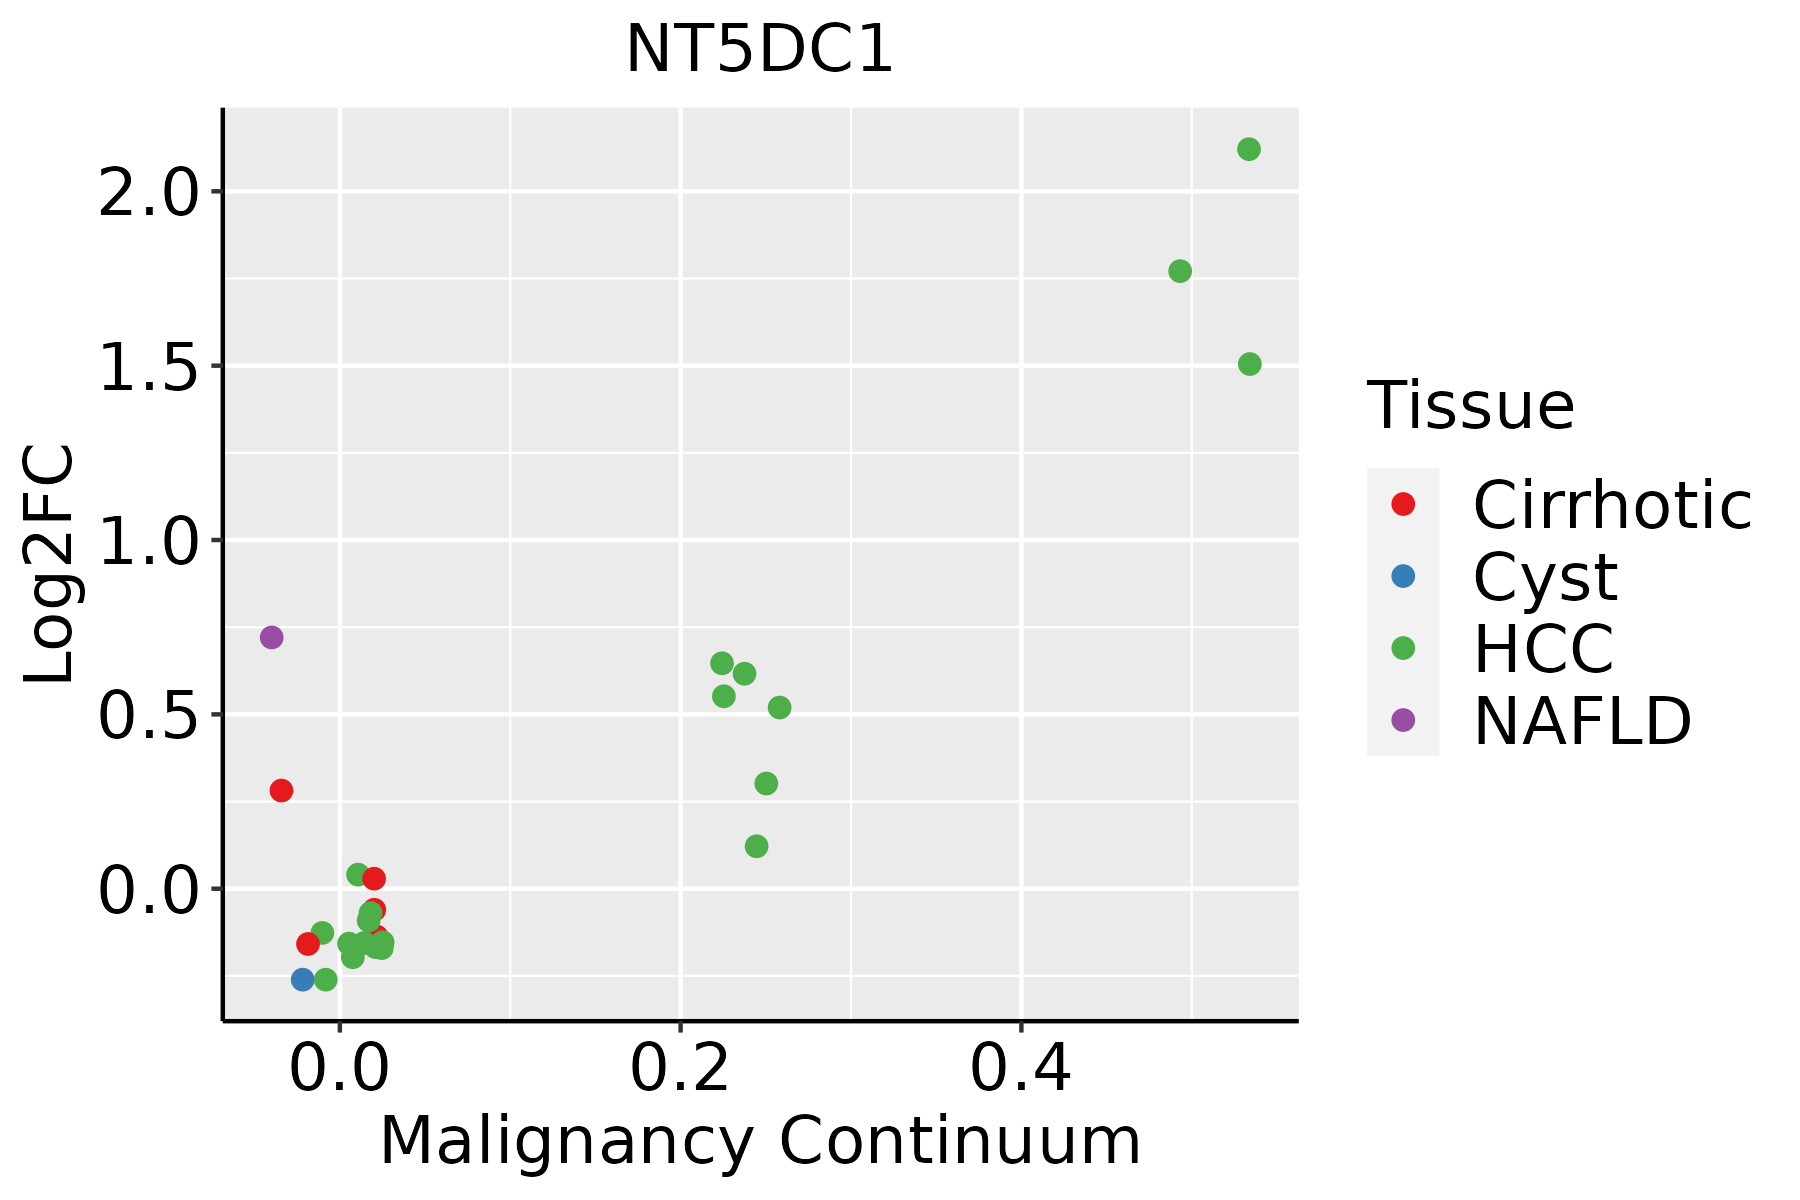 | HCC: Hepatocellular carcinoma |
| NAFLD: Non-alcoholic fatty liver disease | ||
| Lung | 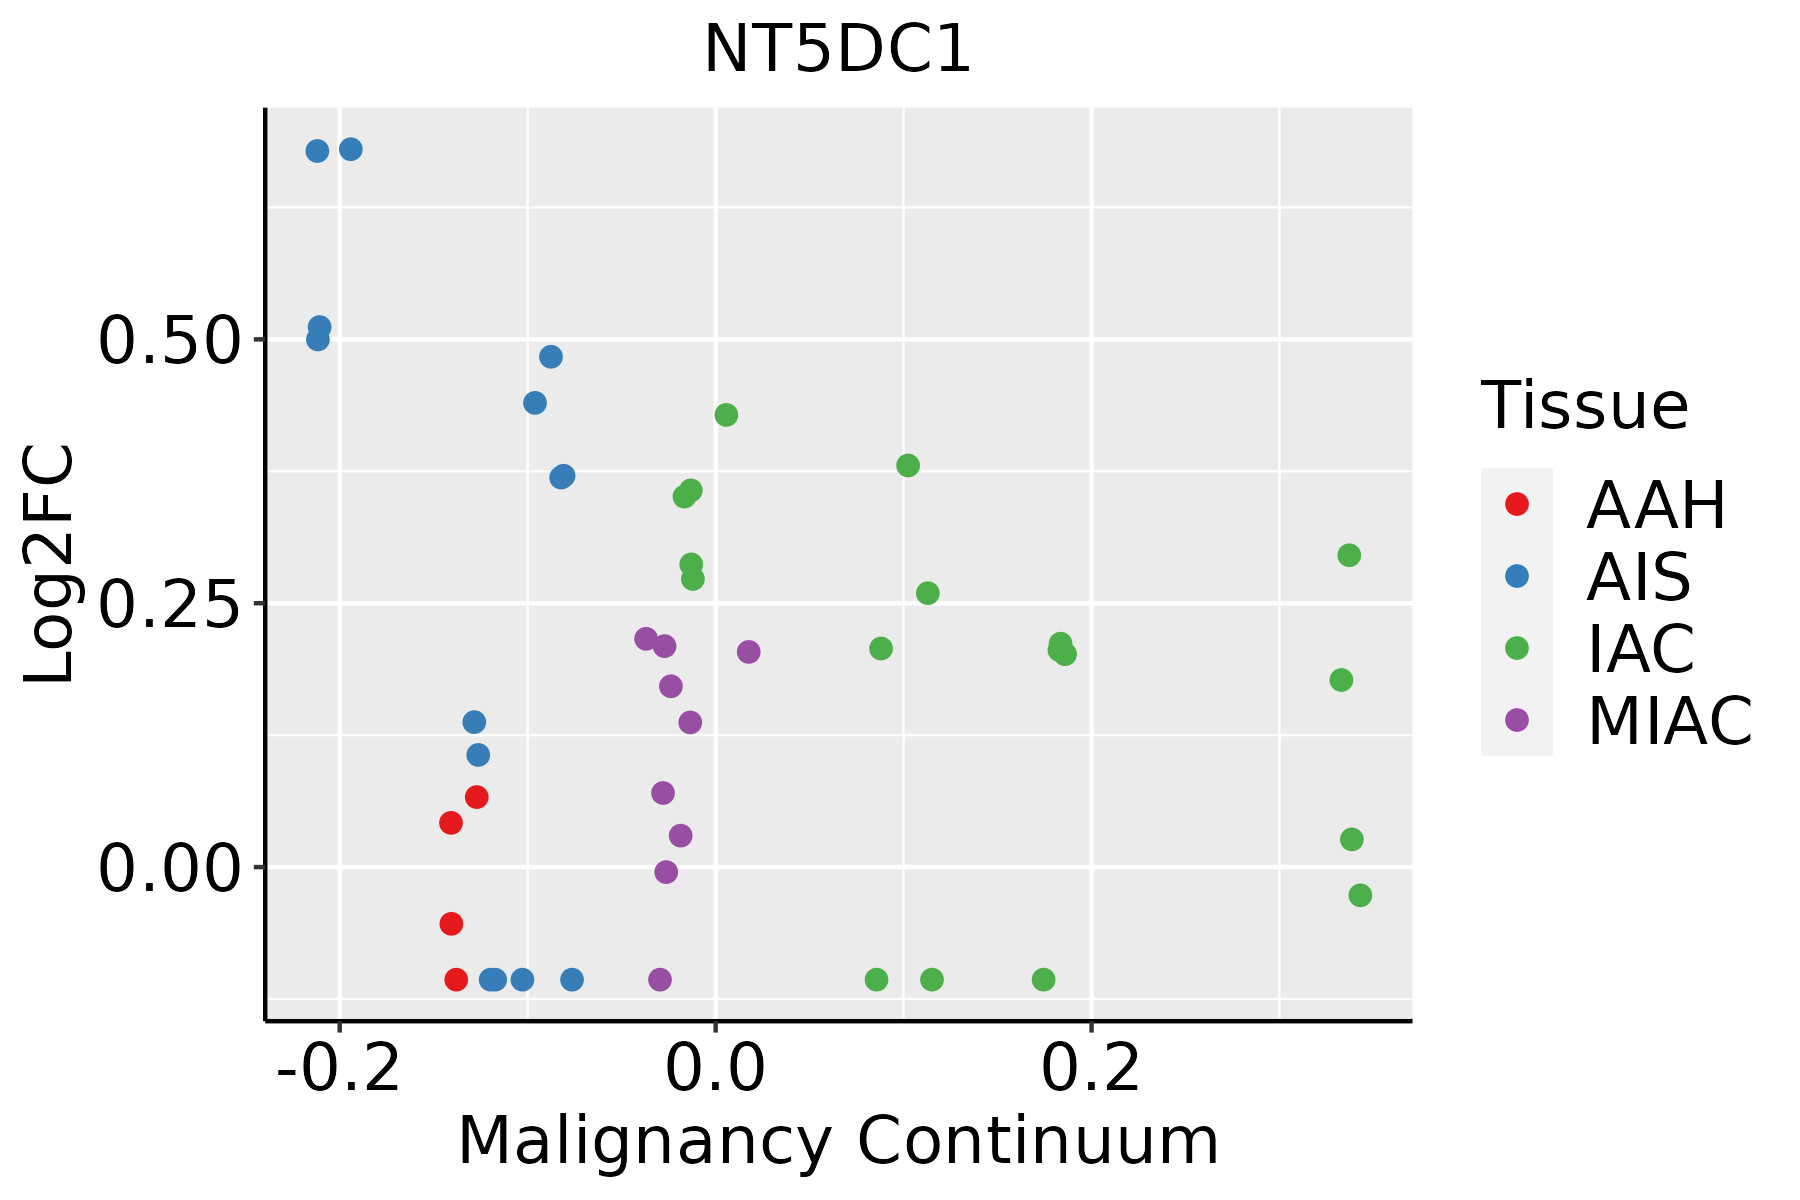 | AAH: Atypical adenomatous hyperplasia |
| AIS: Adenocarcinoma in situ | ||
| IAC: Invasive lung adenocarcinoma | ||
| MIA: Minimally invasive adenocarcinoma | ||
| Oral Cavity | 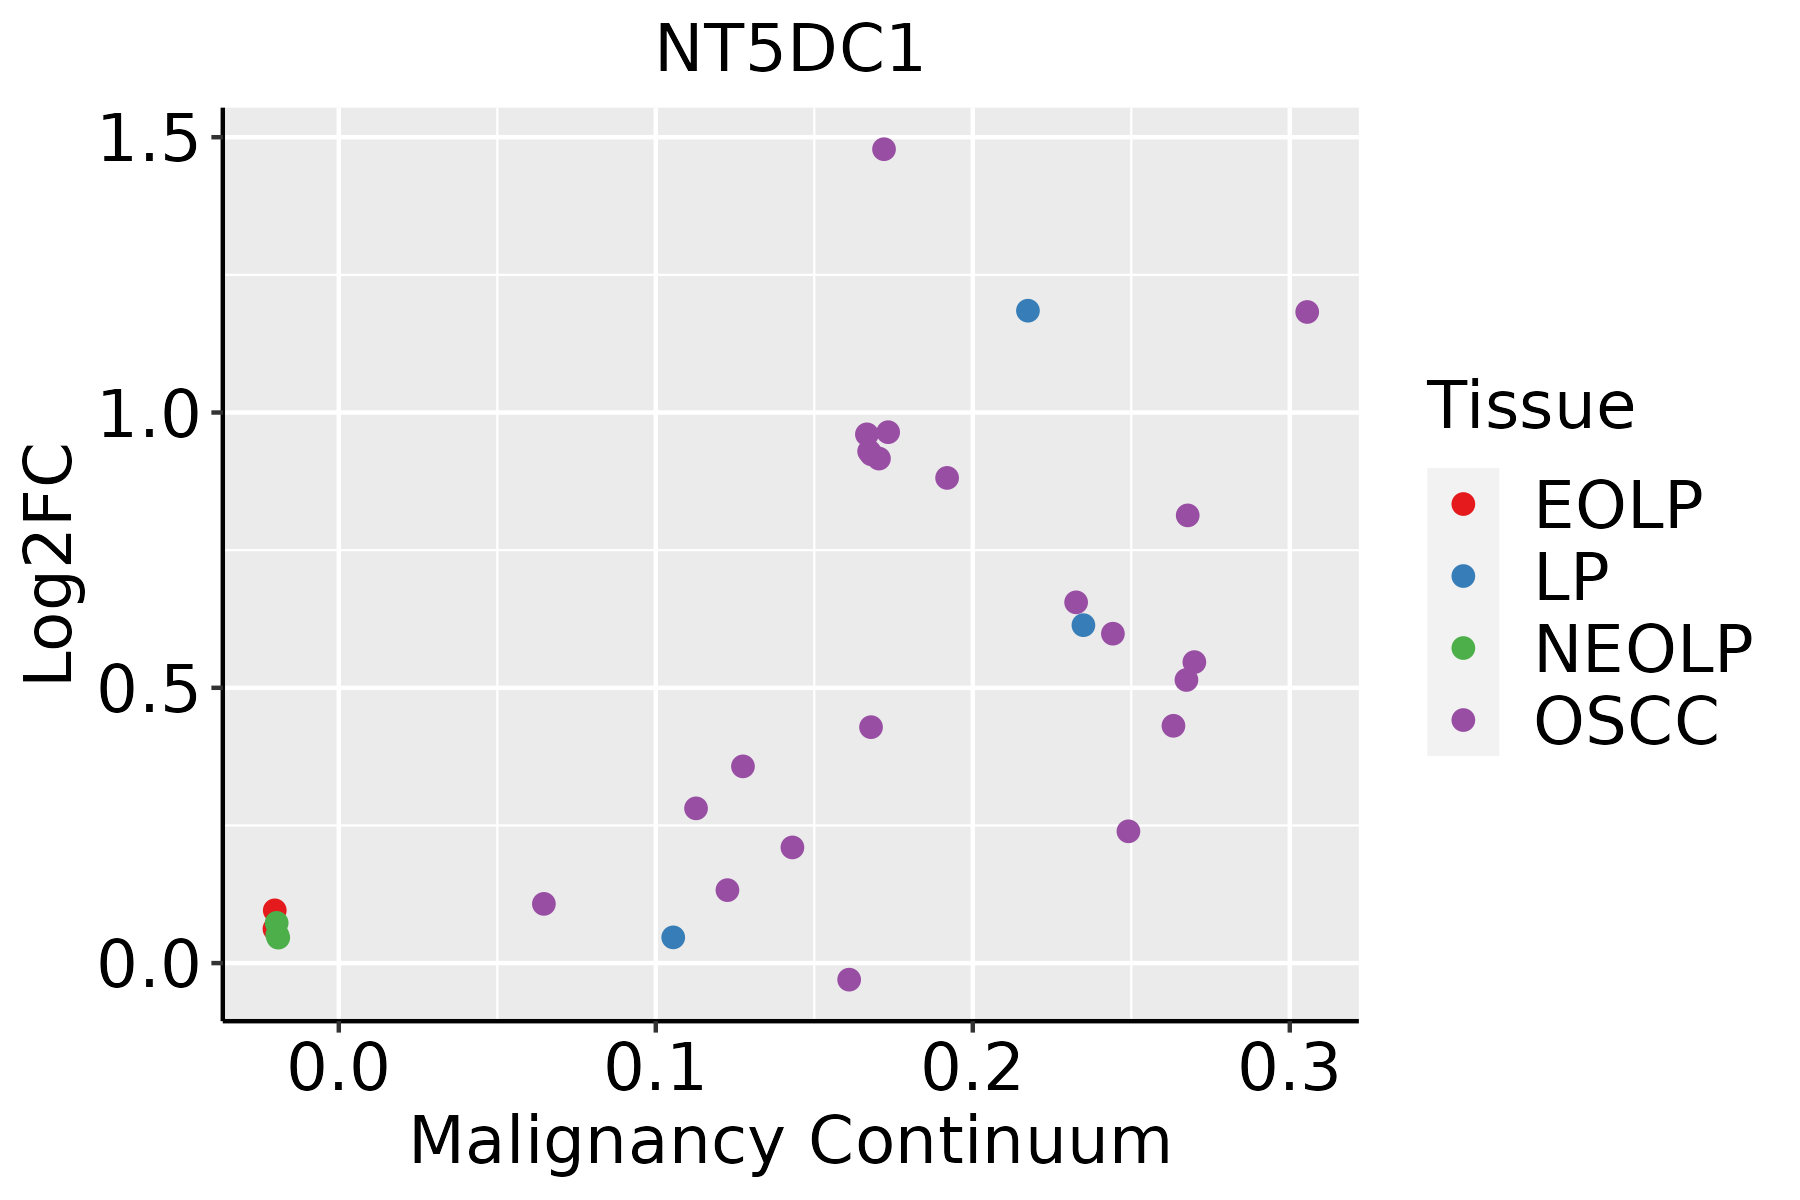 | EOLP: Erosive Oral lichen planus |
| LP: leukoplakia | ||
| NEOLP: Non-erosive oral lichen planus | ||
| OSCC: Oral squamous cell carcinoma | ||
| Prostate | 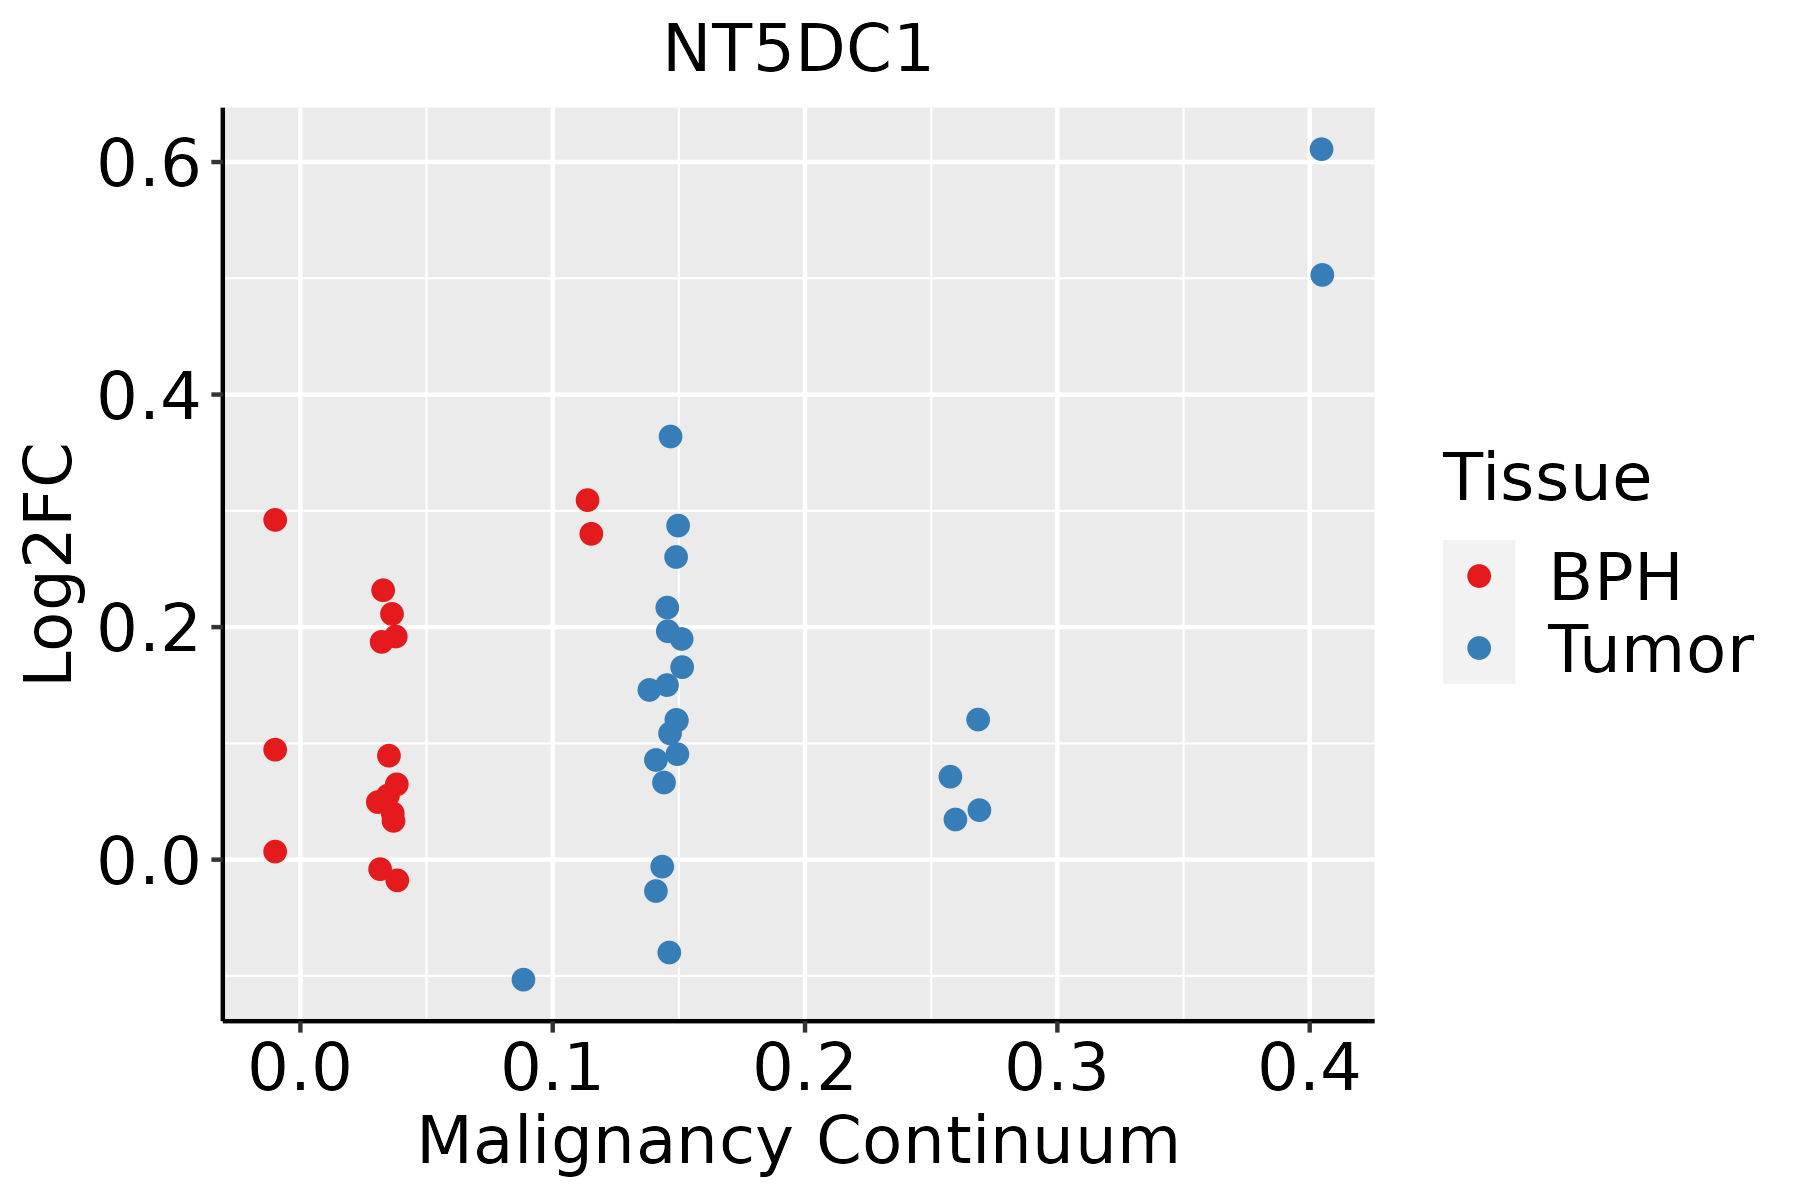 | BPH: Benign Prostatic Hyperplasia |
| Skin | 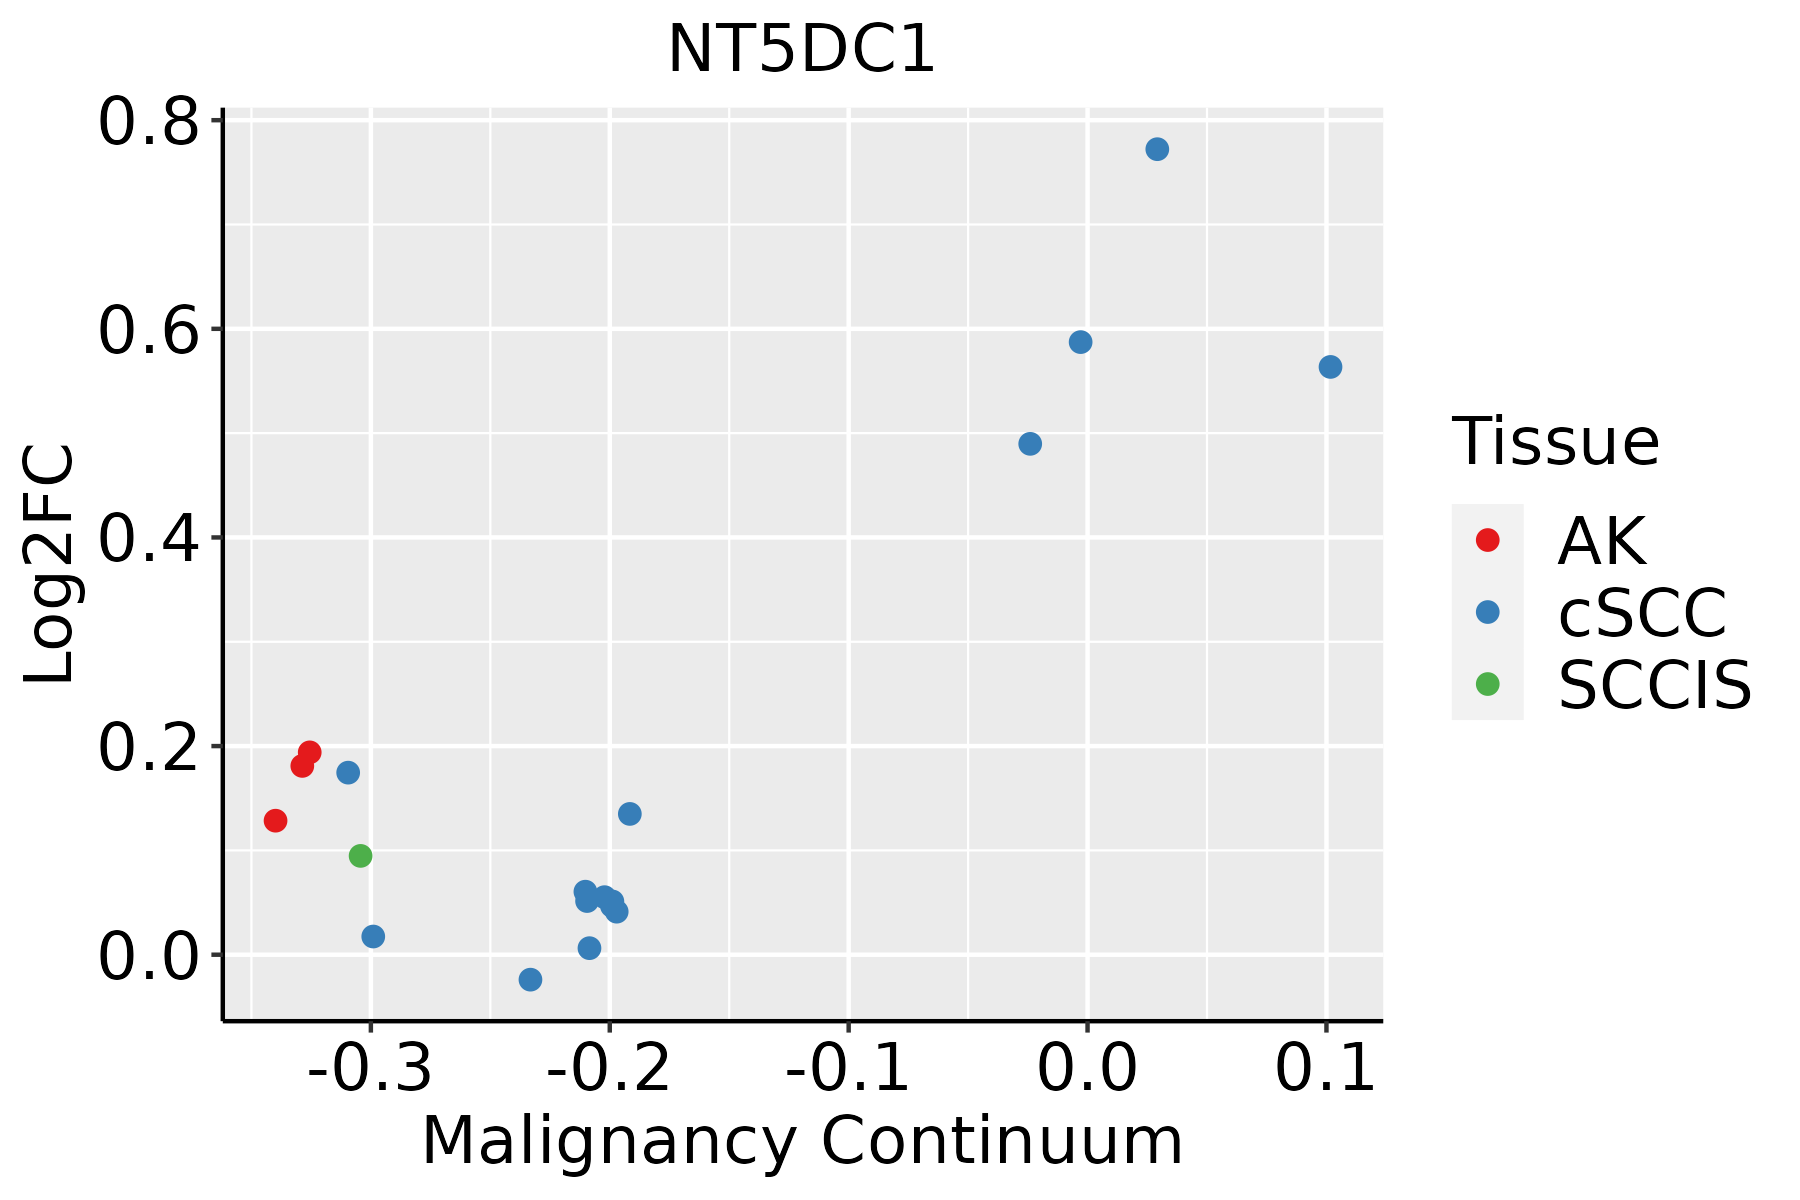 | AK: Actinic keratosis |
| cSCC: Cutaneous squamous cell carcinoma | ||
| SCCIS:squamous cell carcinoma in situ | ||
| Thyroid | 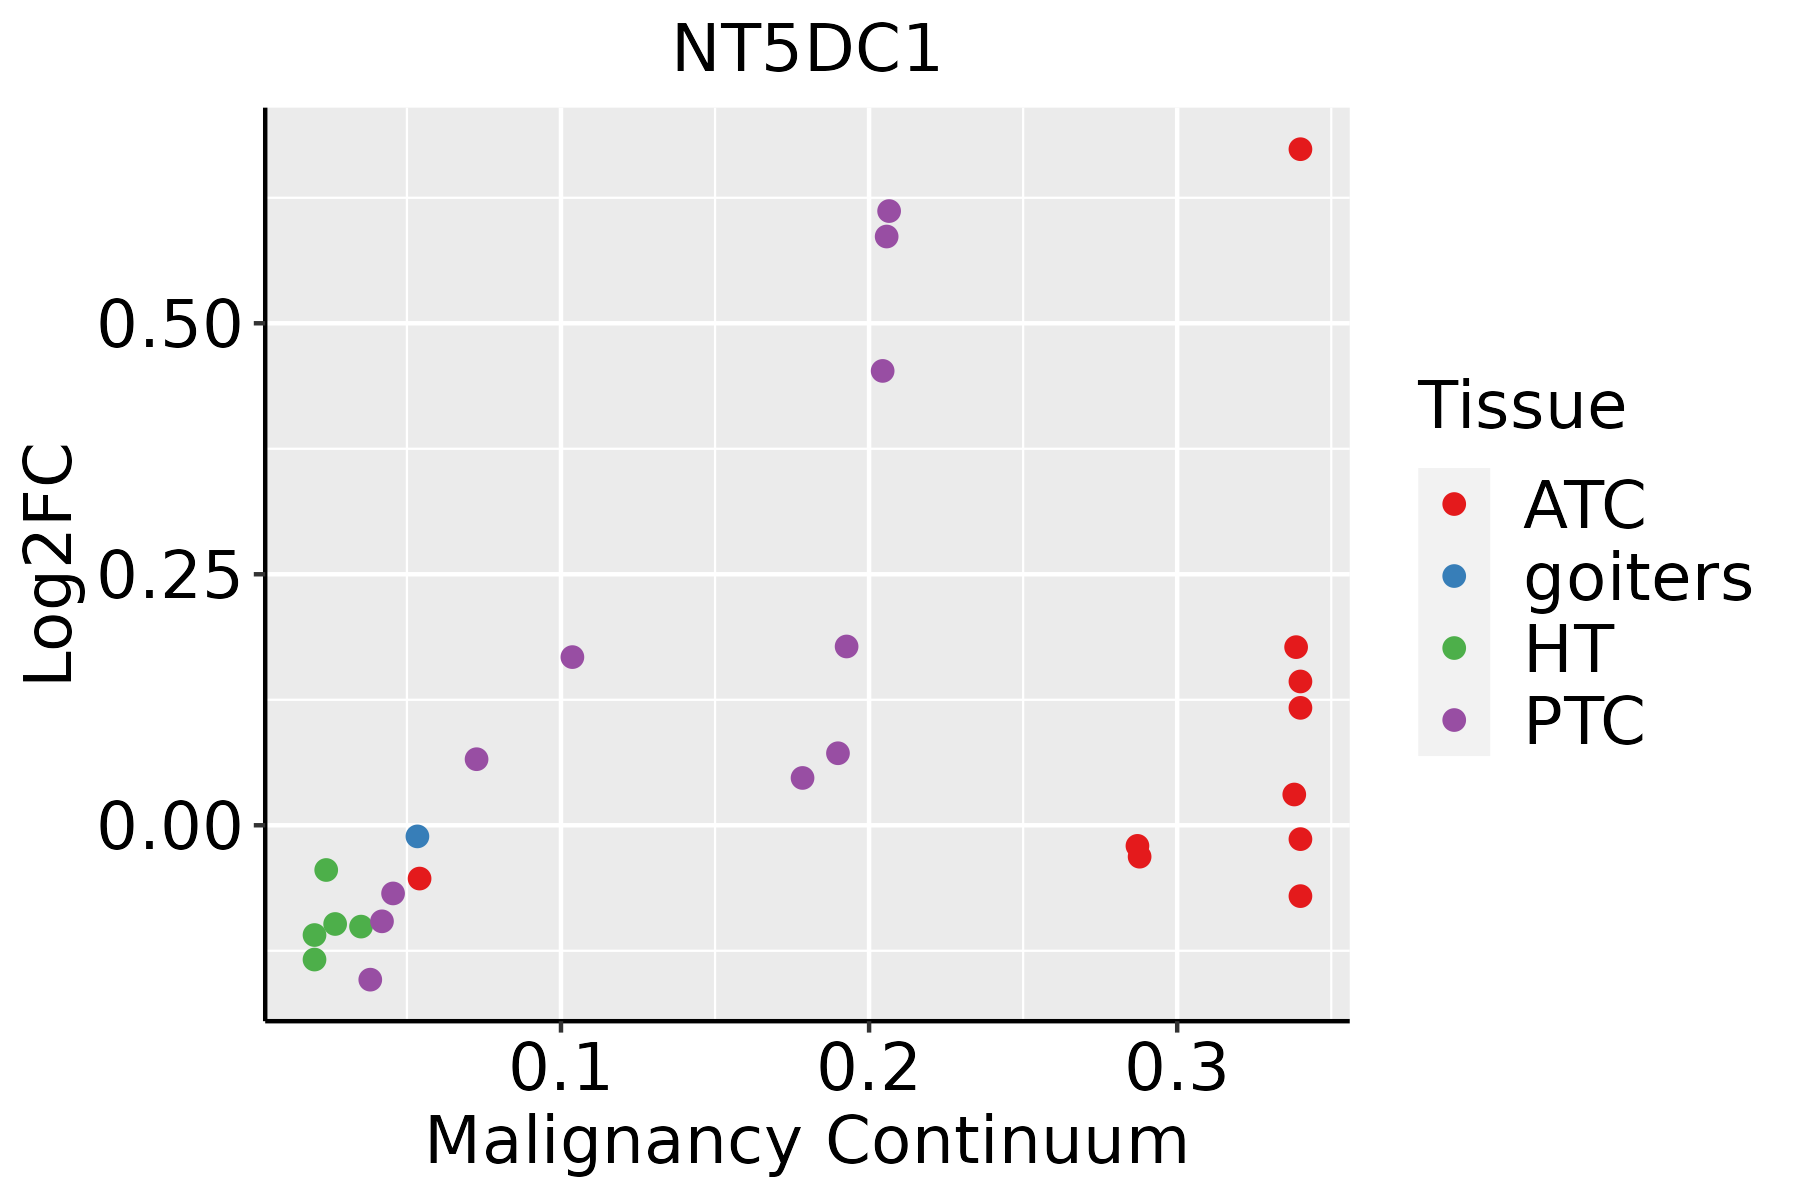 | ATC: Anaplastic thyroid cancer |
| HT: Hashimoto's thyroiditis | ||
| PTC: Papillary thyroid cancer |
| ∗log2FC in expression of this searched gene in stem-like cells from each diseased tissue sample relative to stem-like cells in normal samples in each tissue plotted against the malignancy continuum. Samples are colored based on if they are from different disease stage. |
Top |
Malignant transformation related pathway analysis |
| Find out the enriched GO biological processes and KEGG pathways involved in transition from healthy to precancer to cancer |
| Tissue | Disease Stage | Enriched GO biological Processes |
| Colorectum | AD |  |
| Colorectum | SER |  |
| Colorectum | MSS |  |
| Colorectum | MSI-H |  |
| Colorectum | FAP |  |
| ∗Top 15 enriched GO BP terms are showed in the bar plot of each disease state in each tissue. Each row represents a significant GO biological process which is colored according to the -log10(p.adjust). |
| Page: 1 2 3 4 5 6 7 8 9 |
| GO ID | Tissue | Disease Stage | Description | Gene Ratio | Bg Ratio | pvalue | p.adjust | Count |
| GO:001631110 | Esophagus | ESCC | dephosphorylation | 251/8552 | 417/18723 | 1.26e-09 | 2.99e-08 | 251 |
| GO:00163115 | Liver | NAFLD | dephosphorylation | 69/1882 | 417/18723 | 2.27e-05 | 6.23e-04 | 69 |
| GO:001631111 | Liver | Cirrhotic | dephosphorylation | 130/4634 | 417/18723 | 1.58e-03 | 1.03e-02 | 130 |
| GO:001631121 | Liver | HCC | dephosphorylation | 230/7958 | 417/18723 | 1.00e-07 | 1.96e-06 | 230 |
| GO:00163116 | Lung | IAC | dephosphorylation | 75/2061 | 417/18723 | 1.21e-05 | 3.64e-04 | 75 |
| GO:001631112 | Lung | AIS | dephosphorylation | 69/1849 | 417/18723 | 1.27e-05 | 4.78e-04 | 69 |
| GO:00163119 | Oral cavity | OSCC | dephosphorylation | 220/7305 | 417/18723 | 6.33e-09 | 1.34e-07 | 220 |
| GO:00163118 | Prostate | BPH | dephosphorylation | 98/3107 | 417/18723 | 1.53e-04 | 1.35e-03 | 98 |
| GO:001631113 | Prostate | Tumor | dephosphorylation | 98/3246 | 417/18723 | 7.31e-04 | 5.08e-03 | 98 |
| GO:001631115 | Skin | cSCC | dephosphorylation | 134/4864 | 417/18723 | 2.65e-03 | 1.50e-02 | 134 |
| GO:001631116 | Thyroid | PTC | dephosphorylation | 174/5968 | 417/18723 | 1.20e-05 | 1.31e-04 | 174 |
| GO:001631117 | Thyroid | ATC | dephosphorylation | 179/6293 | 417/18723 | 3.88e-05 | 3.15e-04 | 179 |
| Page: 1 |
| Pathway ID | Tissue | Disease Stage | Description | Gene Ratio | Bg Ratio | pvalue | p.adjust | qvalue | Count |
| Page: 1 |
Top |
Cell-cell communication analysis |
| Identification of potential cell-cell interactions between two cell types and their ligand-receptor pairs for different disease states |
| Ligand | Receptor | LRpair | Pathway | Tissue | Disease Stage |
| Page: 1 |
Top |
Single-cell gene regulatory network inference analysis |
| Find out the significant the regulons (TFs) and the target genes of each regulon across cell types for different disease states |
| TF | Cell Type | Tissue | Disease Stage | Target Gene | RSS | Regulon Activity |
| ∗The dot plots of a searched regulon are shown for all cell subpopulations in each disease state of each tissue based on the regulon specific score inferred using pySCENIC and by calculating the average expression. |
| Page: 1 |
Top |
Somatic mutation of malignant transformation related genes |
| Annotation of somatic variants for genes involved in malignant transformation |
| Hugo Symbol | Variant Class | Variant Classification | dbSNP RS | HGVSc | HGVSp | HGVSp Short | SWISSPROT | BIOTYPE | SIFT | PolyPhen | Tumor Sample Barcode | Tissue | Histology | Sex | Age | Stage | Therapy Types | Drugs | Outcome |
| NT5DC1 | SNV | Missense_Mutation | c.709N>A | p.Asp237Asn | p.D237N | Q5TFE4 | protein_coding | deleterious(0.03) | benign(0.314) | TCGA-BH-A0BA-01 | Breast | breast invasive carcinoma | Female | <65 | III/IV | Chemotherapy | cytoxan | SD | |
| NT5DC1 | insertion | In_Frame_Ins | novel | c.136_137insAGTTGTGCAAACACAGAACTGAGT | p.Gly46delinsGluLeuCysLysHisArgThrGluTrp | p.G46delinsELCKHRTEW | Q5TFE4 | protein_coding | TCGA-AO-A03T-01 | Breast | breast invasive carcinoma | Female | <65 | I/II | Chemotherapy | cyclophosphamide | SD | ||
| NT5DC1 | SNV | Missense_Mutation | novel | c.1161N>T | p.Glu387Asp | p.E387D | Q5TFE4 | protein_coding | tolerated(0.26) | benign(0.098) | TCGA-ZJ-AAXB-01 | Cervix | cervical & endocervical cancer | Female | <65 | I/II | Unknown | Unknown | SD |
| NT5DC1 | SNV | Missense_Mutation | c.517N>C | p.Ser173Pro | p.S173P | Q5TFE4 | protein_coding | deleterious(0.01) | possibly_damaging(0.828) | TCGA-AA-A010-01 | Colorectum | colon adenocarcinoma | Female | <65 | I/II | Chemotherapy | folinic | CR | |
| NT5DC1 | SNV | Missense_Mutation | novel | c.935N>A | p.Gly312Asp | p.G312D | Q5TFE4 | protein_coding | deleterious(0) | probably_damaging(1) | TCGA-2E-A9G8-01 | Endometrium | uterine corpus endometrioid carcinoma | Female | <65 | III/IV | Chemotherapy | taxol | CR |
| NT5DC1 | SNV | Missense_Mutation | rs371466347 | c.1286N>A | p.Ser429Tyr | p.S429Y | Q5TFE4 | protein_coding | deleterious(0) | possibly_damaging(0.89) | TCGA-A5-A1OF-01 | Endometrium | uterine corpus endometrioid carcinoma | Female | <65 | I/II | Unknown | Unknown | SD |
| NT5DC1 | SNV | Missense_Mutation | novel | c.1193C>A | p.Ser398Tyr | p.S398Y | Q5TFE4 | protein_coding | tolerated(0.86) | benign(0.439) | TCGA-AP-A1DV-01 | Endometrium | uterine corpus endometrioid carcinoma | Female | <65 | I/II | Unknown | Unknown | SD |
| NT5DC1 | SNV | Missense_Mutation | novel | c.169N>A | p.Glu57Lys | p.E57K | Q5TFE4 | protein_coding | tolerated(0.19) | possibly_damaging(0.553) | TCGA-AX-A06F-01 | Endometrium | uterine corpus endometrioid carcinoma | Female | <65 | III/IV | Chemotherapy | carboplatin | SD |
| NT5DC1 | SNV | Missense_Mutation | novel | c.752A>C | p.Lys251Thr | p.K251T | Q5TFE4 | protein_coding | deleterious(0) | probably_damaging(1) | TCGA-AX-A1C9-01 | Endometrium | uterine corpus endometrioid carcinoma | Female | >=65 | I/II | Unknown | Unknown | SD |
| NT5DC1 | SNV | Missense_Mutation | novel | c.1325C>A | p.Pro442His | p.P442H | Q5TFE4 | protein_coding | deleterious(0.03) | possibly_damaging(0.708) | TCGA-AX-A2HC-01 | Endometrium | uterine corpus endometrioid carcinoma | Female | <65 | III/IV | Chemotherapy | paclitaxel | PD |
| Page: 1 2 3 4 |
Top |
Related drugs of malignant transformation related genes |
| Identification of chemicals and drugs interact with genes involved in malignant transfromation |
| (DGIdb 4.0) |
| Entrez ID | Symbol | Category | Interaction Types | Drug Claim Name | Drug Name | PMIDs |
| Page: 1 |

Copyright 2023-Present -The University of Texas Health Science Center at Houston |