
|
|||||
|
 | |
| |
| |
| |
| |
| |
|
Gene: NRARP |
Gene summary for NRARP |
| Gene information | Species | Human | Gene symbol | NRARP | Gene ID | 441478 |
| Gene name | NOTCH regulated ankyrin repeat protein | |
| Gene Alias | NRARP | |
| Cytomap | 9q34.3 | |
| Gene Type | protein-coding | GO ID | GO:0000122 | UniProtAcc | Q7Z6K4 |
Top |
Malignant transformation analysis |
| Identification of the aberrant gene expression in precancerous and cancerous lesions by comparing the gene expression of stem-like cells in diseased tissues with normal stem cells |
| Entrez ID | Symbol | Replicates | Species | Organ | Tissue | Adj P-value | Log2FC | Malignancy |
| 441478 | NRARP | NEOLP-2 | Human | Oral cavity | NEOLP | 6.11e-03 | 2.08e-01 | -0.0196 |
| 441478 | NRARP | SYSMH1 | Human | Oral cavity | OSCC | 5.28e-17 | 8.59e-01 | 0.1127 |
| 441478 | NRARP | SYSMH2 | Human | Oral cavity | OSCC | 1.37e-24 | 8.39e-01 | 0.2326 |
| 441478 | NRARP | SYSMH3 | Human | Oral cavity | OSCC | 4.78e-11 | 7.24e-01 | 0.2442 |
| 441478 | NRARP | SYSMH4 | Human | Oral cavity | OSCC | 7.17e-24 | 8.61e-01 | 0.1226 |
| 441478 | NRARP | SYSMH6 | Human | Oral cavity | OSCC | 7.54e-09 | 4.63e-01 | 0.1275 |
| 441478 | NRARP | GSM5252132_BPH389PrGF | Human | Prostate | BPH | 1.54e-06 | 7.61e-01 | -0.2247 |
| 441478 | NRARP | GSM5252134_BPH511PrG_Fcol_3GEX | Human | Prostate | BPH | 1.64e-22 | 6.92e-01 | -0.1433 |
| 441478 | NRARP | GSM5252135_BPH511PrPUr_Fcol_3GEX | Human | Prostate | BPH | 1.45e-14 | 6.96e-01 | -0.1833 |
| 441478 | NRARP | GSM5252136_BPH556PrGA1_Fcol | Human | Prostate | BPH | 1.19e-36 | 1.03e+00 | -0.23 |
| 441478 | NRARP | GSM5252137_BPH556PrGA2_Fcol | Human | Prostate | BPH | 9.95e-30 | 1.13e+00 | -0.23 |
| 441478 | NRARP | 048752_1579-all-cells | Human | Prostate | BPH | 3.38e-06 | 2.21e-01 | 0.1008 |
| 441478 | NRARP | 052095_1628-all-cells | Human | Prostate | BPH | 4.64e-02 | 1.40e-01 | 0.1032 |
| 441478 | NRARP | Dong_P1 | Human | Prostate | Tumor | 7.62e-07 | 4.60e-02 | 0.035 |
| 441478 | NRARP | Dong_P5 | Human | Prostate | Tumor | 7.79e-07 | -2.36e-02 | 0.053 |
| 441478 | NRARP | GSM5353224_PA_PR5186_Pool_1_2_3_S27_L001 | Human | Prostate | Tumor | 1.92e-03 | 4.82e-01 | 0.1621 |
| 441478 | NRARP | GSM5353240_PA_PR5254_T1_S15_L001 | Human | Prostate | Tumor | 1.72e-04 | 4.49e-01 | 0.1575 |
| 441478 | NRARP | P1_S1_AK | Human | Skin | AK | 8.82e-15 | 5.15e-01 | -0.3399 |
| 441478 | NRARP | P2_S3_AK | Human | Skin | AK | 3.17e-13 | 4.80e-01 | -0.3287 |
| 441478 | NRARP | P2_S4_SCCIS | Human | Skin | SCCIS | 9.38e-05 | 2.75e-01 | -0.3043 |
| Page: 1 2 3 4 5 |
| Tissue | Expression Dynamics | Abbreviation |
| Cervix |  | CC: Cervix cancer |
| HSIL_HPV: HPV-infected high-grade squamous intraepithelial lesions | ||
| N_HPV: HPV-infected normal cervix | ||
| Esophagus |  | ESCC: Esophageal squamous cell carcinoma |
| HGIN: High-grade intraepithelial neoplasias | ||
| LGIN: Low-grade intraepithelial neoplasias | ||
| Oral Cavity |  | EOLP: Erosive Oral lichen planus |
| LP: leukoplakia | ||
| NEOLP: Non-erosive oral lichen planus | ||
| OSCC: Oral squamous cell carcinoma | ||
| Prostate |  | BPH: Benign Prostatic Hyperplasia |
| Skin | 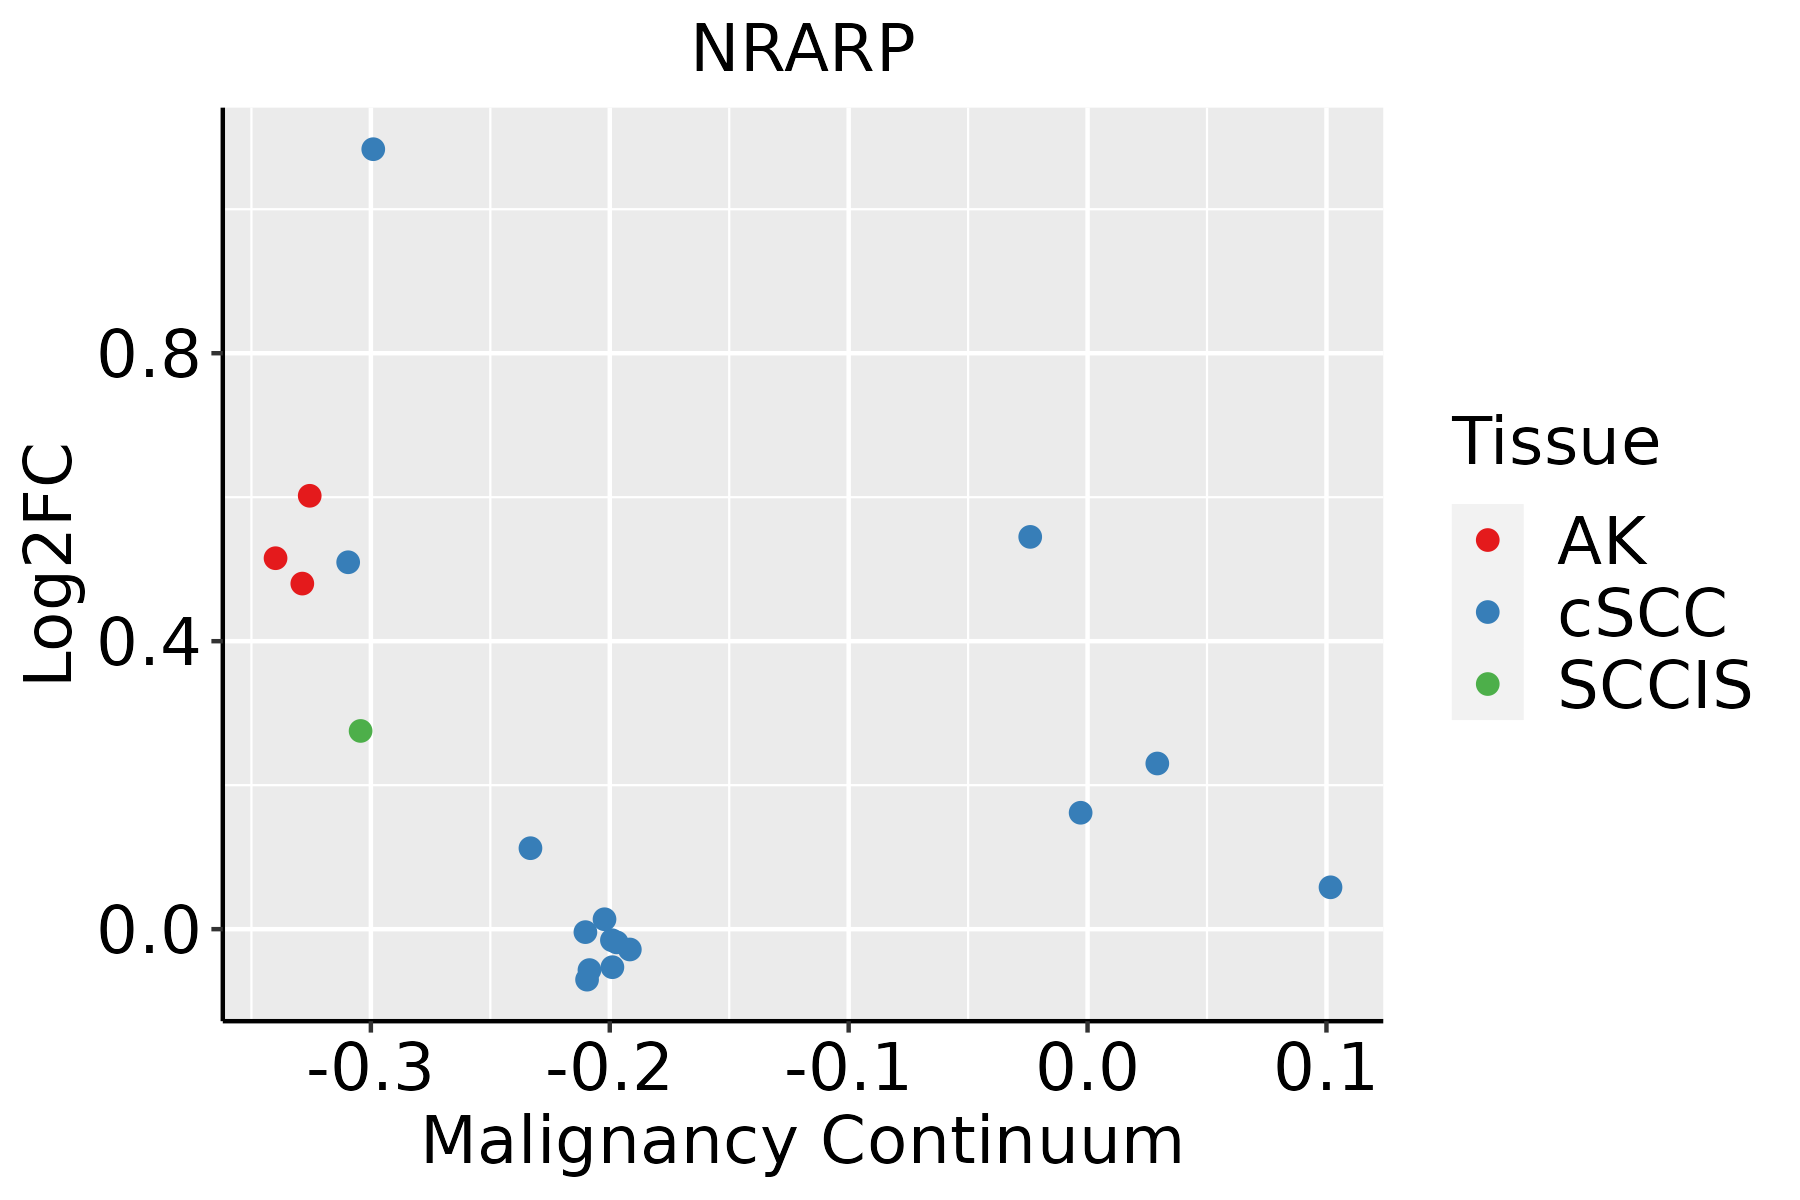 | AK: Actinic keratosis |
| cSCC: Cutaneous squamous cell carcinoma | ||
| SCCIS:squamous cell carcinoma in situ |
| ∗log2FC in expression of this searched gene in stem-like cells from each diseased tissue sample relative to stem-like cells in normal samples in each tissue plotted against the malignancy continuum. Samples are colored based on if they are from different disease stage. |
Top |
Malignant transformation related pathway analysis |
| Find out the enriched GO biological processes and KEGG pathways involved in transition from healthy to precancer to cancer |
| Tissue | Disease Stage | Enriched GO biological Processes |
| Colorectum | AD |  |
| Colorectum | SER |  |
| Colorectum | MSS |  |
| Colorectum | MSI-H |  |
| Colorectum | FAP |  |
| ∗Top 15 enriched GO BP terms are showed in the bar plot of each disease state in each tissue. Each row represents a significant GO biological process which is colored according to the -log10(p.adjust). |
| Page: 1 2 3 4 5 6 7 8 9 |
| GO ID | Tissue | Disease Stage | Description | Gene Ratio | Bg Ratio | pvalue | p.adjust | Count |
| GO:002240710 | Cervix | CC | regulation of cell-cell adhesion | 103/2311 | 448/18723 | 1.78e-10 | 2.87e-08 | 103 |
| GO:00421108 | Cervix | CC | T cell activation | 107/2311 | 487/18723 | 1.24e-09 | 1.46e-07 | 107 |
| GO:00508638 | Cervix | CC | regulation of T cell activation | 80/2311 | 329/18723 | 1.28e-09 | 1.47e-07 | 80 |
| GO:00506737 | Cervix | CC | epithelial cell proliferation | 98/2311 | 437/18723 | 2.01e-09 | 2.15e-07 | 98 |
| GO:00160557 | Cervix | CC | Wnt signaling pathway | 98/2311 | 444/18723 | 4.82e-09 | 4.65e-07 | 98 |
| GO:01987387 | Cervix | CC | cell-cell signaling by wnt | 98/2311 | 446/18723 | 6.16e-09 | 5.58e-07 | 98 |
| GO:00071598 | Cervix | CC | leukocyte cell-cell adhesion | 85/2311 | 371/18723 | 8.27e-09 | 7.07e-07 | 85 |
| GO:00071626 | Cervix | CC | negative regulation of cell adhesion | 72/2311 | 303/18723 | 2.36e-08 | 1.70e-06 | 72 |
| GO:00026837 | Cervix | CC | negative regulation of immune system process | 94/2311 | 434/18723 | 2.63e-08 | 1.87e-06 | 94 |
| GO:00301117 | Cervix | CC | regulation of Wnt signaling pathway | 76/2311 | 328/18723 | 3.05e-08 | 2.08e-06 | 76 |
| GO:19030378 | Cervix | CC | regulation of leukocyte cell-cell adhesion | 77/2311 | 336/18723 | 4.08e-08 | 2.54e-06 | 77 |
| GO:00506787 | Cervix | CC | regulation of epithelial cell proliferation | 83/2311 | 381/18723 | 1.31e-07 | 6.42e-06 | 83 |
| GO:190370610 | Cervix | CC | regulation of hemopoiesis | 80/2311 | 367/18723 | 2.14e-07 | 9.55e-06 | 80 |
| GO:00608287 | Cervix | CC | regulation of canonical Wnt signaling pathway | 58/2311 | 253/18723 | 1.83e-06 | 5.89e-05 | 58 |
| GO:00224084 | Cervix | CC | negative regulation of cell-cell adhesion | 48/2311 | 196/18723 | 1.99e-06 | 6.18e-05 | 48 |
| GO:00600707 | Cervix | CC | canonical Wnt signaling pathway | 66/2311 | 303/18723 | 2.47e-06 | 7.35e-05 | 66 |
| GO:19021056 | Cervix | CC | regulation of leukocyte differentiation | 61/2311 | 279/18723 | 5.16e-06 | 1.29e-04 | 61 |
| GO:19021064 | Cervix | CC | negative regulation of leukocyte differentiation | 29/2311 | 102/18723 | 1.02e-05 | 2.29e-04 | 29 |
| GO:0051250 | Cervix | CC | negative regulation of lymphocyte activation | 39/2311 | 157/18723 | 1.23e-05 | 2.57e-04 | 39 |
| GO:00506794 | Cervix | CC | positive regulation of epithelial cell proliferation | 47/2311 | 207/18723 | 2.18e-05 | 3.90e-04 | 47 |
| Page: 1 2 3 4 5 6 7 8 9 10 11 12 13 14 15 |
| Pathway ID | Tissue | Disease Stage | Description | Gene Ratio | Bg Ratio | pvalue | p.adjust | qvalue | Count |
| hsa04330 | Cervix | CC | Notch signaling pathway | 17/1267 | 62/8465 | 7.99e-03 | 2.56e-02 | 1.51e-02 | 17 |
| hsa043301 | Cervix | CC | Notch signaling pathway | 17/1267 | 62/8465 | 7.99e-03 | 2.56e-02 | 1.51e-02 | 17 |
| hsa043306 | Esophagus | ESCC | Notch signaling pathway | 42/4205 | 62/8465 | 2.97e-03 | 7.97e-03 | 4.08e-03 | 42 |
| hsa0433013 | Esophagus | ESCC | Notch signaling pathway | 42/4205 | 62/8465 | 2.97e-03 | 7.97e-03 | 4.08e-03 | 42 |
| hsa0433021 | Oral cavity | NEOLP | Notch signaling pathway | 21/1112 | 62/8465 | 2.23e-05 | 1.87e-04 | 1.18e-04 | 21 |
| hsa0433031 | Oral cavity | NEOLP | Notch signaling pathway | 21/1112 | 62/8465 | 2.23e-05 | 1.87e-04 | 1.18e-04 | 21 |
| hsa043304 | Prostate | BPH | Notch signaling pathway | 21/1718 | 62/8465 | 8.53e-03 | 2.68e-02 | 1.66e-02 | 21 |
| hsa0433011 | Prostate | BPH | Notch signaling pathway | 21/1718 | 62/8465 | 8.53e-03 | 2.68e-02 | 1.66e-02 | 21 |
| hsa043302 | Prostate | Tumor | Notch signaling pathway | 22/1791 | 62/8465 | 6.45e-03 | 2.16e-02 | 1.34e-02 | 22 |
| hsa043303 | Prostate | Tumor | Notch signaling pathway | 22/1791 | 62/8465 | 6.45e-03 | 2.16e-02 | 1.34e-02 | 22 |
| Page: 1 |
Top |
Cell-cell communication analysis |
| Identification of potential cell-cell interactions between two cell types and their ligand-receptor pairs for different disease states |
| Ligand | Receptor | LRpair | Pathway | Tissue | Disease Stage |
| Page: 1 |
Top |
Single-cell gene regulatory network inference analysis |
| Find out the significant the regulons (TFs) and the target genes of each regulon across cell types for different disease states |
| TF | Cell Type | Tissue | Disease Stage | Target Gene | RSS | Regulon Activity |
| ∗The dot plots of a searched regulon are shown for all cell subpopulations in each disease state of each tissue based on the regulon specific score inferred using pySCENIC and by calculating the average expression. |
| Page: 1 |
Top |
Somatic mutation of malignant transformation related genes |
| Annotation of somatic variants for genes involved in malignant transformation |
| Hugo Symbol | Variant Class | Variant Classification | dbSNP RS | HGVSc | HGVSp | HGVSp Short | SWISSPROT | BIOTYPE | SIFT | PolyPhen | Tumor Sample Barcode | Tissue | Histology | Sex | Age | Stage | Therapy Types | Drugs | Outcome |
| NRARP | SNV | Missense_Mutation | novel | c.130N>A | p.Val44Met | p.V44M | Q7Z6K4 | protein_coding | deleterious(0.01) | probably_damaging(0.984) | TCGA-5L-AAT1-01 | Breast | breast invasive carcinoma | Female | <65 | III/IV | Hormone Therapy | letrozol | SD |
| NRARP | insertion | Frame_Shift_Ins | novel | c.10dupG | p.Ala4GlyfsTer209 | p.A4Gfs*209 | Q7Z6K4 | protein_coding | TCGA-AC-A8OR-01 | Breast | breast invasive carcinoma | Female | >=65 | I/II | Unknown | Unknown | SD | ||
| NRARP | SNV | Missense_Mutation | c.155N>C | p.Gln52Pro | p.Q52P | Q7Z6K4 | protein_coding | deleterious(0.03) | benign(0.021) | TCGA-WL-A834-01 | Cervix | cervical & endocervical cancer | Female | <65 | I/II | Chemotherapy | paclitaxel | SD | |
| NRARP | SNV | Missense_Mutation | c.305N>G | p.Tyr102Cys | p.Y102C | Q7Z6K4 | protein_coding | deleterious(0) | probably_damaging(0.994) | TCGA-A6-3809-01 | Colorectum | colon adenocarcinoma | Female | >=65 | I/II | Unknown | Unknown | SD | |
| NRARP | SNV | Missense_Mutation | novel | c.233G>T | p.Arg78Leu | p.R78L | Q7Z6K4 | protein_coding | deleterious(0.03) | benign(0.19) | TCGA-CA-6717-01 | Colorectum | colon adenocarcinoma | Male | <65 | I/II | Chemotherapy | oxaliplatin | CR |
| NRARP | SNV | Missense_Mutation | c.92N>G | p.Gln31Arg | p.Q31R | Q7Z6K4 | protein_coding | tolerated(0.54) | benign(0.02) | TCGA-DM-A1HB-01 | Colorectum | colon adenocarcinoma | Male | >=65 | III/IV | Unknown | Unknown | SD | |
| NRARP | SNV | Missense_Mutation | novel | c.307N>A | p.Leu103Ile | p.L103I | Q7Z6K4 | protein_coding | deleterious(0) | probably_damaging(0.987) | TCGA-AX-A2HC-01 | Endometrium | uterine corpus endometrioid carcinoma | Female | <65 | III/IV | Chemotherapy | paclitaxel | PD |
| NRARP | SNV | Missense_Mutation | novel | c.326N>G | p.Tyr109Cys | p.Y109C | Q7Z6K4 | protein_coding | tolerated(0.05) | probably_damaging(0.97) | TCGA-FI-A2D0-01 | Endometrium | uterine corpus endometrioid carcinoma | Female | <65 | I/II | Unknown | Unknown | SD |
| NRARP | SNV | Missense_Mutation | novel | c.170A>G | p.Gln57Arg | p.Q57R | Q7Z6K4 | protein_coding | tolerated(0.05) | possibly_damaging(0.757) | TCGA-2Y-A9GV-01 | Liver | liver hepatocellular carcinoma | Female | <65 | I/II | Targeted Molecular therapy | sorafenib | PD |
| NRARP | SNV | Missense_Mutation | c.247G>A | p.Asp83Asn | p.D83N | Q7Z6K4 | protein_coding | tolerated(0.11) | benign(0.062) | TCGA-22-5491-01 | Lung | lung squamous cell carcinoma | Male | >=65 | I/II | Unknown | Unknown | SD |
| Page: 1 |
Top |
Related drugs of malignant transformation related genes |
| Identification of chemicals and drugs interact with genes involved in malignant transfromation |
| (DGIdb 4.0) |
| Entrez ID | Symbol | Category | Interaction Types | Drug Claim Name | Drug Name | PMIDs |
| Page: 1 |

Copyright 2023-Present -The University of Texas Health Science Center at Houston |