
|
|||||
|
 | |
| |
| |
| |
| |
| |
|
Gene: NOP58 |
Gene summary for NOP58 |
| Gene information | Species | Human | Gene symbol | NOP58 | Gene ID | 51602 |
| Gene name | NOP58 ribonucleoprotein | |
| Gene Alias | HSPC120 | |
| Cytomap | 2q33.1 | |
| Gene Type | protein-coding | GO ID | GO:0006139 | UniProtAcc | Q9Y2X3 |
Top |
Malignant transformation analysis |
| Identification of the aberrant gene expression in precancerous and cancerous lesions by comparing the gene expression of stem-like cells in diseased tissues with normal stem cells |
| Entrez ID | Symbol | Replicates | Species | Organ | Tissue | Adj P-value | Log2FC | Malignancy |
| 51602 | NOP58 | P126T-E | Human | Esophagus | ESCC | 8.74e-10 | 2.06e+00 | 0.1125 |
| 51602 | NOP58 | P127T-E | Human | Esophagus | ESCC | 7.41e-15 | 4.07e-01 | 0.0826 |
| 51602 | NOP58 | P128T-E | Human | Esophagus | ESCC | 1.55e-26 | 1.46e+00 | 0.1241 |
| 51602 | NOP58 | P130T-E | Human | Esophagus | ESCC | 1.18e-57 | 1.82e+00 | 0.1676 |
| 51602 | NOP58 | NAFLD1 | Human | Liver | NAFLD | 3.49e-05 | 5.29e-01 | -0.04 |
| 51602 | NOP58 | S43 | Human | Liver | Cirrhotic | 4.92e-03 | -1.64e-01 | -0.0187 |
| 51602 | NOP58 | HCC1_Meng | Human | Liver | HCC | 1.19e-76 | 2.28e-01 | 0.0246 |
| 51602 | NOP58 | HCC2_Meng | Human | Liver | HCC | 5.43e-29 | 1.64e-03 | 0.0107 |
| 51602 | NOP58 | cirrhotic2 | Human | Liver | Cirrhotic | 1.04e-03 | 2.63e-02 | 0.0201 |
| 51602 | NOP58 | HCC1 | Human | Liver | HCC | 1.29e-10 | 4.78e+00 | 0.5336 |
| 51602 | NOP58 | HCC2 | Human | Liver | HCC | 1.50e-18 | 5.10e+00 | 0.5341 |
| 51602 | NOP58 | Pt13.b | Human | Liver | HCC | 1.55e-11 | 1.09e-01 | 0.0251 |
| 51602 | NOP58 | Pt14.a | Human | Liver | HCC | 8.50e-03 | 2.18e-01 | 0.0169 |
| 51602 | NOP58 | S014 | Human | Liver | HCC | 1.19e-33 | 1.36e+00 | 0.2254 |
| 51602 | NOP58 | S015 | Human | Liver | HCC | 1.14e-33 | 1.61e+00 | 0.2375 |
| 51602 | NOP58 | S016 | Human | Liver | HCC | 2.77e-34 | 1.47e+00 | 0.2243 |
| 51602 | NOP58 | S027 | Human | Liver | HCC | 9.77e-13 | 1.37e+00 | 0.2446 |
| 51602 | NOP58 | S028 | Human | Liver | HCC | 1.33e-25 | 1.56e+00 | 0.2503 |
| 51602 | NOP58 | S029 | Human | Liver | HCC | 1.15e-23 | 1.60e+00 | 0.2581 |
| 51602 | NOP58 | C04 | Human | Oral cavity | OSCC | 1.41e-25 | 1.56e+00 | 0.2633 |
| Page: 1 2 3 4 5 6 7 |
| Tissue | Expression Dynamics | Abbreviation |
| Esophagus | 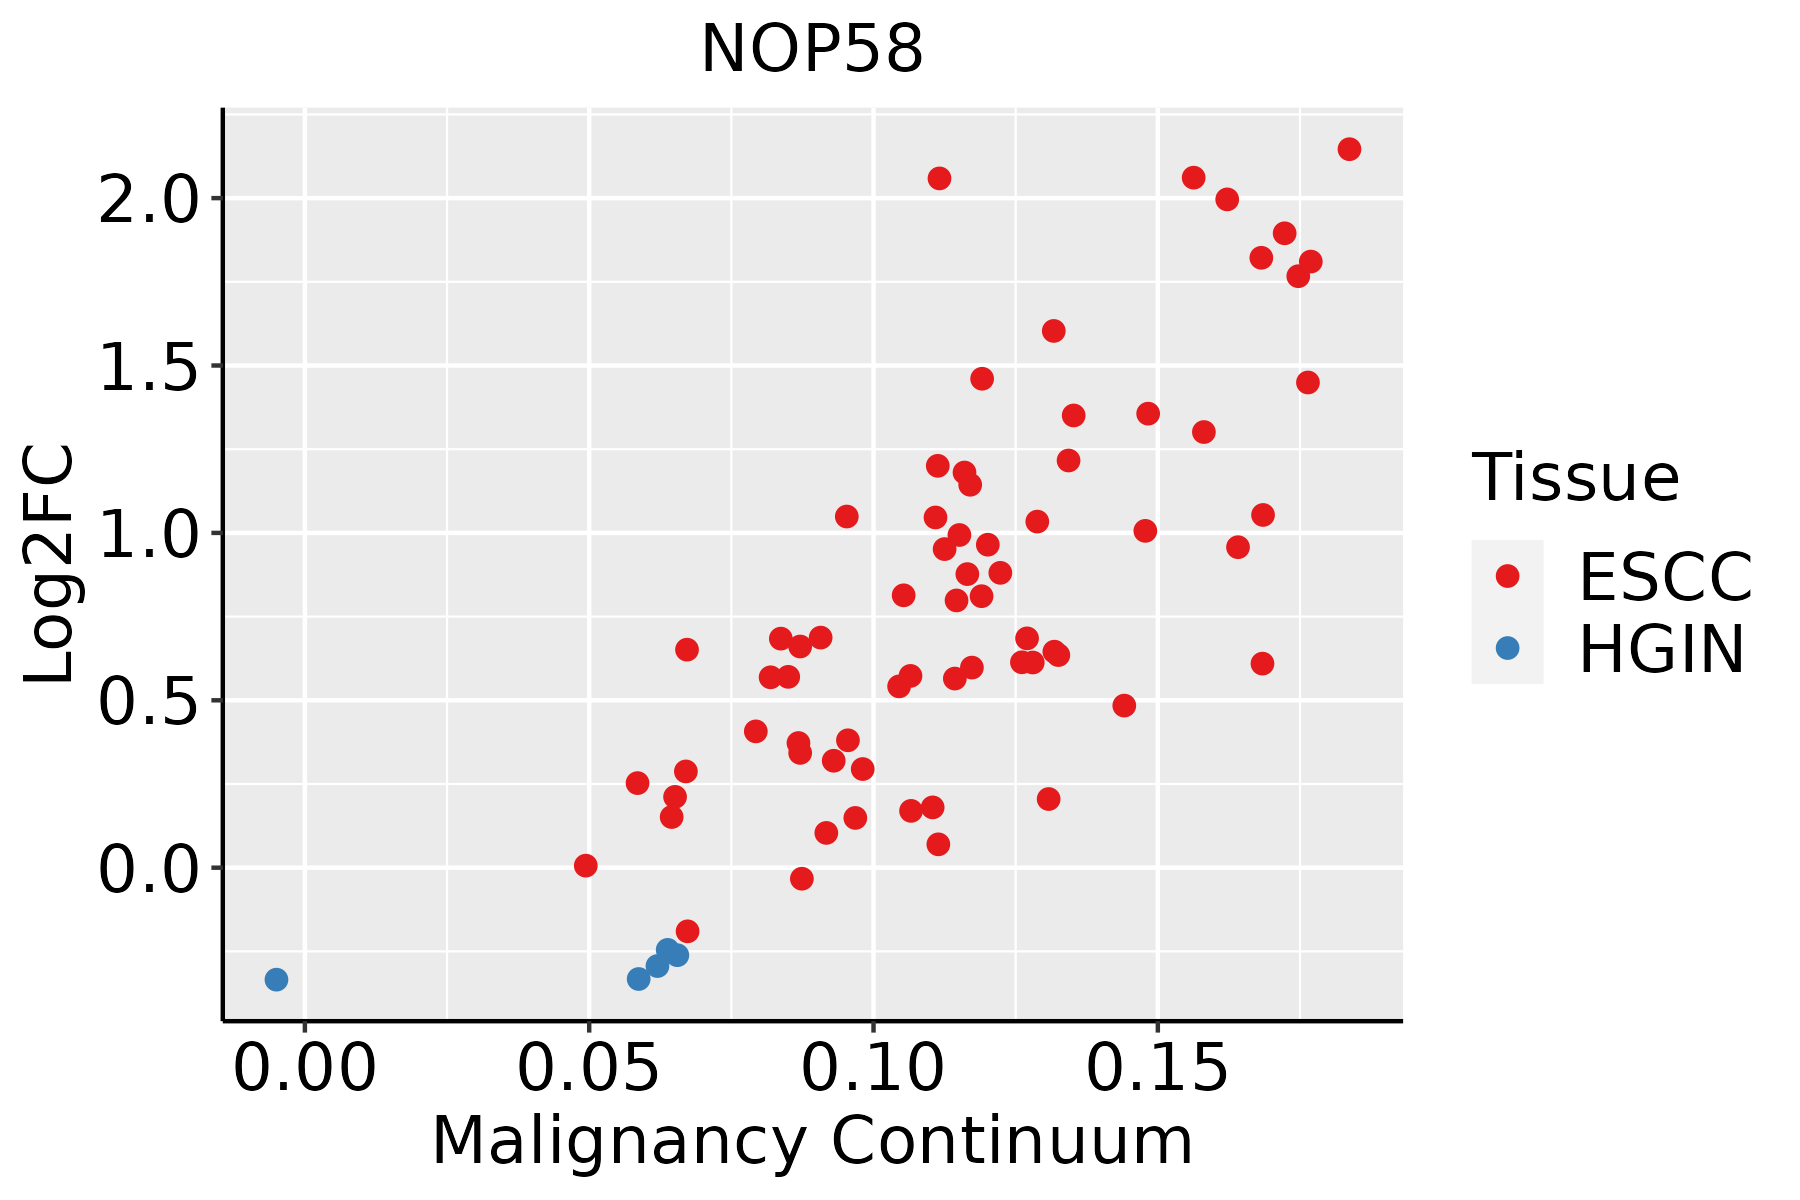 | ESCC: Esophageal squamous cell carcinoma |
| HGIN: High-grade intraepithelial neoplasias | ||
| LGIN: Low-grade intraepithelial neoplasias | ||
| Liver | 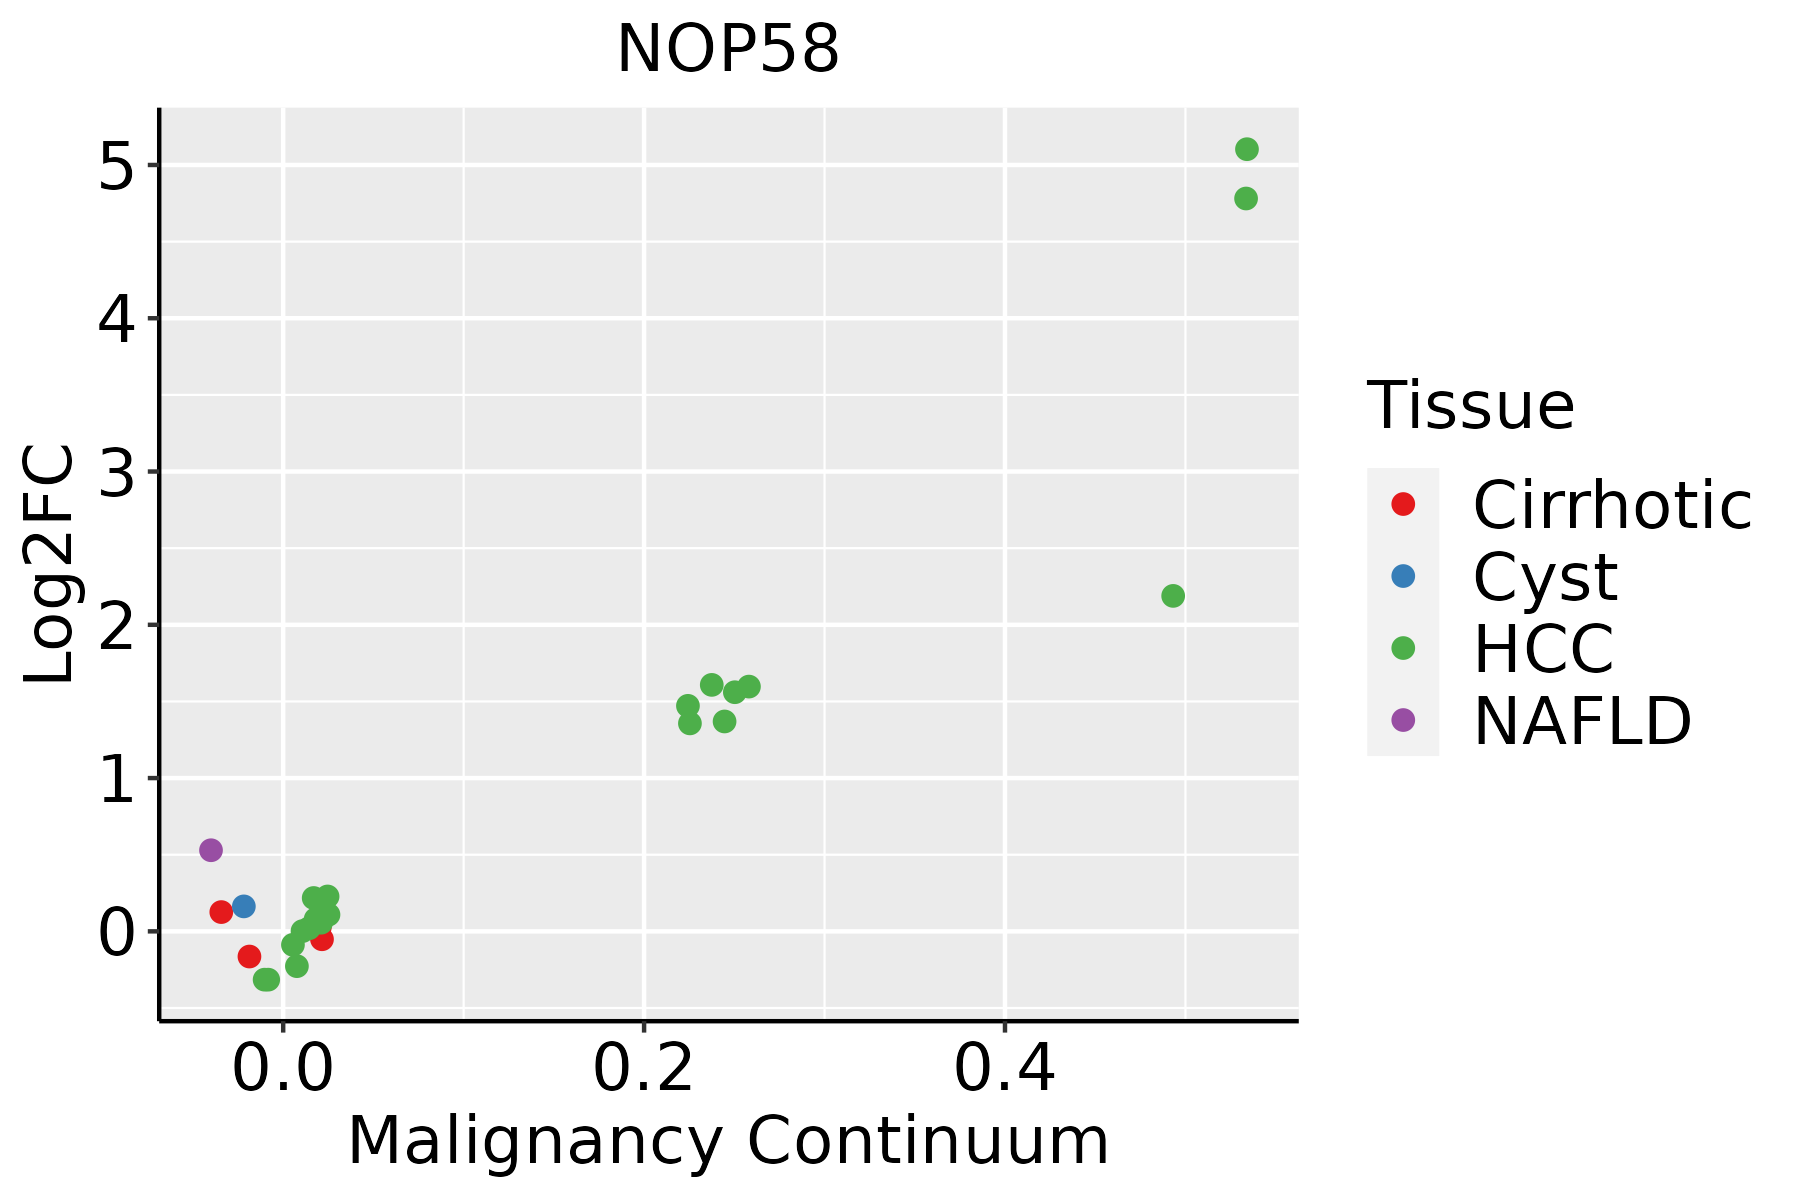 | HCC: Hepatocellular carcinoma |
| NAFLD: Non-alcoholic fatty liver disease | ||
| Oral Cavity | 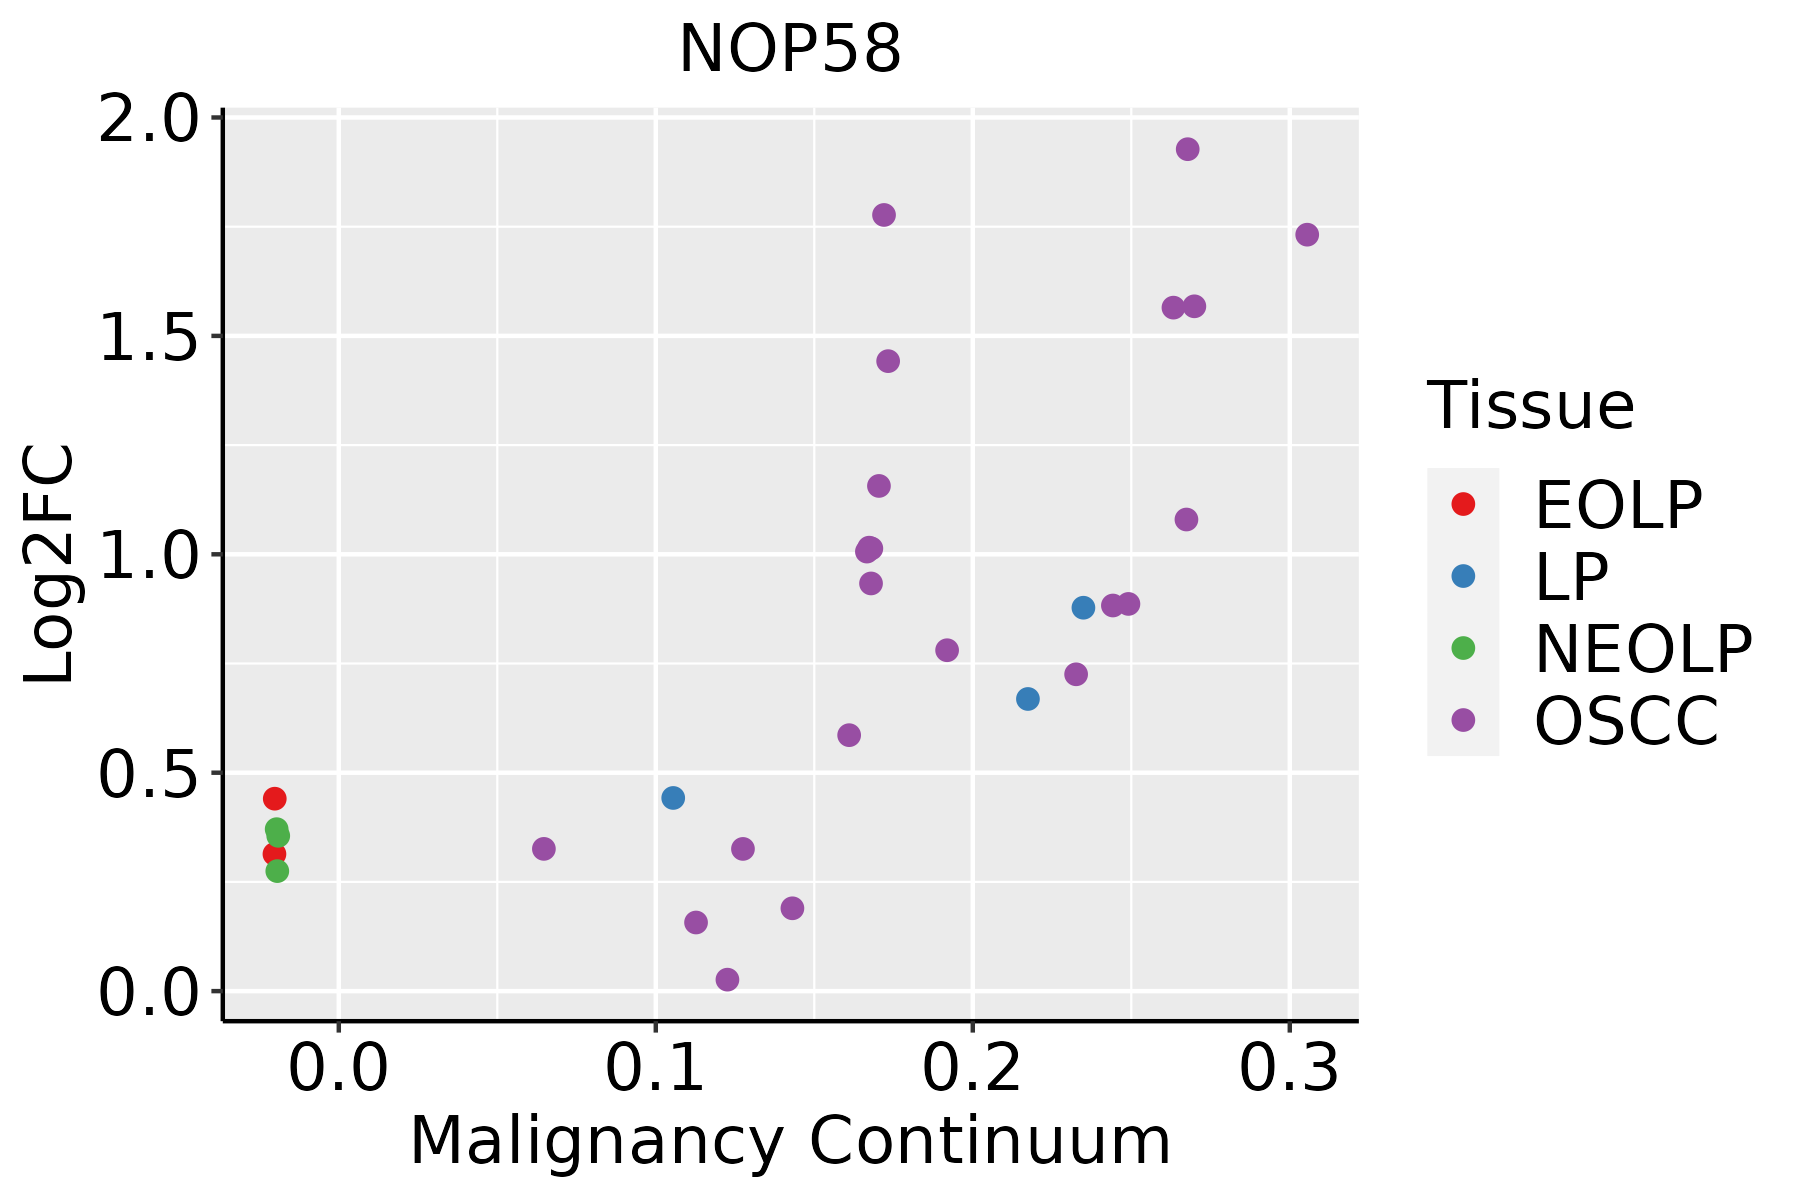 | EOLP: Erosive Oral lichen planus |
| LP: leukoplakia | ||
| NEOLP: Non-erosive oral lichen planus | ||
| OSCC: Oral squamous cell carcinoma | ||
| Prostate | 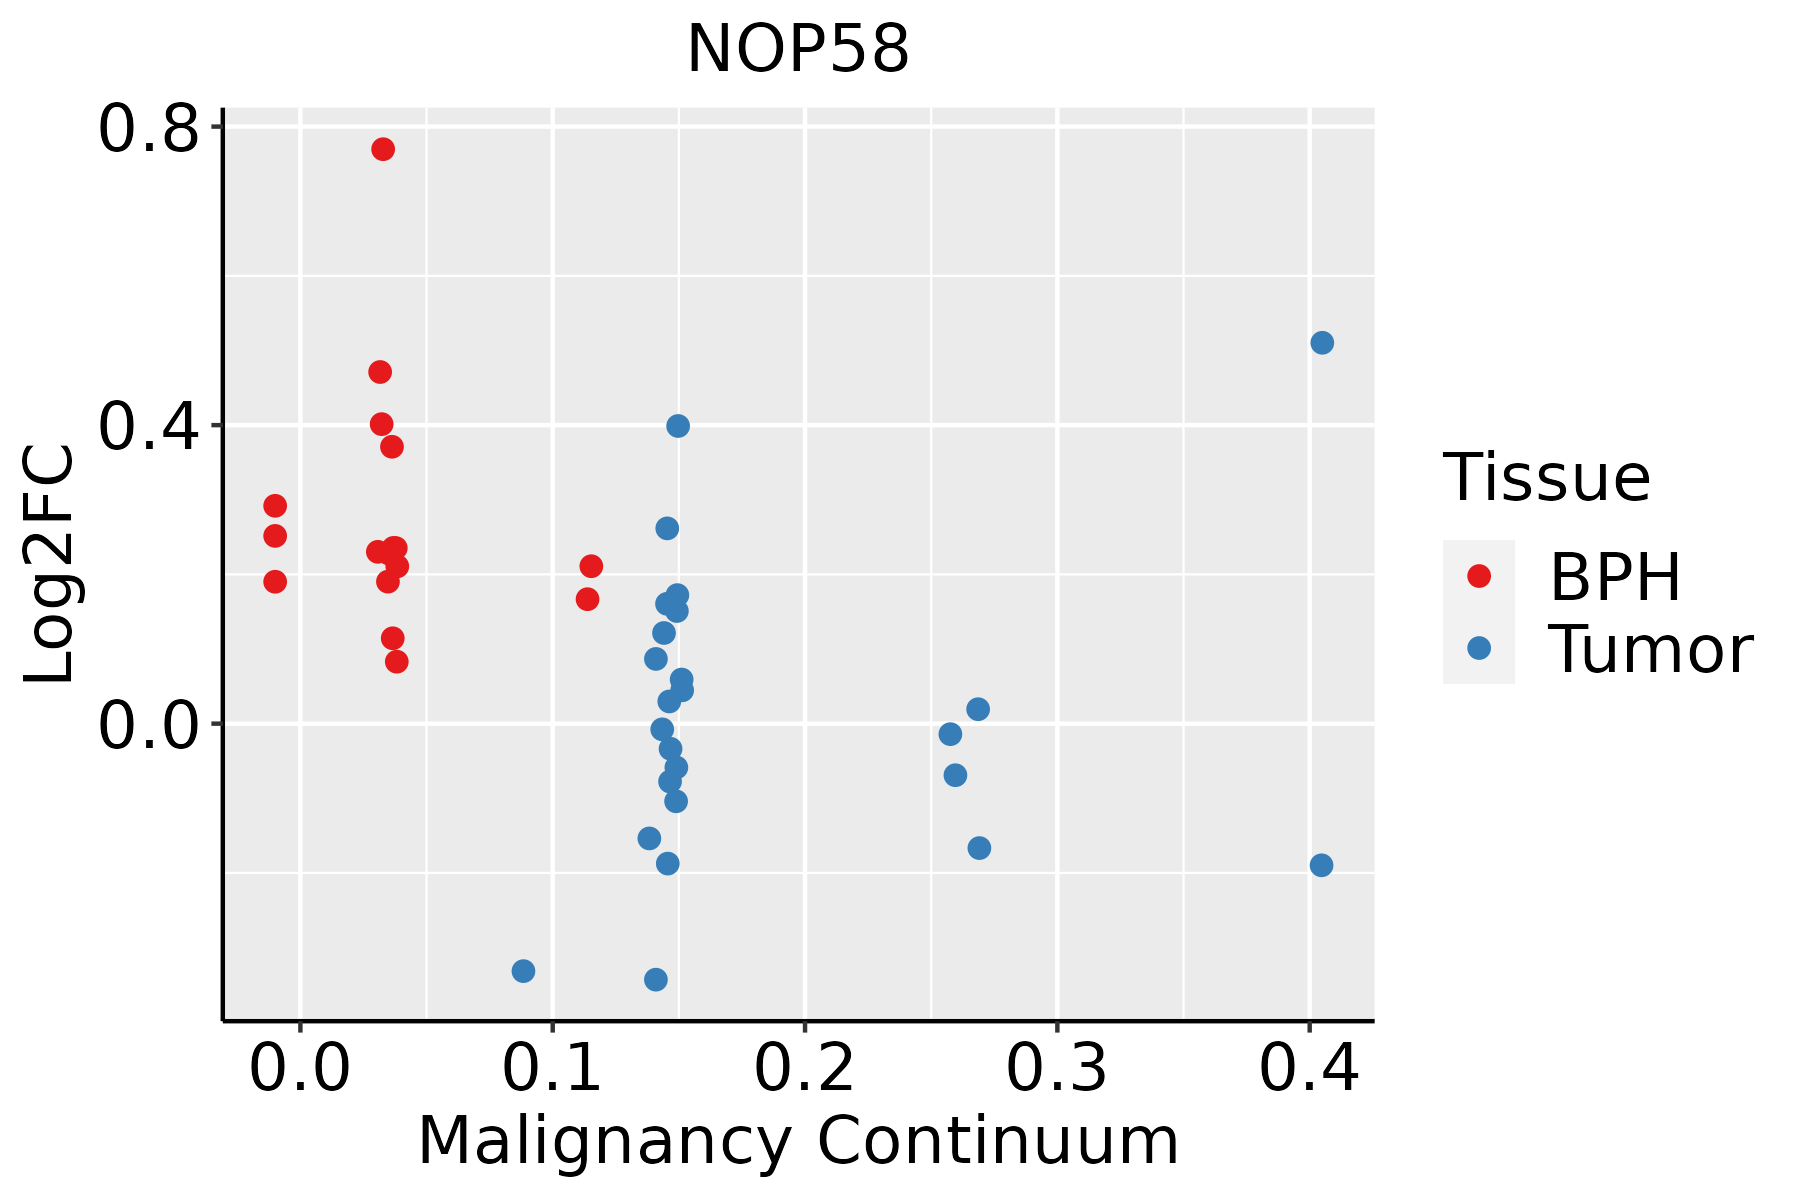 | BPH: Benign Prostatic Hyperplasia |
| Skin | 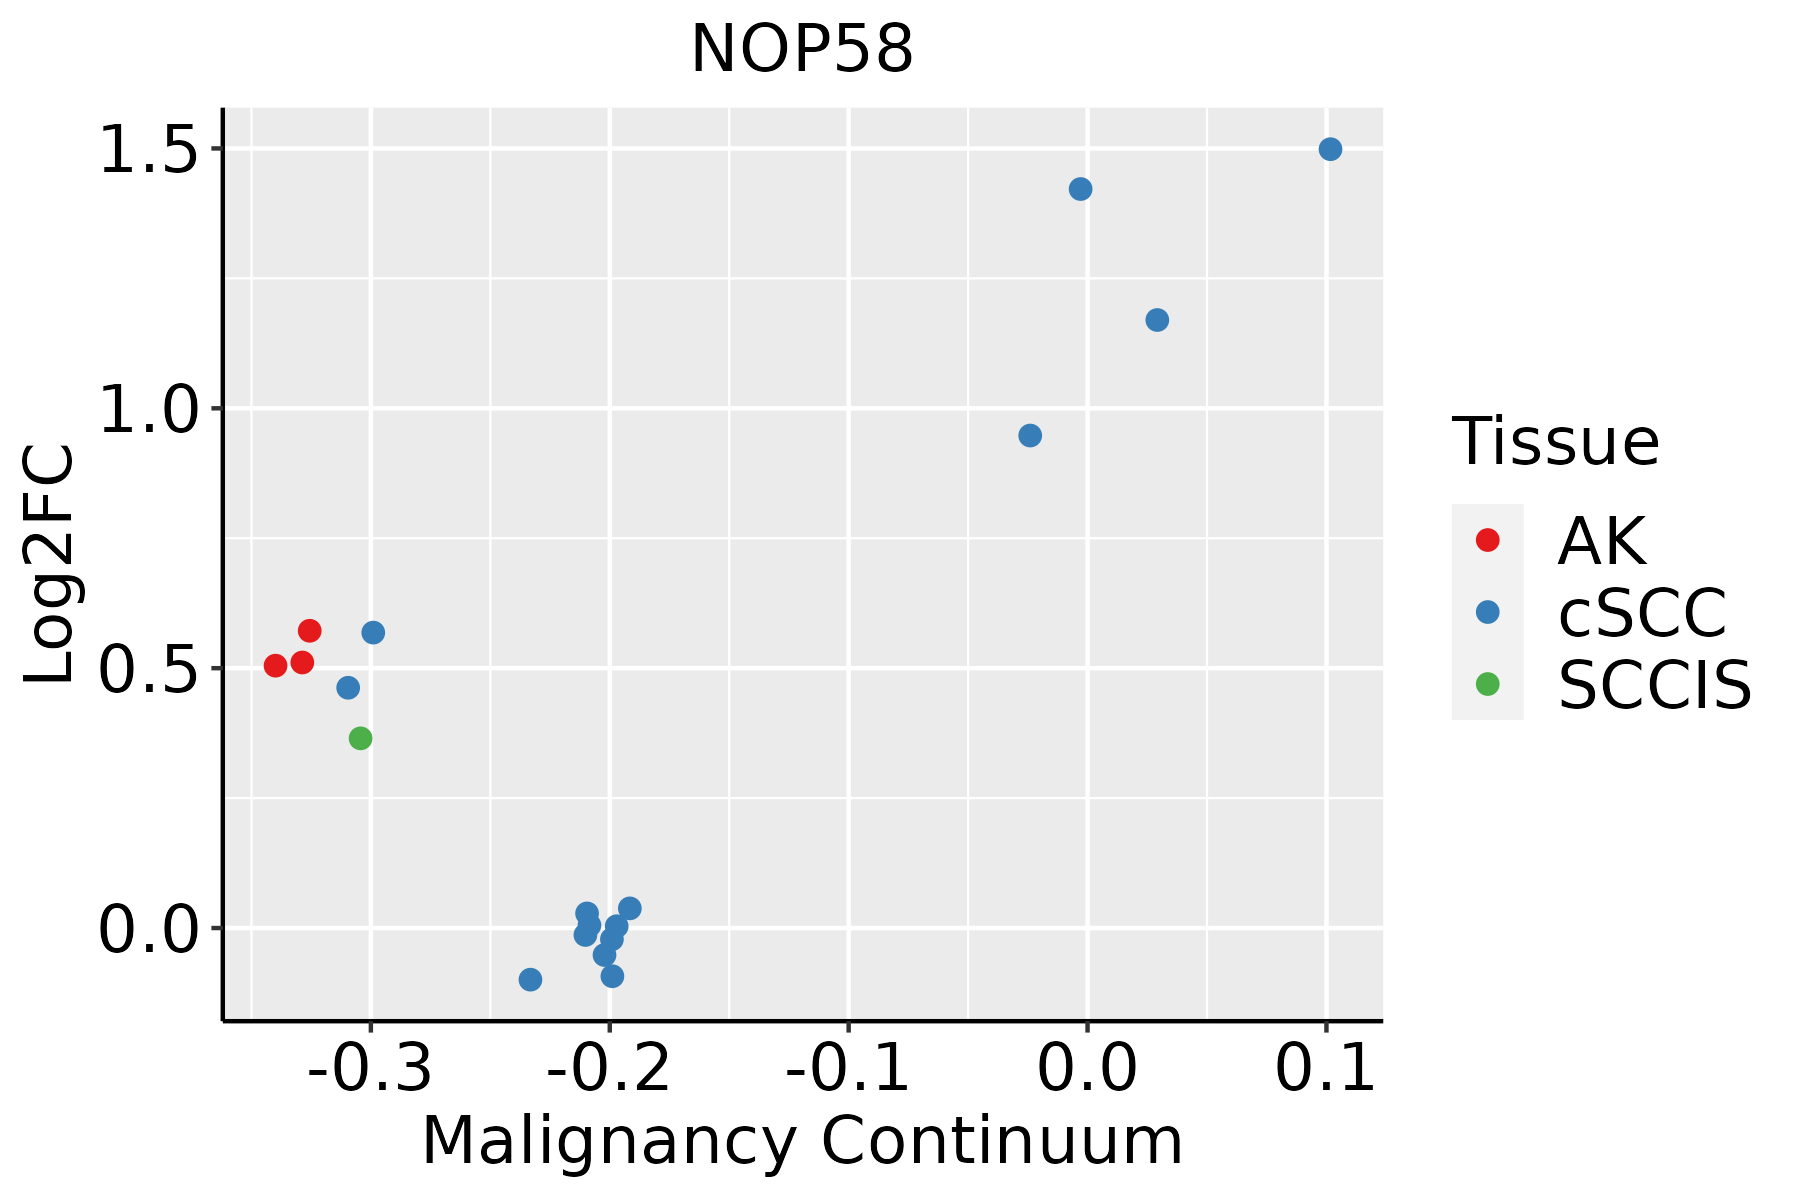 | AK: Actinic keratosis |
| cSCC: Cutaneous squamous cell carcinoma | ||
| SCCIS:squamous cell carcinoma in situ | ||
| Thyroid | 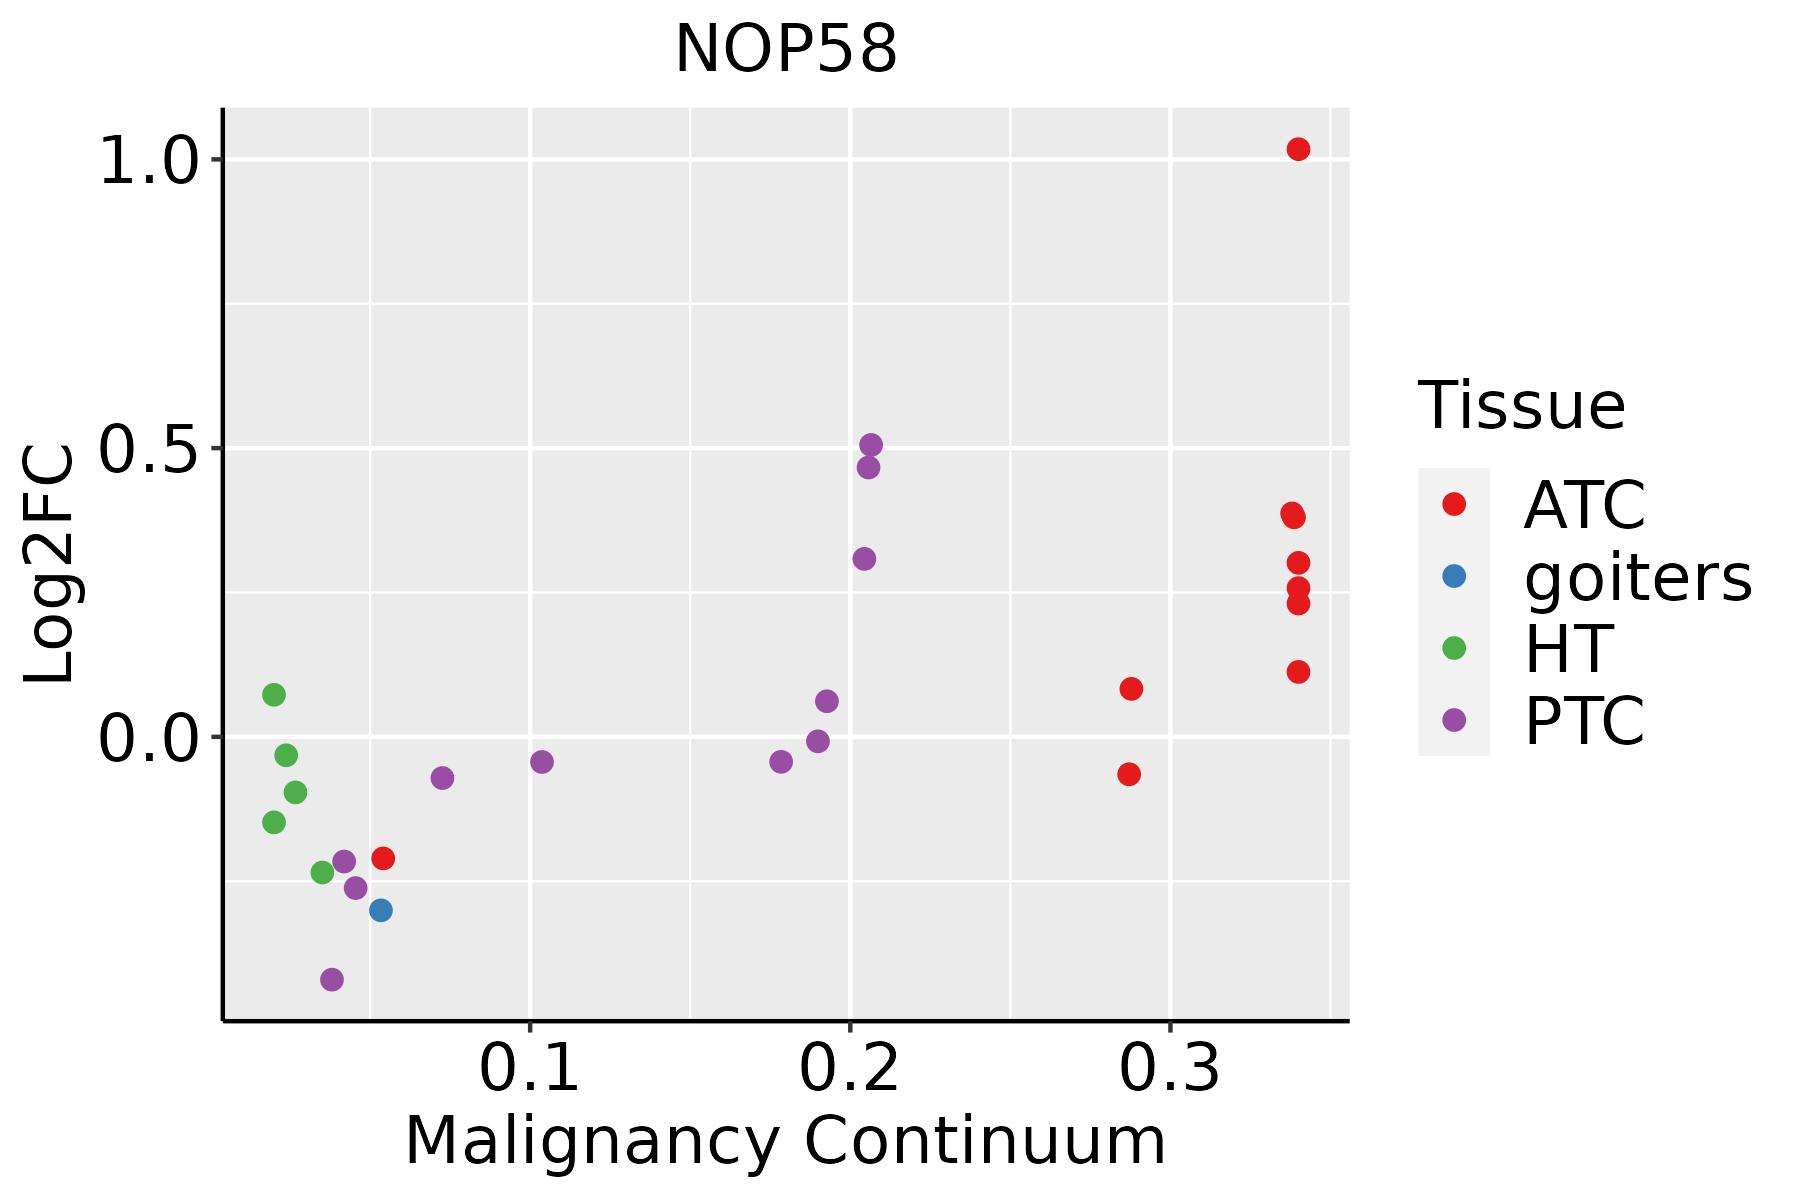 | ATC: Anaplastic thyroid cancer |
| HT: Hashimoto's thyroiditis | ||
| PTC: Papillary thyroid cancer |
| ∗log2FC in expression of this searched gene in stem-like cells from each diseased tissue sample relative to stem-like cells in normal samples in each tissue plotted against the malignancy continuum. Samples are colored based on if they are from different disease stage. |
Top |
Malignant transformation related pathway analysis |
| Find out the enriched GO biological processes and KEGG pathways involved in transition from healthy to precancer to cancer |
| Tissue | Disease Stage | Enriched GO biological Processes |
| Colorectum | AD |  |
| Colorectum | SER |  |
| Colorectum | MSS |  |
| Colorectum | MSI-H |  |
| Colorectum | FAP |  |
| ∗Top 15 enriched GO BP terms are showed in the bar plot of each disease state in each tissue. Each row represents a significant GO biological process which is colored according to the -log10(p.adjust). |
| Page: 1 2 3 4 5 6 7 8 9 |
| GO ID | Tissue | Disease Stage | Description | Gene Ratio | Bg Ratio | pvalue | p.adjust | Count |
| GO:002261327 | Esophagus | HGIN | ribonucleoprotein complex biogenesis | 158/2587 | 463/18723 | 2.61e-29 | 5.23e-26 | 158 |
| GO:004225426 | Esophagus | HGIN | ribosome biogenesis | 101/2587 | 299/18723 | 8.74e-19 | 4.03e-16 | 101 |
| GO:000640320 | Esophagus | HGIN | RNA localization | 66/2587 | 201/18723 | 4.06e-12 | 5.41e-10 | 66 |
| GO:001607219 | Esophagus | HGIN | rRNA metabolic process | 72/2587 | 236/18723 | 2.26e-11 | 2.56e-09 | 72 |
| GO:000636419 | Esophagus | HGIN | rRNA processing | 69/2587 | 225/18723 | 4.53e-11 | 5.04e-09 | 69 |
| GO:003447010 | Esophagus | HGIN | ncRNA processing | 97/2587 | 395/18723 | 5.92e-09 | 3.90e-07 | 97 |
| GO:00346606 | Esophagus | HGIN | ncRNA metabolic process | 104/2587 | 485/18723 | 2.26e-06 | 8.23e-05 | 104 |
| GO:0022613111 | Esophagus | ESCC | ribonucleoprotein complex biogenesis | 365/8552 | 463/18723 | 1.74e-49 | 1.11e-45 | 365 |
| GO:0042254111 | Esophagus | ESCC | ribosome biogenesis | 252/8552 | 299/18723 | 3.27e-44 | 1.04e-40 | 252 |
| GO:003447015 | Esophagus | ESCC | ncRNA processing | 300/8552 | 395/18723 | 3.09e-35 | 3.26e-32 | 300 |
| GO:0016072110 | Esophagus | ESCC | rRNA metabolic process | 197/8552 | 236/18723 | 1.31e-33 | 1.18e-30 | 197 |
| GO:0006364110 | Esophagus | ESCC | rRNA processing | 189/8552 | 225/18723 | 4.88e-33 | 3.87e-30 | 189 |
| GO:003466012 | Esophagus | ESCC | ncRNA metabolic process | 346/8552 | 485/18723 | 4.35e-31 | 2.51e-28 | 346 |
| GO:0006403110 | Esophagus | ESCC | RNA localization | 166/8552 | 201/18723 | 1.95e-27 | 6.18e-25 | 166 |
| GO:00226137 | Liver | NAFLD | ribonucleoprotein complex biogenesis | 76/1882 | 463/18723 | 1.19e-05 | 3.67e-04 | 76 |
| GO:00422547 | Liver | NAFLD | ribosome biogenesis | 52/1882 | 299/18723 | 6.03e-05 | 1.32e-03 | 52 |
| GO:00344704 | Liver | NAFLD | ncRNA processing | 57/1882 | 395/18723 | 3.34e-03 | 2.93e-02 | 57 |
| GO:00064037 | Liver | NAFLD | RNA localization | 32/1882 | 201/18723 | 5.96e-03 | 4.48e-02 | 32 |
| GO:00063644 | Liver | NAFLD | rRNA processing | 35/1882 | 225/18723 | 6.04e-03 | 4.54e-02 | 35 |
| GO:002261312 | Liver | Cirrhotic | ribonucleoprotein complex biogenesis | 231/4634 | 463/18723 | 3.28e-32 | 6.86e-29 | 231 |
| Page: 1 2 3 4 5 |
| Pathway ID | Tissue | Disease Stage | Description | Gene Ratio | Bg Ratio | pvalue | p.adjust | qvalue | Count |
| Page: 1 |
Top |
Cell-cell communication analysis |
| Identification of potential cell-cell interactions between two cell types and their ligand-receptor pairs for different disease states |
| Ligand | Receptor | LRpair | Pathway | Tissue | Disease Stage |
| Page: 1 |
Top |
Single-cell gene regulatory network inference analysis |
| Find out the significant the regulons (TFs) and the target genes of each regulon across cell types for different disease states |
| TF | Cell Type | Tissue | Disease Stage | Target Gene | RSS | Regulon Activity |
| ∗The dot plots of a searched regulon are shown for all cell subpopulations in each disease state of each tissue based on the regulon specific score inferred using pySCENIC and by calculating the average expression. |
| Page: 1 |
Top |
Somatic mutation of malignant transformation related genes |
| Annotation of somatic variants for genes involved in malignant transformation |
| Hugo Symbol | Variant Class | Variant Classification | dbSNP RS | HGVSc | HGVSp | HGVSp Short | SWISSPROT | BIOTYPE | SIFT | PolyPhen | Tumor Sample Barcode | Tissue | Histology | Sex | Age | Stage | Therapy Types | Drugs | Outcome |
| NOP58 | SNV | Missense_Mutation | novel | c.1187N>C | p.Arg396Thr | p.R396T | Q9Y2X3 | protein_coding | deleterious(0) | benign(0.439) | TCGA-AC-A5XS-01 | Breast | breast invasive carcinoma | Female | >=65 | I/II | Hormone Therapy | femara | SD |
| NOP58 | SNV | Missense_Mutation | c.67N>G | p.Gln23Glu | p.Q23E | Q9Y2X3 | protein_coding | tolerated(0.63) | benign(0.017) | TCGA-BH-A0HP-01 | Breast | breast invasive carcinoma | Female | >=65 | III/IV | Chemotherapy | doxorubicin | SD | |
| NOP58 | SNV | Missense_Mutation | c.348N>A | p.Met116Ile | p.M116I | Q9Y2X3 | protein_coding | deleterious(0.03) | benign(0.007) | TCGA-C8-A26Y-01 | Breast | breast invasive carcinoma | Female | >=65 | I/II | Unknown | Unknown | SD | |
| NOP58 | insertion | Frame_Shift_Ins | novel | c.1320_1321insA | p.Arg443ThrfsTer8 | p.R443Tfs*8 | Q9Y2X3 | protein_coding | TCGA-AN-A0AK-01 | Breast | breast invasive carcinoma | Female | >=65 | I/II | Unknown | Unknown | SD | ||
| NOP58 | SNV | Missense_Mutation | c.919N>C | p.Asn307His | p.N307H | Q9Y2X3 | protein_coding | deleterious(0) | probably_damaging(0.992) | TCGA-FU-A3HZ-01 | Cervix | cervical & endocervical cancer | Female | <65 | I/II | Chemotherapy | cisplatin | CR | |
| NOP58 | SNV | Missense_Mutation | c.1100N>G | p.Val367Gly | p.V367G | Q9Y2X3 | protein_coding | deleterious(0) | benign(0.102) | TCGA-AA-A010-01 | Colorectum | colon adenocarcinoma | Female | <65 | I/II | Chemotherapy | folinic | CR | |
| NOP58 | SNV | Missense_Mutation | c.563N>A | p.Gly188Asp | p.G188D | Q9Y2X3 | protein_coding | deleterious(0.01) | probably_damaging(0.963) | TCGA-AD-6889-01 | Colorectum | colon adenocarcinoma | Male | >=65 | I/II | Chemotherapy | xeloda | PD | |
| NOP58 | SNV | Missense_Mutation | c.1079G>A | p.Arg360Gln | p.R360Q | Q9Y2X3 | protein_coding | deleterious(0) | probably_damaging(0.995) | TCGA-AD-6895-01 | Colorectum | colon adenocarcinoma | Male | >=65 | III/IV | Unknown | Unknown | SD | |
| NOP58 | SNV | Missense_Mutation | rs755969953 | c.359N>A | p.Arg120His | p.R120H | Q9Y2X3 | protein_coding | deleterious(0) | probably_damaging(0.993) | TCGA-CA-6717-01 | Colorectum | colon adenocarcinoma | Male | <65 | I/II | Chemotherapy | oxaliplatin | CR |
| NOP58 | SNV | Missense_Mutation | c.1531N>A | p.Ala511Thr | p.A511T | Q9Y2X3 | protein_coding | tolerated(0.4) | benign(0) | TCGA-CM-5861-01 | Colorectum | colon adenocarcinoma | Female | <65 | I/II | Unknown | Unknown | PD |
| Page: 1 2 3 4 5 |
Top |
Related drugs of malignant transformation related genes |
| Identification of chemicals and drugs interact with genes involved in malignant transfromation |
| (DGIdb 4.0) |
| Entrez ID | Symbol | Category | Interaction Types | Drug Claim Name | Drug Name | PMIDs |
| Page: 1 |

Copyright 2023-Present -The University of Texas Health Science Center at Houston |