
|
|||||
|
 | |
| |
| |
| |
| |
| |
|
Gene: NOL7 |
Gene summary for NOL7 |
| Gene information | Species | Human | Gene symbol | NOL7 | Gene ID | 51406 |
| Gene name | nucleolar protein 7 | |
| Gene Alias | C6orf90 | |
| Cytomap | 6p23 | |
| Gene Type | protein-coding | GO ID | GO:0005575 | UniProtAcc | A0A024QZW2 |
Top |
Malignant transformation analysis |
| Identification of the aberrant gene expression in precancerous and cancerous lesions by comparing the gene expression of stem-like cells in diseased tissues with normal stem cells |
| Entrez ID | Symbol | Replicates | Species | Organ | Tissue | Adj P-value | Log2FC | Malignancy |
| 51406 | NOL7 | P40T-E | Human | Esophagus | ESCC | 5.89e-23 | 8.75e-01 | 0.109 |
| 51406 | NOL7 | P42T-E | Human | Esophagus | ESCC | 2.30e-30 | 7.94e-01 | 0.1175 |
| 51406 | NOL7 | P44T-E | Human | Esophagus | ESCC | 4.63e-26 | 8.00e-01 | 0.1096 |
| 51406 | NOL7 | P47T-E | Human | Esophagus | ESCC | 1.08e-37 | 7.42e-01 | 0.1067 |
| 51406 | NOL7 | P48T-E | Human | Esophagus | ESCC | 1.83e-34 | 7.04e-01 | 0.0959 |
| 51406 | NOL7 | P49T-E | Human | Esophagus | ESCC | 5.75e-23 | 2.44e+00 | 0.1768 |
| 51406 | NOL7 | P52T-E | Human | Esophagus | ESCC | 5.79e-75 | 1.50e+00 | 0.1555 |
| 51406 | NOL7 | P54T-E | Human | Esophagus | ESCC | 5.12e-40 | 1.16e+00 | 0.0975 |
| 51406 | NOL7 | P56T-E | Human | Esophagus | ESCC | 1.13e-10 | 1.99e+00 | 0.1613 |
| 51406 | NOL7 | P57T-E | Human | Esophagus | ESCC | 2.84e-45 | 8.84e-01 | 0.0926 |
| 51406 | NOL7 | P61T-E | Human | Esophagus | ESCC | 3.33e-31 | 7.85e-01 | 0.099 |
| 51406 | NOL7 | P62T-E | Human | Esophagus | ESCC | 1.60e-80 | 1.45e+00 | 0.1302 |
| 51406 | NOL7 | P65T-E | Human | Esophagus | ESCC | 3.64e-56 | 1.25e+00 | 0.0978 |
| 51406 | NOL7 | P74T-E | Human | Esophagus | ESCC | 3.24e-57 | 2.00e+00 | 0.1479 |
| 51406 | NOL7 | P75T-E | Human | Esophagus | ESCC | 1.37e-86 | 1.93e+00 | 0.1125 |
| 51406 | NOL7 | P76T-E | Human | Esophagus | ESCC | 8.24e-35 | 6.96e-01 | 0.1207 |
| 51406 | NOL7 | P79T-E | Human | Esophagus | ESCC | 4.39e-62 | 1.27e+00 | 0.1154 |
| 51406 | NOL7 | P80T-E | Human | Esophagus | ESCC | 5.91e-65 | 2.64e+00 | 0.155 |
| 51406 | NOL7 | P82T-E | Human | Esophagus | ESCC | 4.24e-32 | 1.78e+00 | 0.1072 |
| 51406 | NOL7 | P83T-E | Human | Esophagus | ESCC | 9.96e-65 | 2.00e+00 | 0.1738 |
| Page: 1 2 3 4 5 6 7 8 |
| Tissue | Expression Dynamics | Abbreviation |
| Colorectum (GSE201348) |  | FAP: Familial adenomatous polyposis |
| CRC: Colorectal cancer | ||
| Colorectum (HTA11) | 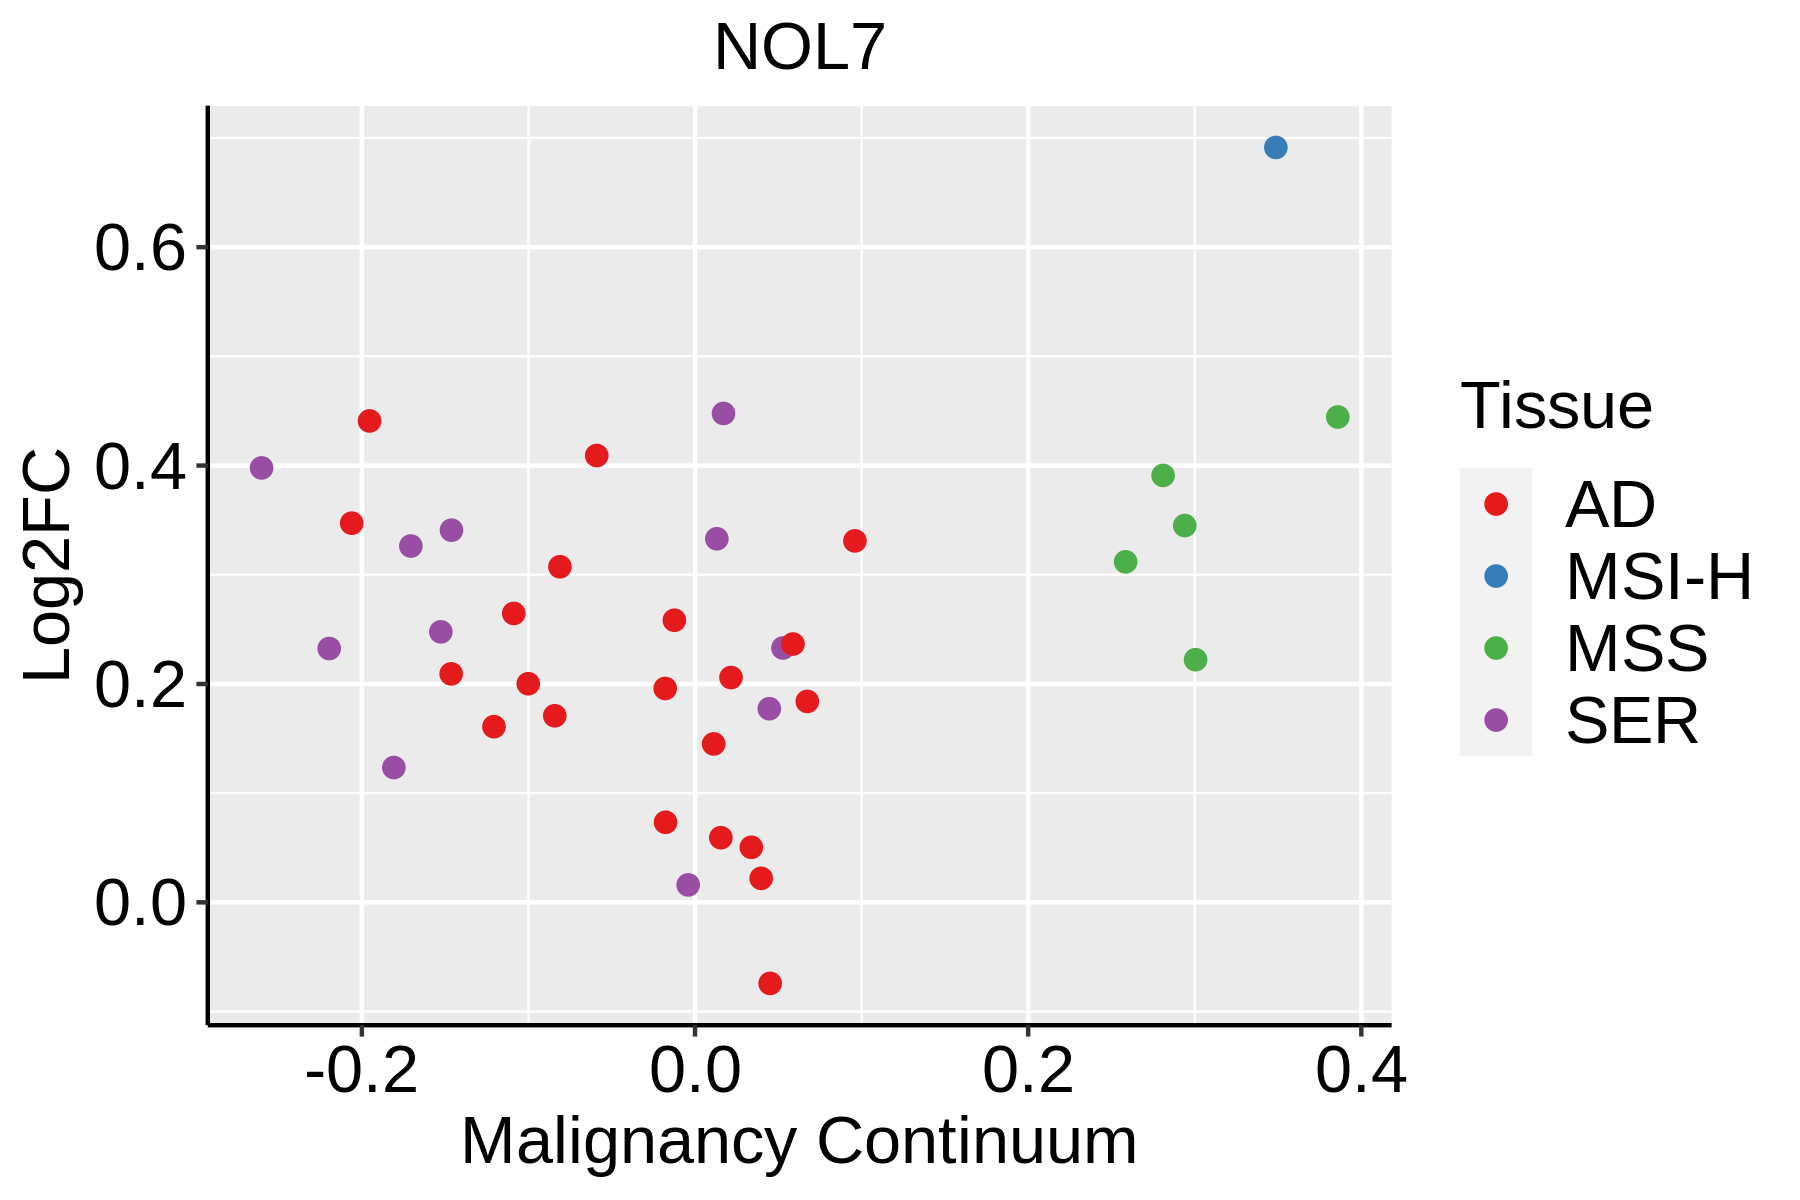 | AD: Adenomas |
| SER: Sessile serrated lesions | ||
| MSI-H: Microsatellite-high colorectal cancer | ||
| MSS: Microsatellite stable colorectal cancer | ||
| Esophagus | 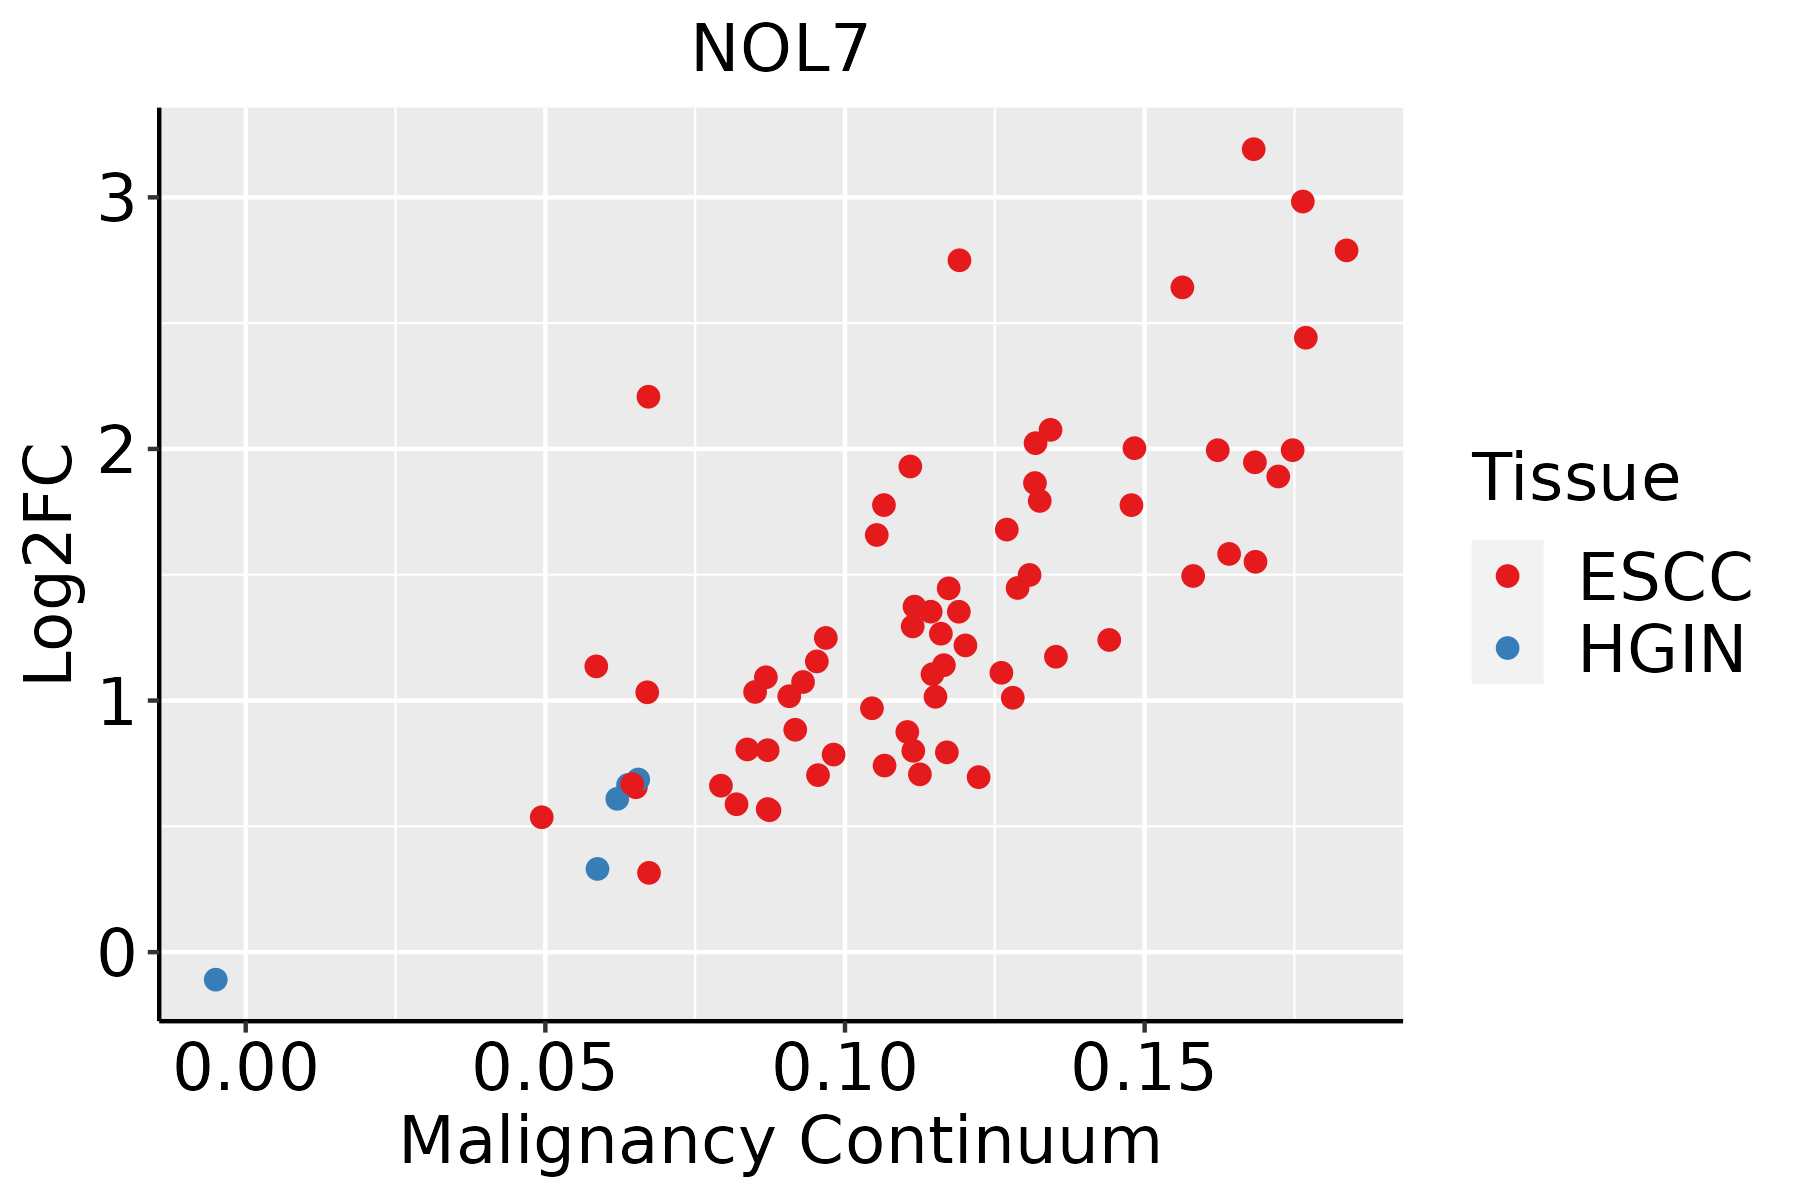 | ESCC: Esophageal squamous cell carcinoma |
| HGIN: High-grade intraepithelial neoplasias | ||
| LGIN: Low-grade intraepithelial neoplasias | ||
| Liver |  | HCC: Hepatocellular carcinoma |
| NAFLD: Non-alcoholic fatty liver disease | ||
| Oral Cavity | 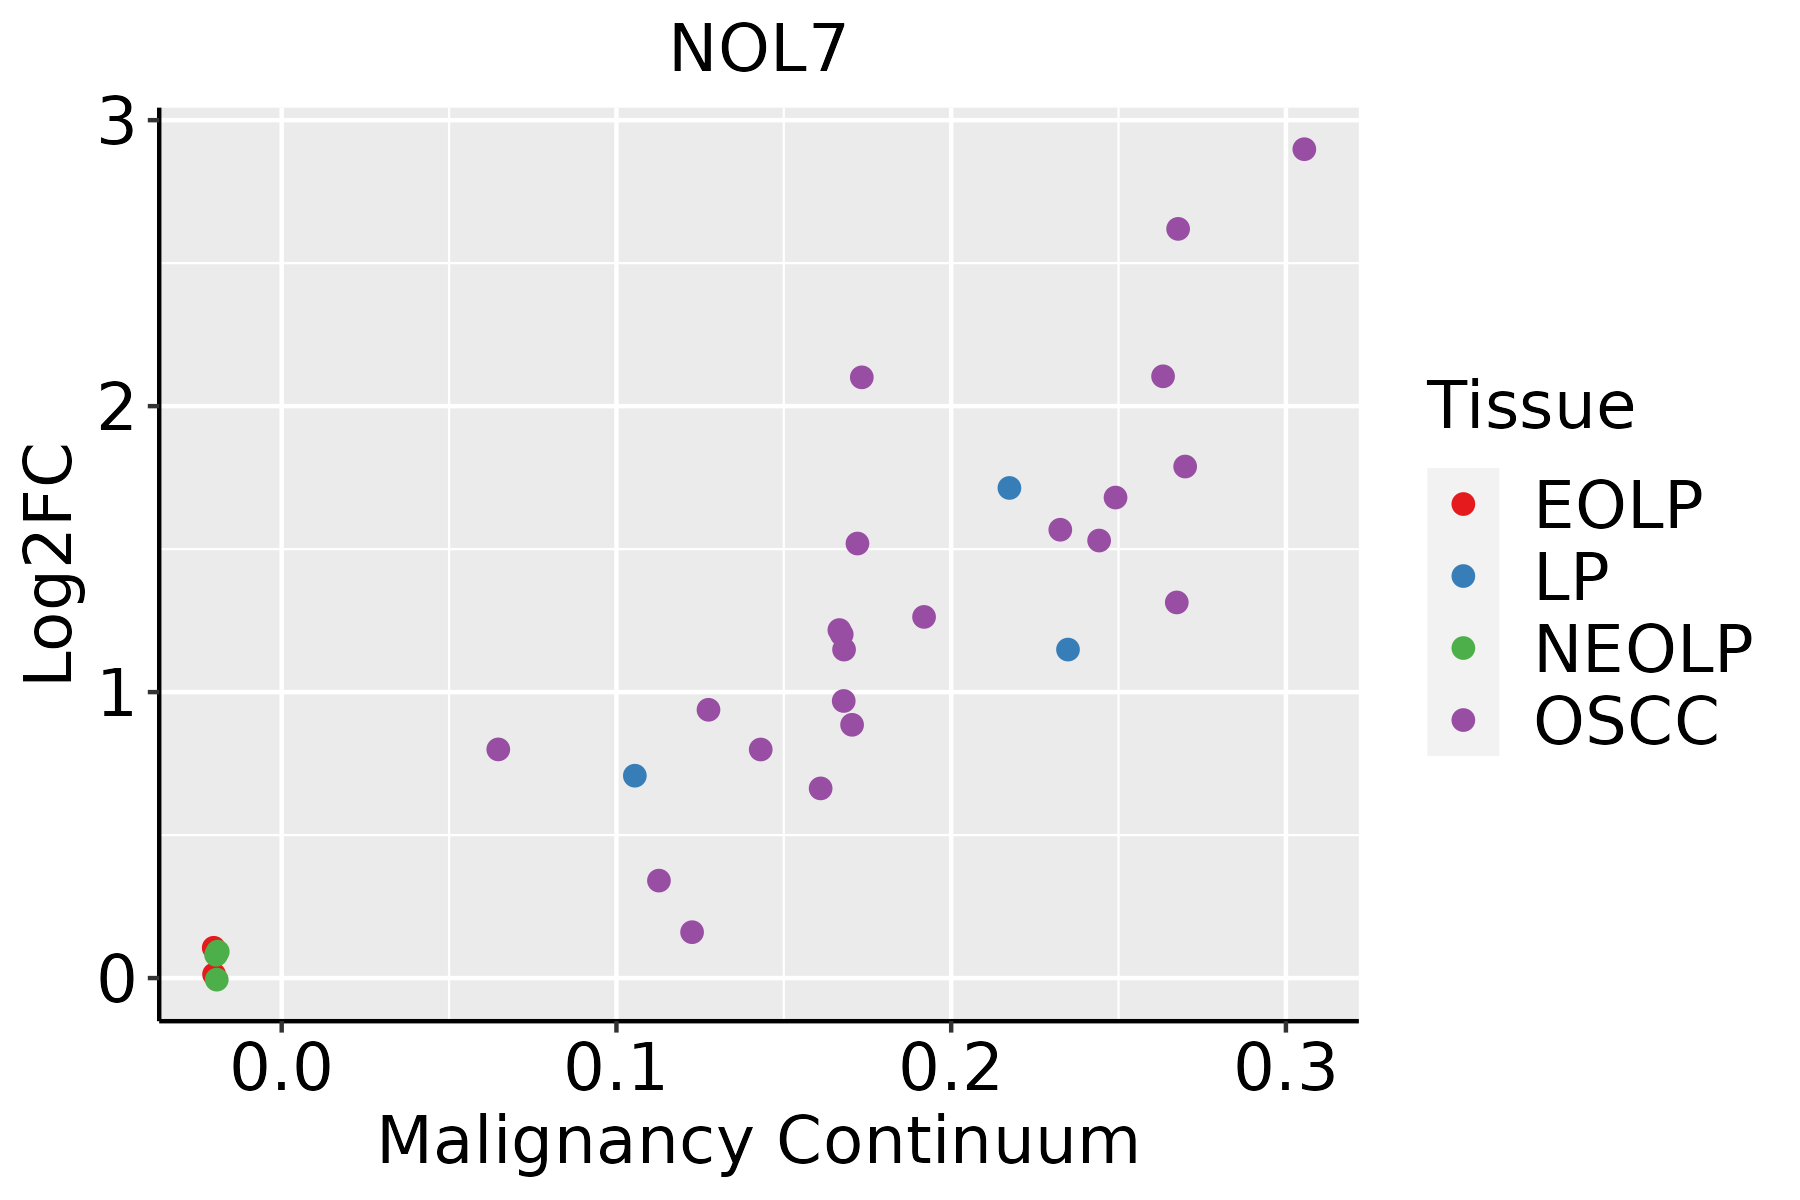 | EOLP: Erosive Oral lichen planus |
| LP: leukoplakia | ||
| NEOLP: Non-erosive oral lichen planus | ||
| OSCC: Oral squamous cell carcinoma | ||
| Prostate |  | BPH: Benign Prostatic Hyperplasia |
| Skin | 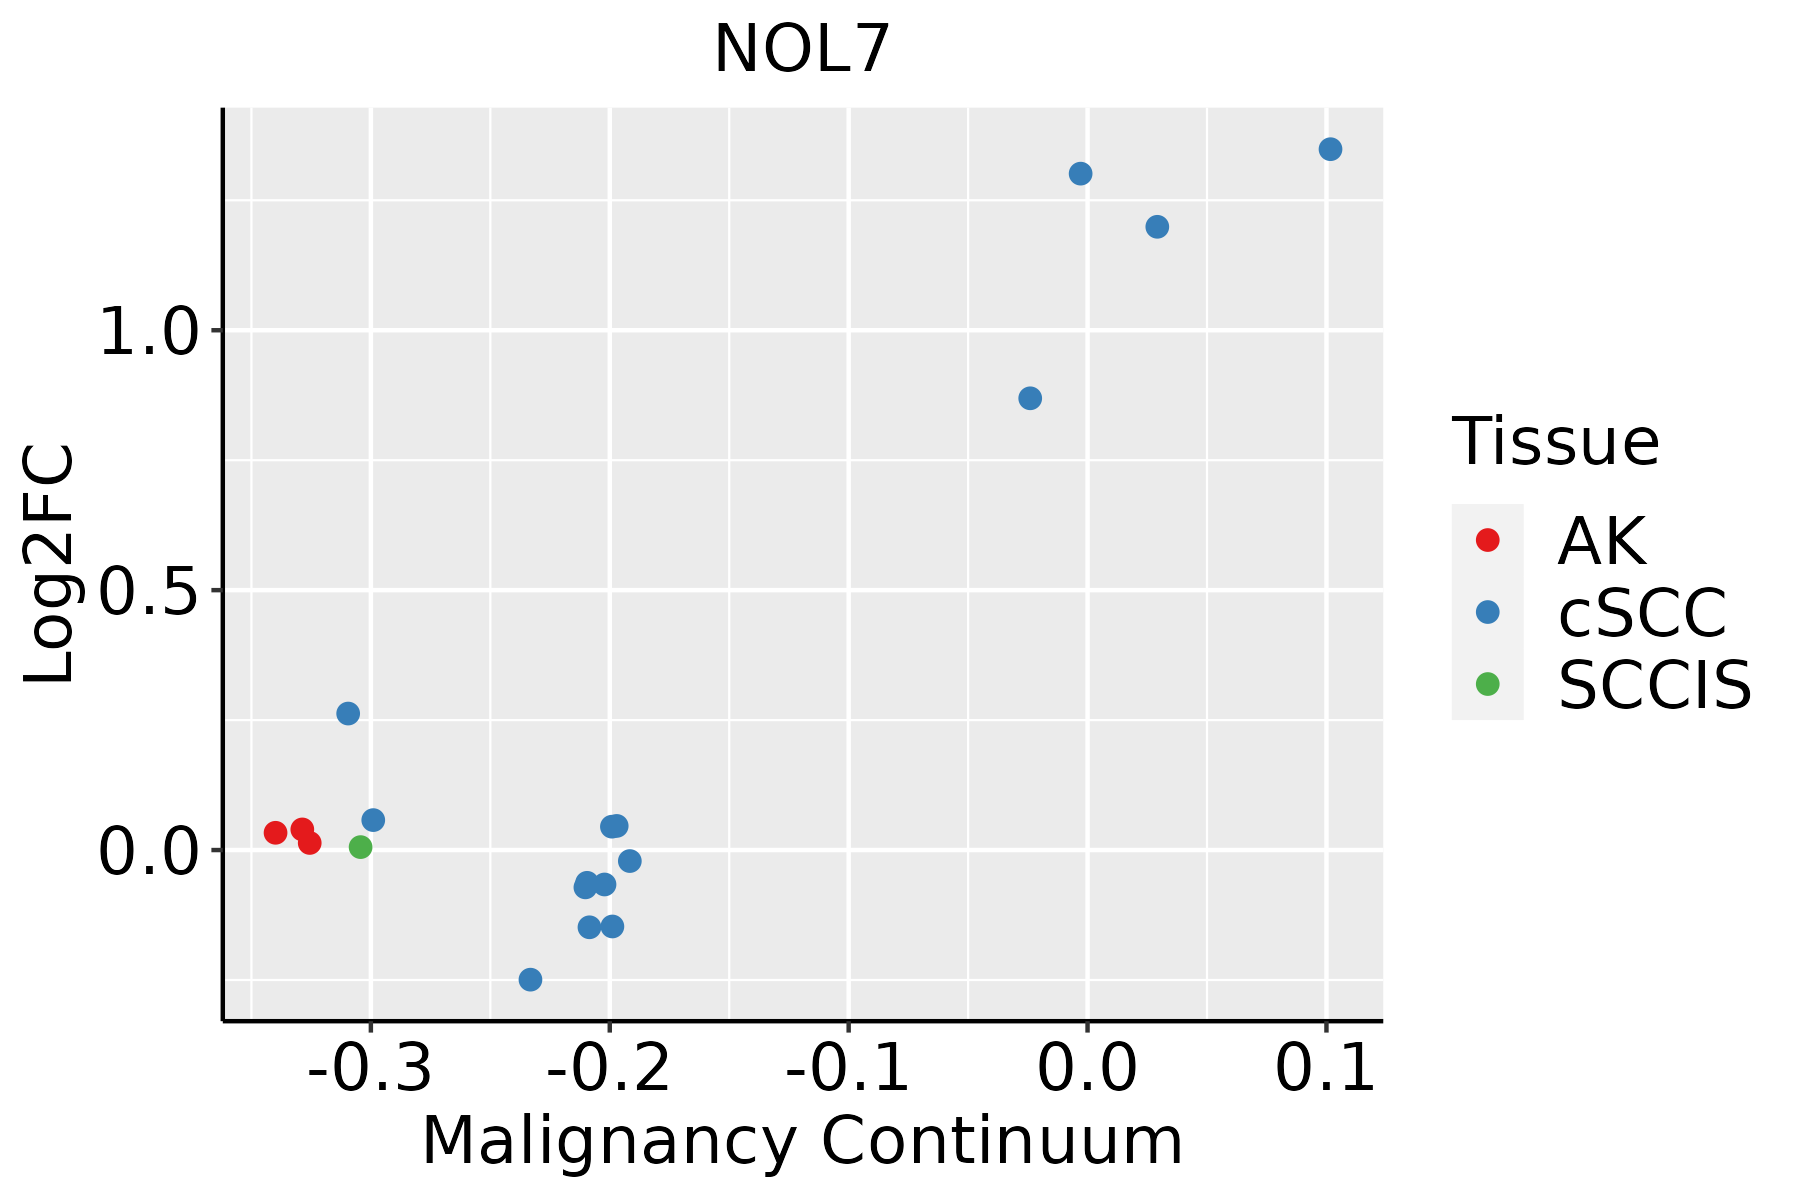 | AK: Actinic keratosis |
| cSCC: Cutaneous squamous cell carcinoma | ||
| SCCIS:squamous cell carcinoma in situ | ||
| Thyroid | 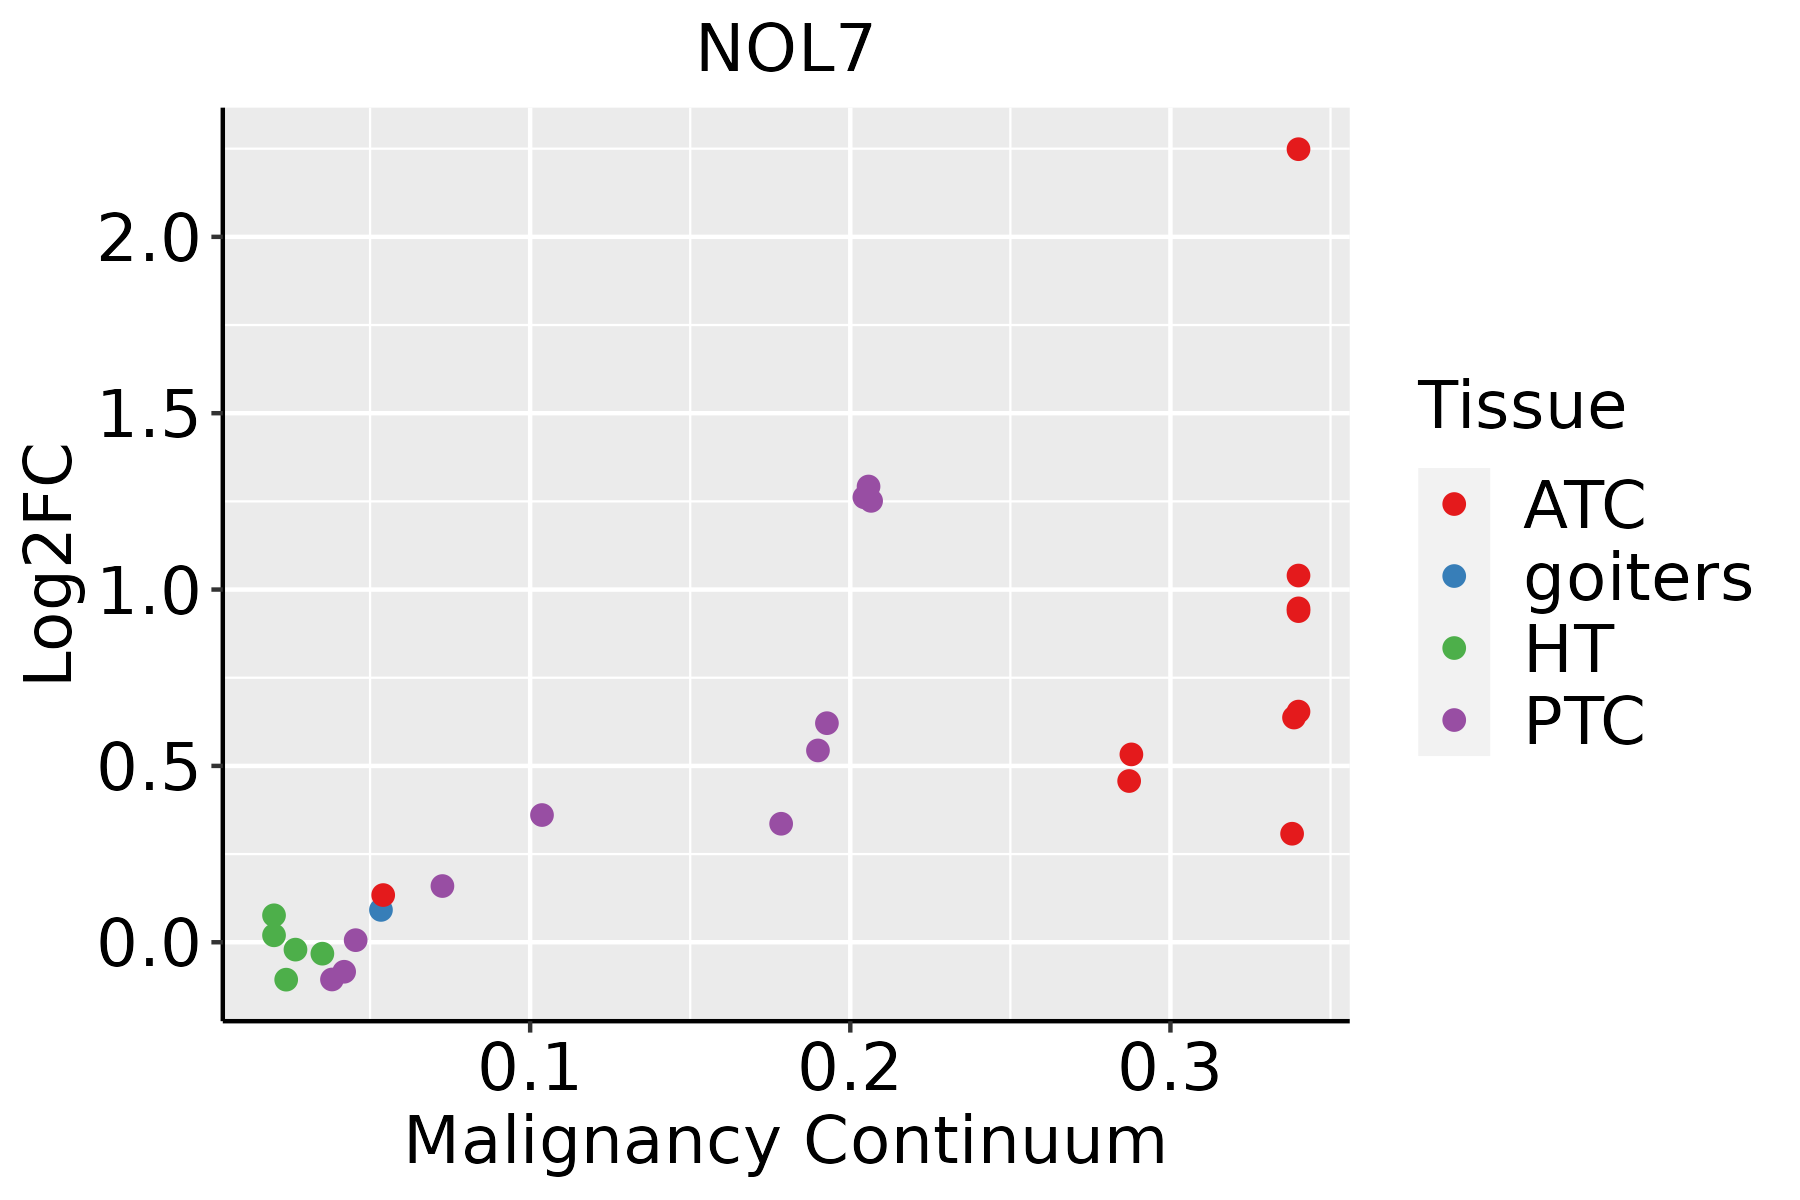 | ATC: Anaplastic thyroid cancer |
| HT: Hashimoto's thyroiditis | ||
| PTC: Papillary thyroid cancer |
| ∗log2FC in expression of this searched gene in stem-like cells from each diseased tissue sample relative to stem-like cells in normal samples in each tissue plotted against the malignancy continuum. Samples are colored based on if they are from different disease stage. |
Top |
Malignant transformation related pathway analysis |
| Find out the enriched GO biological processes and KEGG pathways involved in transition from healthy to precancer to cancer |
| Tissue | Disease Stage | Enriched GO biological Processes |
| Colorectum | AD |  |
| Colorectum | SER |  |
| Colorectum | MSS |  |
| Colorectum | MSI-H |  |
| Colorectum | FAP |  |
| ∗Top 15 enriched GO BP terms are showed in the bar plot of each disease state in each tissue. Each row represents a significant GO biological process which is colored according to the -log10(p.adjust). |
| Page: 1 2 3 4 5 6 7 8 9 |
| GO ID | Tissue | Disease Stage | Description | Gene Ratio | Bg Ratio | pvalue | p.adjust | Count |
| Page: 1 |
| Pathway ID | Tissue | Disease Stage | Description | Gene Ratio | Bg Ratio | pvalue | p.adjust | qvalue | Count |
| Page: 1 |
Top |
Cell-cell communication analysis |
| Identification of potential cell-cell interactions between two cell types and their ligand-receptor pairs for different disease states |
| Ligand | Receptor | LRpair | Pathway | Tissue | Disease Stage |
| Page: 1 |
Top |
Single-cell gene regulatory network inference analysis |
| Find out the significant the regulons (TFs) and the target genes of each regulon across cell types for different disease states |
| TF | Cell Type | Tissue | Disease Stage | Target Gene | RSS | Regulon Activity |
| ∗The dot plots of a searched regulon are shown for all cell subpopulations in each disease state of each tissue based on the regulon specific score inferred using pySCENIC and by calculating the average expression. |
| Page: 1 |
Top |
Somatic mutation of malignant transformation related genes |
| Annotation of somatic variants for genes involved in malignant transformation |
| Hugo Symbol | Variant Class | Variant Classification | dbSNP RS | HGVSc | HGVSp | HGVSp Short | SWISSPROT | BIOTYPE | SIFT | PolyPhen | Tumor Sample Barcode | Tissue | Histology | Sex | Age | Stage | Therapy Types | Drugs | Outcome |
| NOL7 | deletion | Frame_Shift_Del | rs776624076 | c.707delN | p.Lys238AsnfsTer16 | p.K238Nfs*16 | Q9UMY1 | protein_coding | TCGA-A8-A09Z-01 | Breast | breast invasive carcinoma | Female | >=65 | I/II | Unknown | Unknown | SD | ||
| NOL7 | SNV | Missense_Mutation | rs201177610 | c.9N>T | p.Gln3His | p.Q3H | Q9UMY1 | protein_coding | deleterious_low_confidence(0.01) | benign(0.205) | TCGA-EK-A2PG-01 | Cervix | cervical & endocervical cancer | Female | >=65 | I/II | Unknown | Unknown | SD |
| NOL7 | insertion | Frame_Shift_Ins | rs544905440 | c.706_707insA | p.Gln239ThrfsTer7 | p.Q239Tfs*7 | Q9UMY1 | protein_coding | TCGA-A6-2672-01 | Colorectum | colon adenocarcinoma | Female | >=65 | III/IV | Unknown | Unknown | SD | ||
| NOL7 | deletion | Frame_Shift_Del | c.716delN | p.Asn240MetfsTer14 | p.N240Mfs*14 | Q9UMY1 | protein_coding | TCGA-AA-3663-01 | Colorectum | colon adenocarcinoma | Male | <65 | I/II | Unknown | Unknown | SD | |||
| NOL7 | deletion | Frame_Shift_Del | rs776624076 | c.707delN | p.Lys238AsnfsTer16 | p.K238Nfs*16 | Q9UMY1 | protein_coding | TCGA-AA-3715-01 | Colorectum | colon adenocarcinoma | Male | >=65 | I/II | Unknown | Unknown | PD | ||
| NOL7 | insertion | Frame_Shift_Ins | rs544905440 | c.706_707insA | p.Gln239ThrfsTer7 | p.Q239Tfs*7 | Q9UMY1 | protein_coding | TCGA-AA-A01P-01 | Colorectum | colon adenocarcinoma | Female | >=65 | III/IV | Unknown | Unknown | PD | ||
| NOL7 | insertion | Frame_Shift_Ins | rs544905440 | c.706_707insA | p.Gln239ThrfsTer7 | p.Q239Tfs*7 | Q9UMY1 | protein_coding | TCGA-AZ-6598-01 | Colorectum | colon adenocarcinoma | Female | >=65 | I/II | Unknown | Unknown | SD | ||
| NOL7 | SNV | Missense_Mutation | novel | c.340C>A | p.Leu114Ile | p.L114I | Q9UMY1 | protein_coding | deleterious(0) | probably_damaging(0.987) | TCGA-AP-A1E0-01 | Endometrium | uterine corpus endometrioid carcinoma | Female | <65 | III/IV | Chemotherapy | paclitaxel | SD |
| NOL7 | SNV | Missense_Mutation | c.483N>C | p.Gln161His | p.Q161H | Q9UMY1 | protein_coding | deleterious(0.01) | benign(0.248) | TCGA-AX-A0J0-01 | Endometrium | uterine corpus endometrioid carcinoma | Female | <65 | I/II | Unknown | Unknown | SD | |
| NOL7 | SNV | Missense_Mutation | novel | c.565N>A | p.Ala189Thr | p.A189T | Q9UMY1 | protein_coding | tolerated(0.13) | benign(0.241) | TCGA-AX-A2HD-01 | Endometrium | uterine corpus endometrioid carcinoma | Female | >=65 | III/IV | Unknown | Unknown | SD |
| Page: 1 2 3 |
Top |
Related drugs of malignant transformation related genes |
| Identification of chemicals and drugs interact with genes involved in malignant transfromation |
| (DGIdb 4.0) |
| Entrez ID | Symbol | Category | Interaction Types | Drug Claim Name | Drug Name | PMIDs |
| Page: 1 |

Copyright 2023-Present -The University of Texas Health Science Center at Houston |