Schematic overview of the cellular and molecular mechanisms involved in the cancer progression, including the proposed cellular and molecular mechanisms in cancer cells trajectory. AT1: alveolar type 1 cells; AT2: alveolar type 2 cells; AAH: atypical adenomatous hyperplasia; AIS: adenocarcinoma in situ; MIA: minimally invasive adenocarcinoma; IA: invasive adenocarcinoma; EMT: epithelial-mesenchymal transition

Home

Download

Statistics

Help

Contact

Center for Computational Systems Medicine
leaf

Gene summary

leaf

Malignant transformation analysis

leaf

Malignant transformation related pathway analysis

leaf

Cell-cell communication analysis

leaf

Single-cell gene regulatory network inference analysis

leaf

Somatic mutation of malignant transformation related genes

leaf

Related drugs of malignant transformation related genes

Gene: NEK6

Gene summary for NEK6

check button Gene summary.

Gene informationSpeciesHuman
Gene symbol

NEK6

Gene ID

10783

Gene nameNIMA related kinase 6
Gene AliasSID6-1512
Cytomap9q33.3
Gene Typeprotein-coding
GO ID

GO:0000070

UniProtAcc

Q9HC98


Top

Malignant transformation analysis

check button Identification of the aberrant gene expression in precancerous and cancerous lesions by comparing the gene expression of stem-like cells in diseased tissues with normal stem cells
check button Malignant transformation involving gene list.
Entrez IDSymbolReplicatesSpeciesOrganTissueAdj P-valueLog2FCMalignancy
10783NEK6HCC2_MengHumanLiverHCC1.02e-05-6.76e-020.0107
10783NEK6HCC1HumanLiverHCC6.34e-103.48e+000.5336
10783NEK6HCC2HumanLiverHCC1.45e-043.33e+000.5341
10783NEK6S014HumanLiverHCC3.96e-105.06e-010.2254
10783NEK6S015HumanLiverHCC1.67e-085.19e-010.2375
10783NEK6S016HumanLiverHCC1.80e-145.54e-010.2243
10783NEK6S027HumanLiverHCC2.04e-181.50e+000.2446
10783NEK6S028HumanLiverHCC4.27e-341.66e+000.2503
10783NEK6S029HumanLiverHCC5.59e-351.98e+000.2581
10783NEK6RNA-P17T-P17T-4HumanLungIAC5.82e-056.66e-010.343
10783NEK6RNA-P17T-P17T-6HumanLungIAC8.00e-045.36e-010.3385
10783NEK6RNA-P17T-P17T-8HumanLungIAC1.11e-025.16e-010.3329
10783NEK6RNA-P6T2-P6T2-3HumanLungIAC2.18e-021.83e-01-0.013
10783NEK6C04HumanOral cavityOSCC4.88e-125.51e-010.2633
10783NEK6C21HumanOral cavityOSCC1.13e-288.65e-010.2678
10783NEK6C30HumanOral cavityOSCC2.52e-602.38e+000.3055
10783NEK6C43HumanOral cavityOSCC8.65e-255.12e-010.1704
10783NEK6C51HumanOral cavityOSCC1.51e-156.22e-010.2674
10783NEK6C06HumanOral cavityOSCC1.23e-111.43e+000.2699
10783NEK6C07HumanOral cavityOSCC4.63e-043.99e-010.2491
Page: 1 2 3 4 5 

check button Transcriptomic changes along malignancy continuum.
TissueExpression DynamicsAbbreviation
EsophagusThe image shows the transcriptomic changes along malignancy continuum.log2FC in expression of this searched gene in stem-like cells from each diseased tissue sample relative to stem-like cells in normal samples in each tissue plotted against the malignancy continuum. Samples are colored based on if they are from different disease stage.
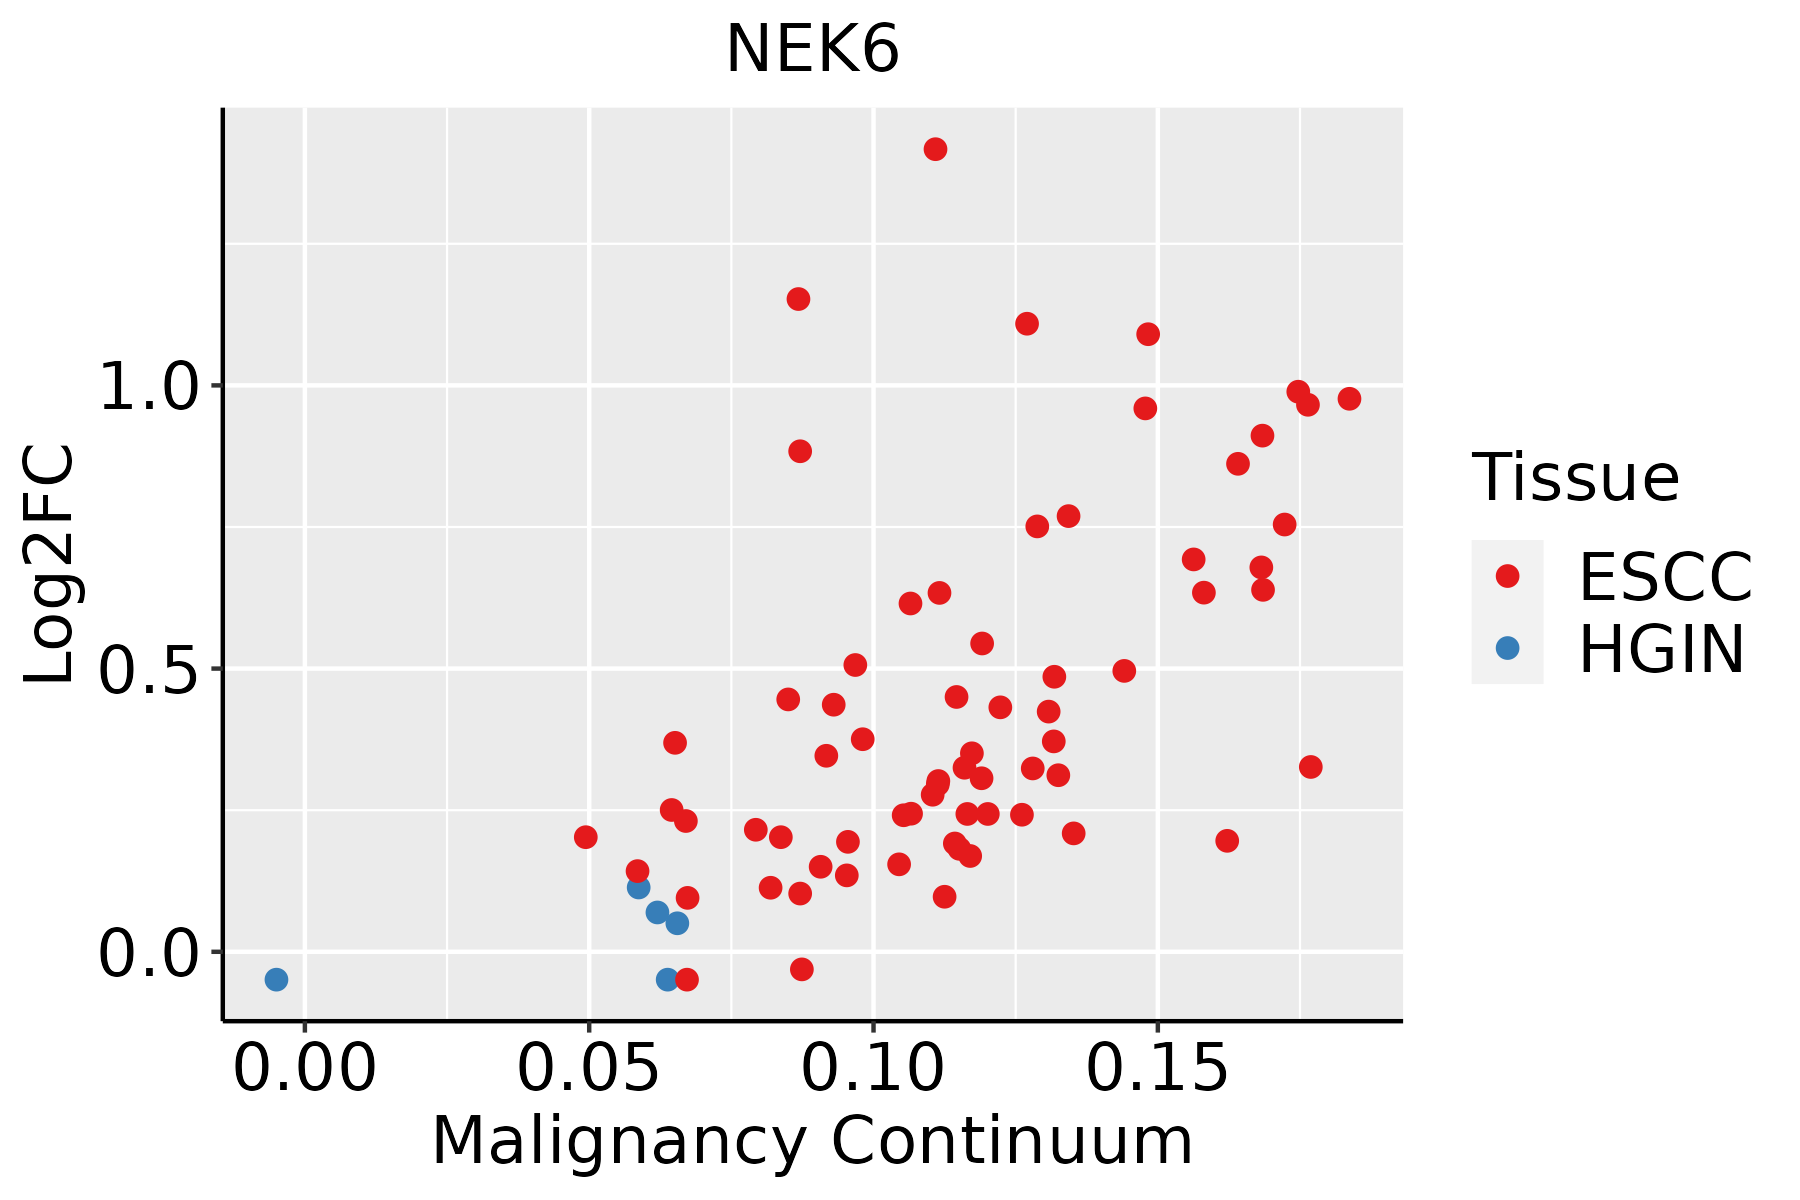
ESCC: Esophageal squamous cell carcinoma
HGIN: High-grade intraepithelial neoplasias
LGIN: Low-grade intraepithelial neoplasias
LiverThe image shows the transcriptomic changes along malignancy continuum.log2FC in expression of this searched gene in stem-like cells from each diseased tissue sample relative to stem-like cells in normal samples in each tissue plotted against the malignancy continuum. Samples are colored based on if they are from different disease stage.
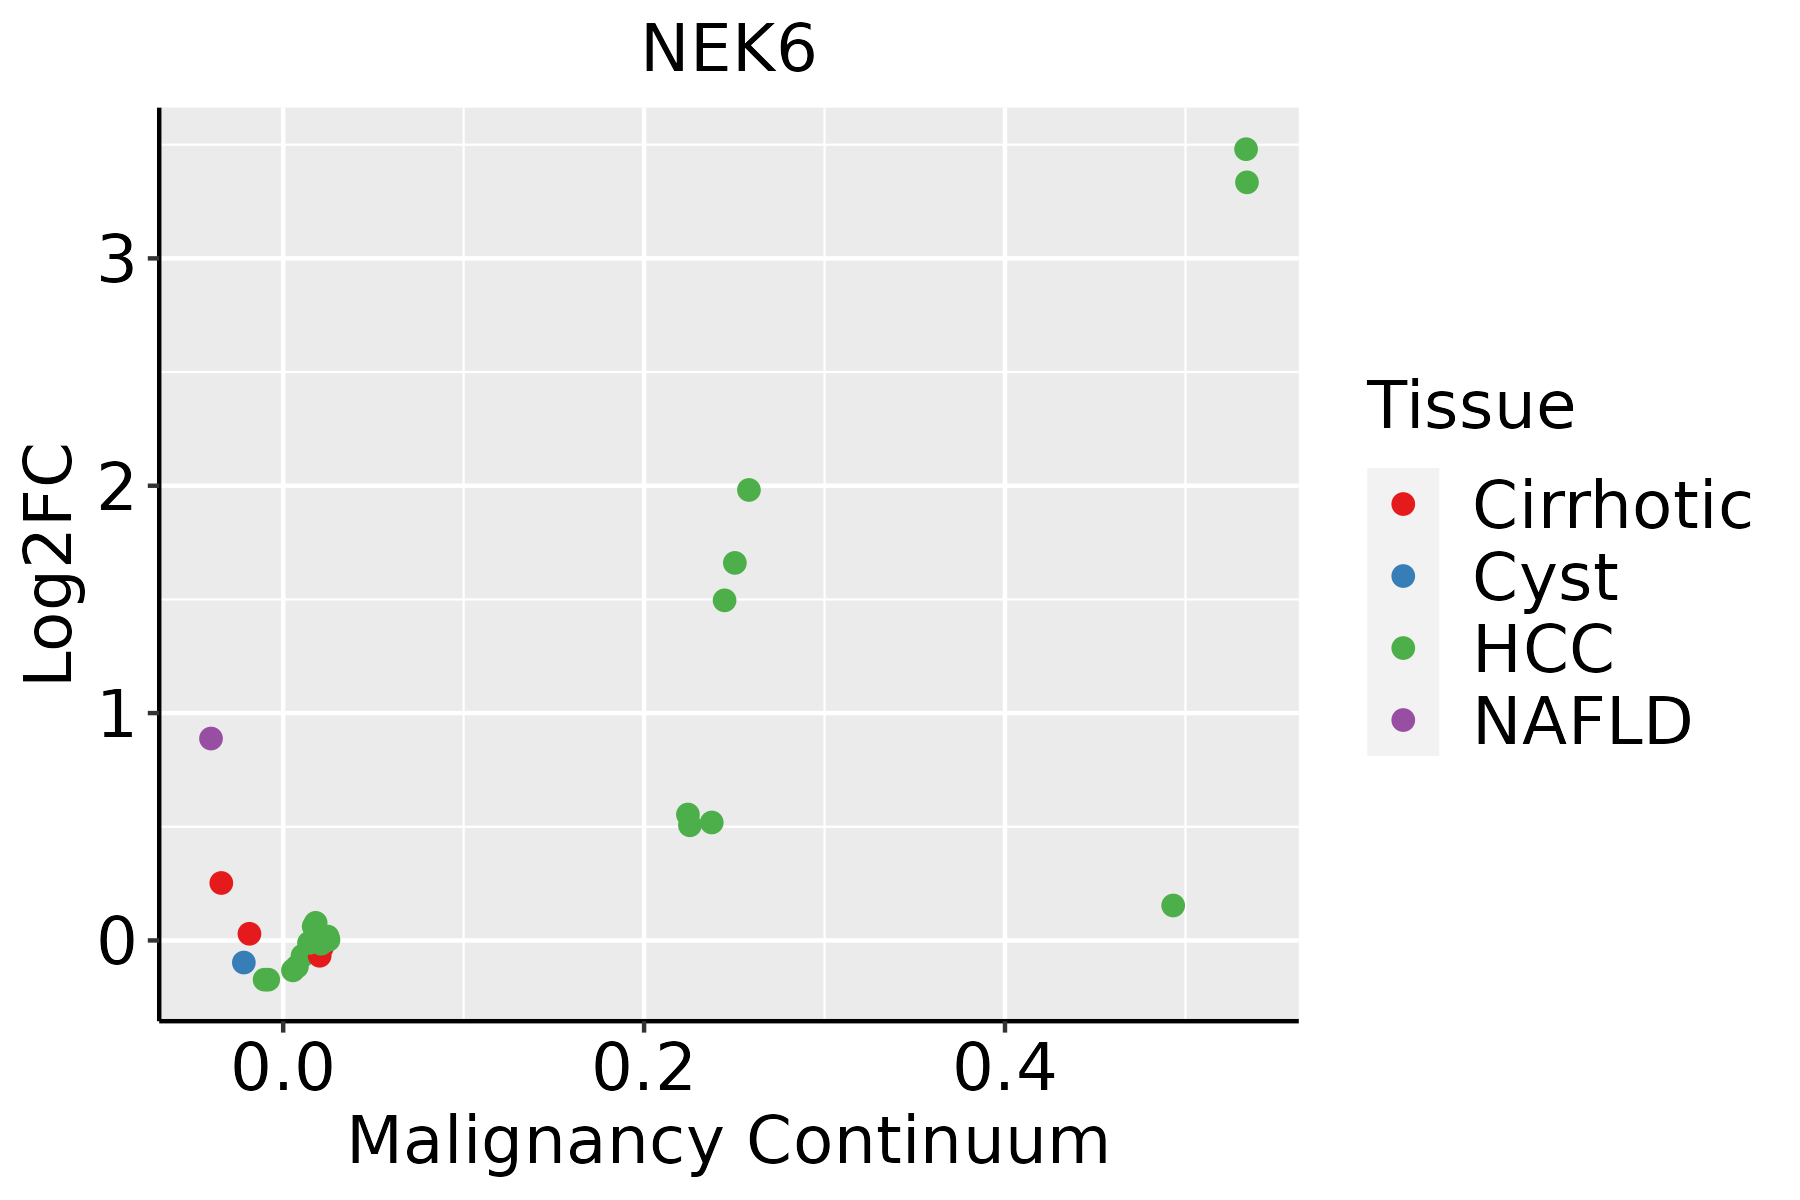
HCC: Hepatocellular carcinoma
NAFLD: Non-alcoholic fatty liver disease
LungThe image shows the transcriptomic changes along malignancy continuum.log2FC in expression of this searched gene in stem-like cells from each diseased tissue sample relative to stem-like cells in normal samples in each tissue plotted against the malignancy continuum. Samples are colored based on if they are from different disease stage.AAH: Atypical adenomatous hyperplasia
AIS: Adenocarcinoma in situ
IAC: Invasive lung adenocarcinoma
MIA: Minimally invasive adenocarcinoma
Oral CavityThe image shows the transcriptomic changes along malignancy continuum.log2FC in expression of this searched gene in stem-like cells from each diseased tissue sample relative to stem-like cells in normal samples in each tissue plotted against the malignancy continuum. Samples are colored based on if they are from different disease stage.
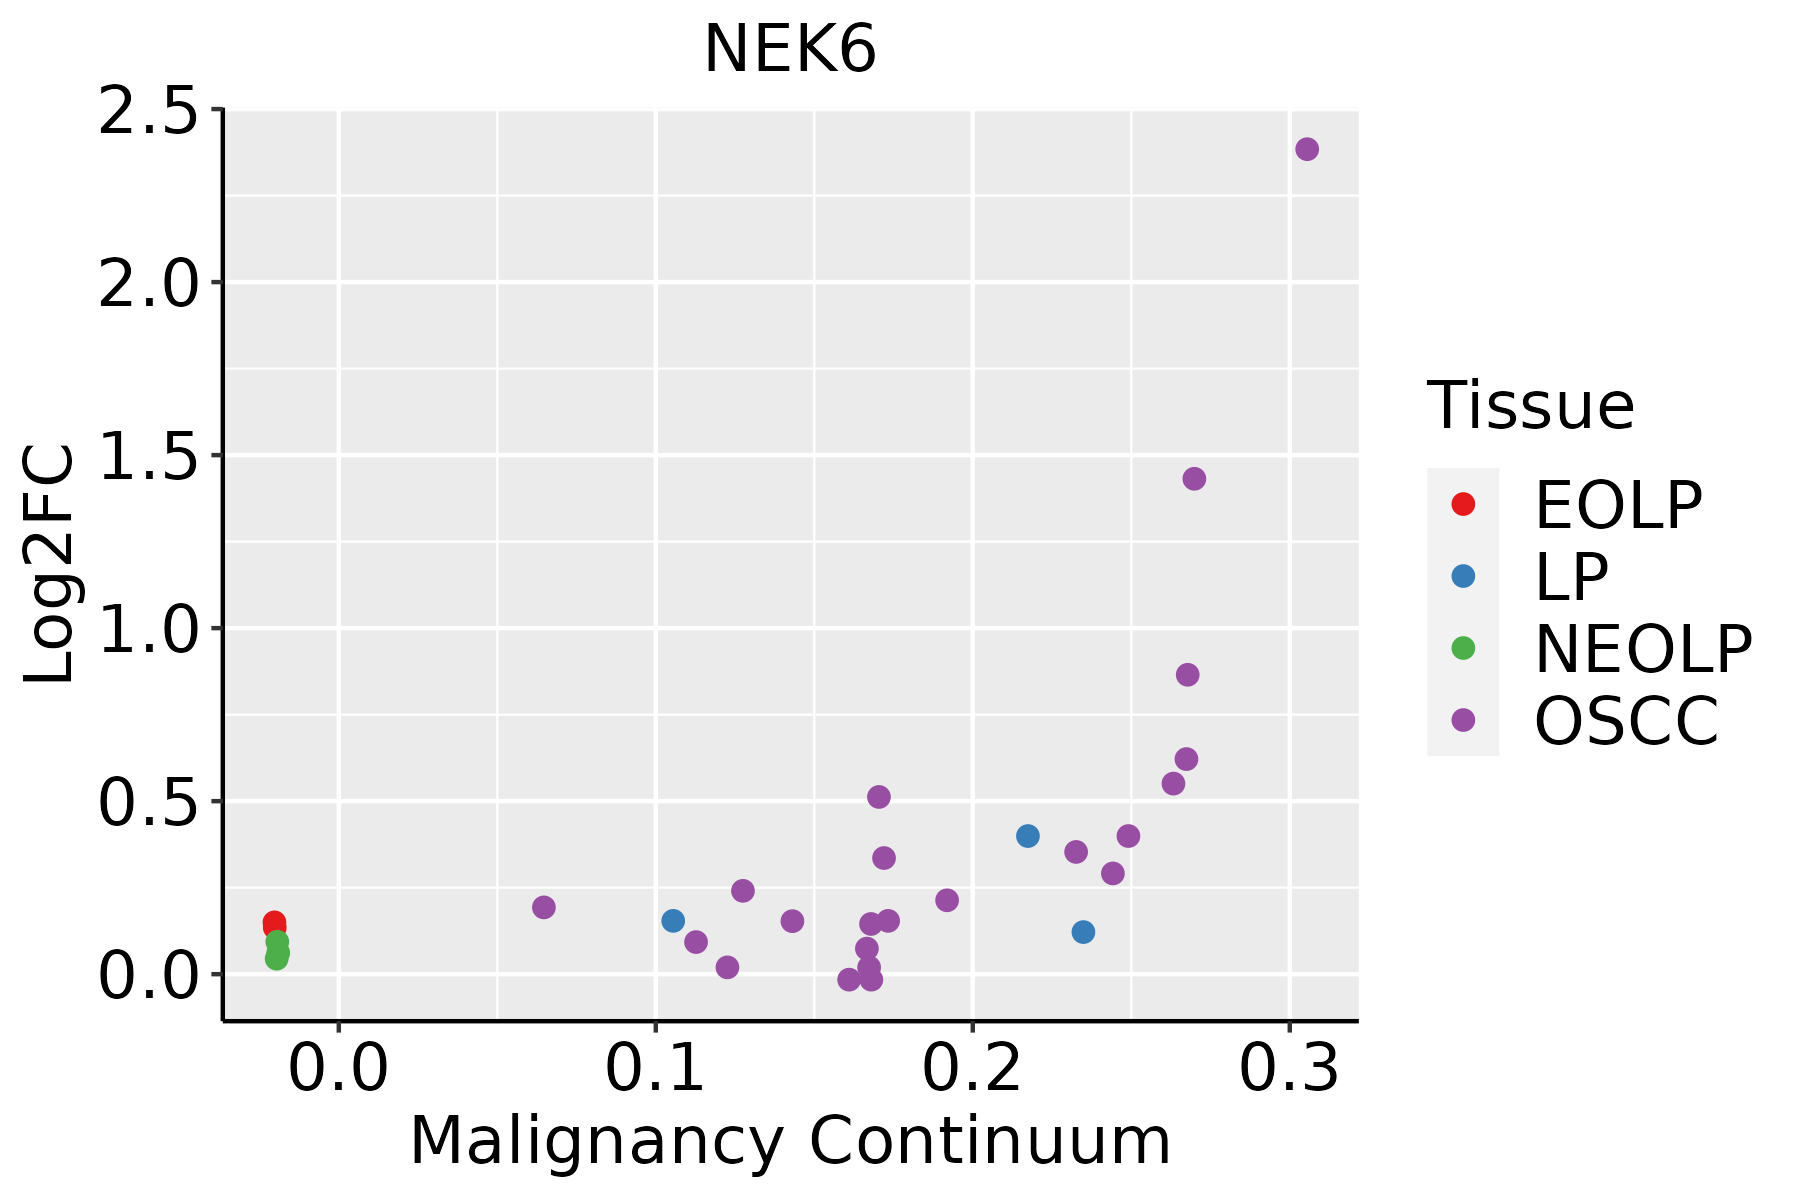
EOLP: Erosive Oral lichen planus
LP: leukoplakia
NEOLP: Non-erosive oral lichen planus
OSCC: Oral squamous cell carcinoma
ThyroidThe image shows the transcriptomic changes along malignancy continuum.log2FC in expression of this searched gene in stem-like cells from each diseased tissue sample relative to stem-like cells in normal samples in each tissue plotted against the malignancy continuum. Samples are colored based on if they are from different disease stage.
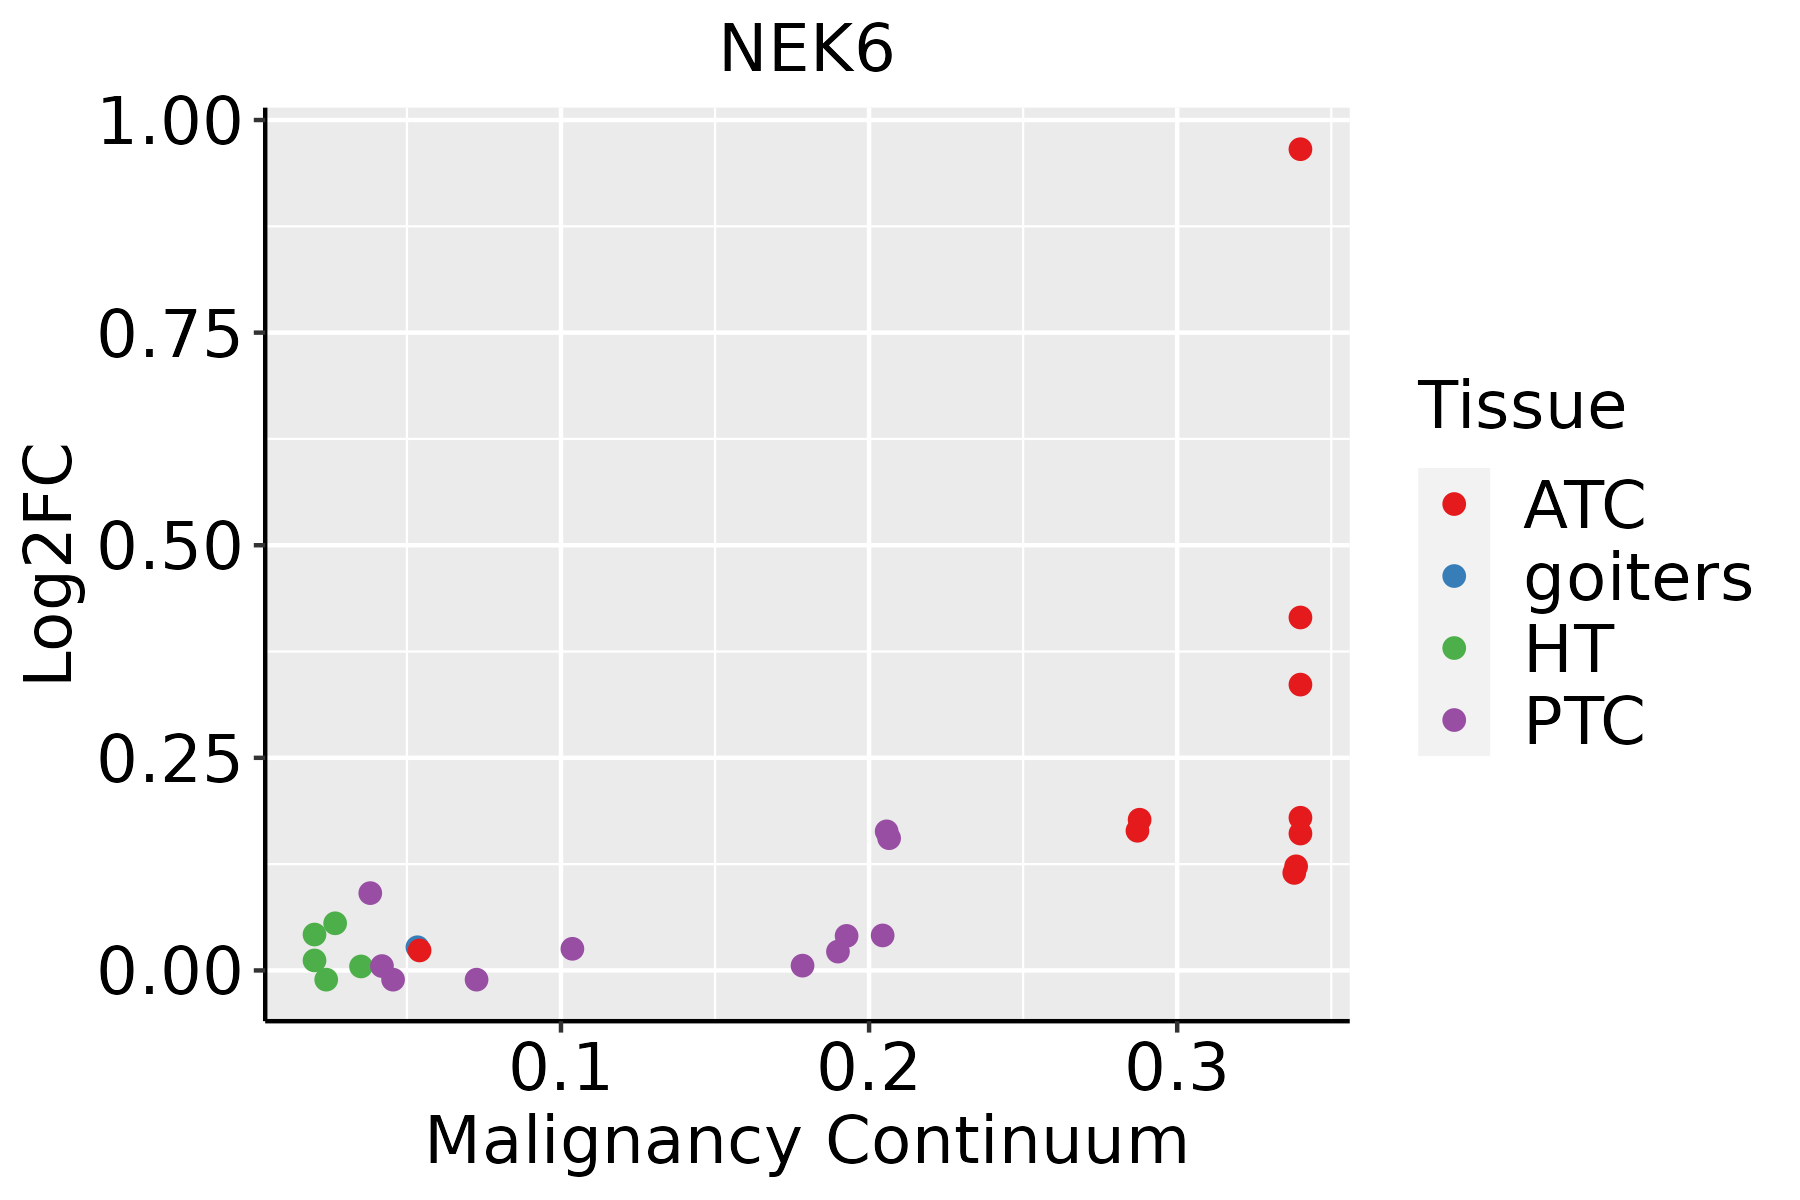
ATC: Anaplastic thyroid cancer
HT: Hashimoto's thyroiditis
PTC: Papillary thyroid cancer
∗log2FC in expression of this searched gene in stem-like cells from each diseased tissue sample relative to stem-like cells in normal samples in each tissue plotted against the malignancy continuum. Samples are colored based on if they are from different disease stage.

Top

Malignant transformation related pathway analysis

check buttonFind out the enriched GO biological processes and KEGG pathways involved in transition from healthy to precancer to cancer
check button Figure of enriched GO biological processes.
TissueDisease StageEnriched GO biological Processes
ColorectumADGO analysis - Figure of enriched GO biological processes: Top 15 enriched GO BP terms are showed in the bar plot of each disease state in each tissue. Each row represents a significant GO biological process which is colored according to the -log10(p.adjust).
ColorectumSERGO analysis - Figure of enriched GO biological processes: Top 15 enriched GO BP terms are showed in the bar plot of each disease state in each tissue. Each row represents a significant GO biological process which is colored according to the -log10(p.adjust).
ColorectumMSSGO analysis - Figure of enriched GO biological processes: Top 15 enriched GO BP terms are showed in the bar plot of each disease state in each tissue. Each row represents a significant GO biological process which is colored according to the -log10(p.adjust).
ColorectumMSI-HGO analysis - Figure of enriched GO biological processes: Top 15 enriched GO BP terms are showed in the bar plot of each disease state in each tissue. Each row represents a significant GO biological process which is colored according to the -log10(p.adjust).
ColorectumFAPGO analysis - Figure of enriched GO biological processes: Top 15 enriched GO BP terms are showed in the bar plot of each disease state in each tissue. Each row represents a significant GO biological process which is colored according to the -log10(p.adjust).
∗Top 15 enriched GO BP terms are showed in the bar plot of each disease state in each tissue. Each row represents a significant GO biological process which is colored according to the -log10(p.adjust).
Page: 1 2 3 4 5 6 7 8 9 

check button Enriched GO biological processes.
GO IDTissueDisease StageDescriptionGene RatioBg Ratiopvaluep.adjustCount
GO:014001414EsophagusESCCmitotic nuclear division218/8552287/187236.17e-261.78e-23218
GO:0022411111EsophagusESCCcellular component disassembly305/8552443/187231.94e-234.57e-21305
GO:000007011EsophagusESCCmitotic sister chromatid segregation138/8552168/187231.37e-222.63e-20138
GO:00008194EsophagusESCCsister chromatid segregation157/8552202/187238.41e-211.33e-18157
GO:003304416EsophagusESCCregulation of chromosome organization145/8552187/187233.80e-194.31e-17145
GO:000705911EsophagusESCCchromosome segregation238/8552346/187231.72e-181.82e-16238
GO:004477216EsophagusESCCmitotic cell cycle phase transition281/8552424/187234.63e-184.45e-16281
GO:190285015EsophagusESCCmicrotubule cytoskeleton organization involved in mitosis116/8552147/187231.25e-169.91e-15116
GO:000734615EsophagusESCCregulation of mitotic cell cycle293/8552457/187238.00e-165.64e-14293
GO:000705214EsophagusESCCmitotic spindle organization97/8552120/187232.17e-151.33e-1397
GO:000705114EsophagusESCCspindle organization134/8552184/187235.70e-142.87e-12134
GO:00482853EsophagusESCCorganelle fission301/8552488/187234.64e-132.12e-11301
GO:00988133EsophagusESCCnuclear chromosome segregation187/8552281/187231.00e-124.36e-11187
GO:004312318EsophagusESCCpositive regulation of I-kappaB kinase/NF-kappaB signaling132/8552186/187232.07e-128.58e-11132
GO:0043122110EsophagusESCCregulation of I-kappaB kinase/NF-kappaB signaling167/8552249/187236.11e-122.32e-10167
GO:00002802EsophagusESCCnuclear division270/8552439/187231.17e-114.24e-10270
GO:000724919EsophagusESCCI-kappaB kinase/NF-kappaB signaling183/8552281/187233.02e-111.01e-09183
GO:190198713EsophagusESCCregulation of cell cycle phase transition242/8552390/187233.86e-111.26e-09242
GO:190199013EsophagusESCCregulation of mitotic cell cycle phase transition191/8552299/187231.35e-103.94e-09191
GO:000699713EsophagusESCCnucleus organization96/8552133/187234.66e-101.21e-0896
Page: 1 2 3 4 5 6 7 8 9 10 11 12 13 14 

check button Enriched KEGG pathways.
Pathway IDTissueDisease StageDescriptionGene RatioBg Ratiopvaluep.adjustqvalueCount
Page: 1 

Top

Cell-cell communication analysis

check buttonIdentification of potential cell-cell interactions between two cell types and their ligand-receptor pairs for different disease states
LigandReceptorLRpairPathwayTissueDisease Stage
Page: 1 

Top

Single-cell gene regulatory network inference analysis

check buttonFind out the significant the regulons (TFs) and the target genes of each regulon across cell types for different disease states
TFCell TypeTissueDisease StageTarget GeneRSSRegulon Activity
∗The dot plots of a searched regulon are shown for all cell subpopulations in each disease state of each tissue based on the regulon specific score inferred using pySCENIC and by calculating the average expression.
Page: 1 

Top

Somatic mutation of malignant transformation related genes

check buttonAnnotation of somatic variants for genes involved in malignant transformation
Hugo SymbolVariant ClassVariant ClassificationdbSNP RSHGVScHGVSpHGVSp ShortSWISSPROTBIOTYPESIFTPolyPhenTumor Sample BarcodeTissueHistologySexAgeStageTherapy TypesDrugsOutcome
NEK6SNVMissense_Mutationc.469N>Cp.Glu157Glnp.E157QQ9HC98protein_codingdeleterious(0.01)probably_damaging(0.997)TCGA-AC-A23H-01Breastbreast invasive carcinomaFemale>=65I/IIUnknownUnknownPD
NEK6SNVMissense_Mutationnovelc.686N>Ap.Arg229Hisp.R229HQ9HC98protein_codingdeleterious(0)probably_damaging(0.996)TCGA-BH-A18L-01Breastbreast invasive carcinomaFemale<65III/IVUnknownUnknownSD
NEK6SNVMissense_Mutationc.808N>Gp.Leu270Valp.L270VQ9HC98protein_codingtolerated(0.11)possibly_damaging(0.664)TCGA-D8-A27G-01Breastbreast invasive carcinomaFemale>=65I/IIUnknownUnknownSD
NEK6insertionFrame_Shift_Insnovelc.607_608insCTGATGCCCGTTGGAACp.Met203ThrfsTer24p.M203Tfs*24Q9HC98protein_codingTCGA-A8-A08H-01Breastbreast invasive carcinomaFemale>=65I/IIUnknownUnknownSD
NEK6SNVMissense_Mutationrs879292381c.577N>Ap.Ala193Thrp.A193TQ9HC98protein_codingdeleterious(0)probably_damaging(0.989)TCGA-2W-A8YY-01Cervixcervical & endocervical cancerFemale<65I/IIChemotherapycisplatinCR
NEK6SNVMissense_Mutationc.341N>Tp.Glu114Valp.E114VQ9HC98protein_codingdeleterious(0.01)possibly_damaging(0.886)TCGA-C5-A1MI-01Cervixcervical & endocervical cancerFemale<65I/IIChemotherapycisplatinPD
NEK6SNVMissense_Mutationrs750746819c.217N>Tp.Arg73Cysp.R73CQ9HC98protein_codingtolerated_low_confidence(0.11)benign(0.006)TCGA-MA-AA3W-01Cervixcervical & endocervical cancerFemale<65I/IIChemotherapycisplatinCR
NEK6SNVMissense_Mutationc.959N>Cp.Ile320Thrp.I320TQ9HC98protein_codingdeleterious(0)probably_damaging(0.972)TCGA-AA-3811-01Colorectumcolon adenocarcinomaFemale>=65III/IVUnknownUnknownPD
NEK6SNVMissense_Mutationc.661N>Cp.Lys221Glnp.K221QQ9HC98protein_codingdeleterious(0.03)probably_damaging(0.999)TCGA-AA-3966-01Colorectumcolon adenocarcinomaFemale>=65I/IIUnknownUnknownSD
NEK6SNVMissense_Mutationrs183673274c.230N>Tp.Ala77Valp.A77VQ9HC98protein_codingtolerated(0.1)benign(0.051)TCGA-AD-A5EJ-01Colorectumcolon adenocarcinomaFemale>=65I/IIUnknownUnknownSD
Page: 1 2 3 

Top

Related drugs of malignant transformation related genes

check buttonIdentification of chemicals and drugs interact with genes involved in malignant transfromation
(DGIdb 4.0)
Entrez IDSymbolCategoryInteraction TypesDrug Claim NameDrug NamePMIDs
10783NEK6DRUGGABLE GENOME, KINASE, ENZYME, SERINE THREONINE KINASEinhibitor249565885
Page: 1