| Tissue | Expression Dynamics | Abbreviation |
| Cervix |  | CC: Cervix cancer |
| HSIL_HPV: HPV-infected high-grade squamous intraepithelial lesions |
| N_HPV: HPV-infected normal cervix |
| Colorectum (GSE201348) |  | FAP: Familial adenomatous polyposis |
| CRC: Colorectal cancer |
| Colorectum (HTA11) |  | AD: Adenomas |
| SER: Sessile serrated lesions |
| MSI-H: Microsatellite-high colorectal cancer |
| MSS: Microsatellite stable colorectal cancer |
| Endometrium | 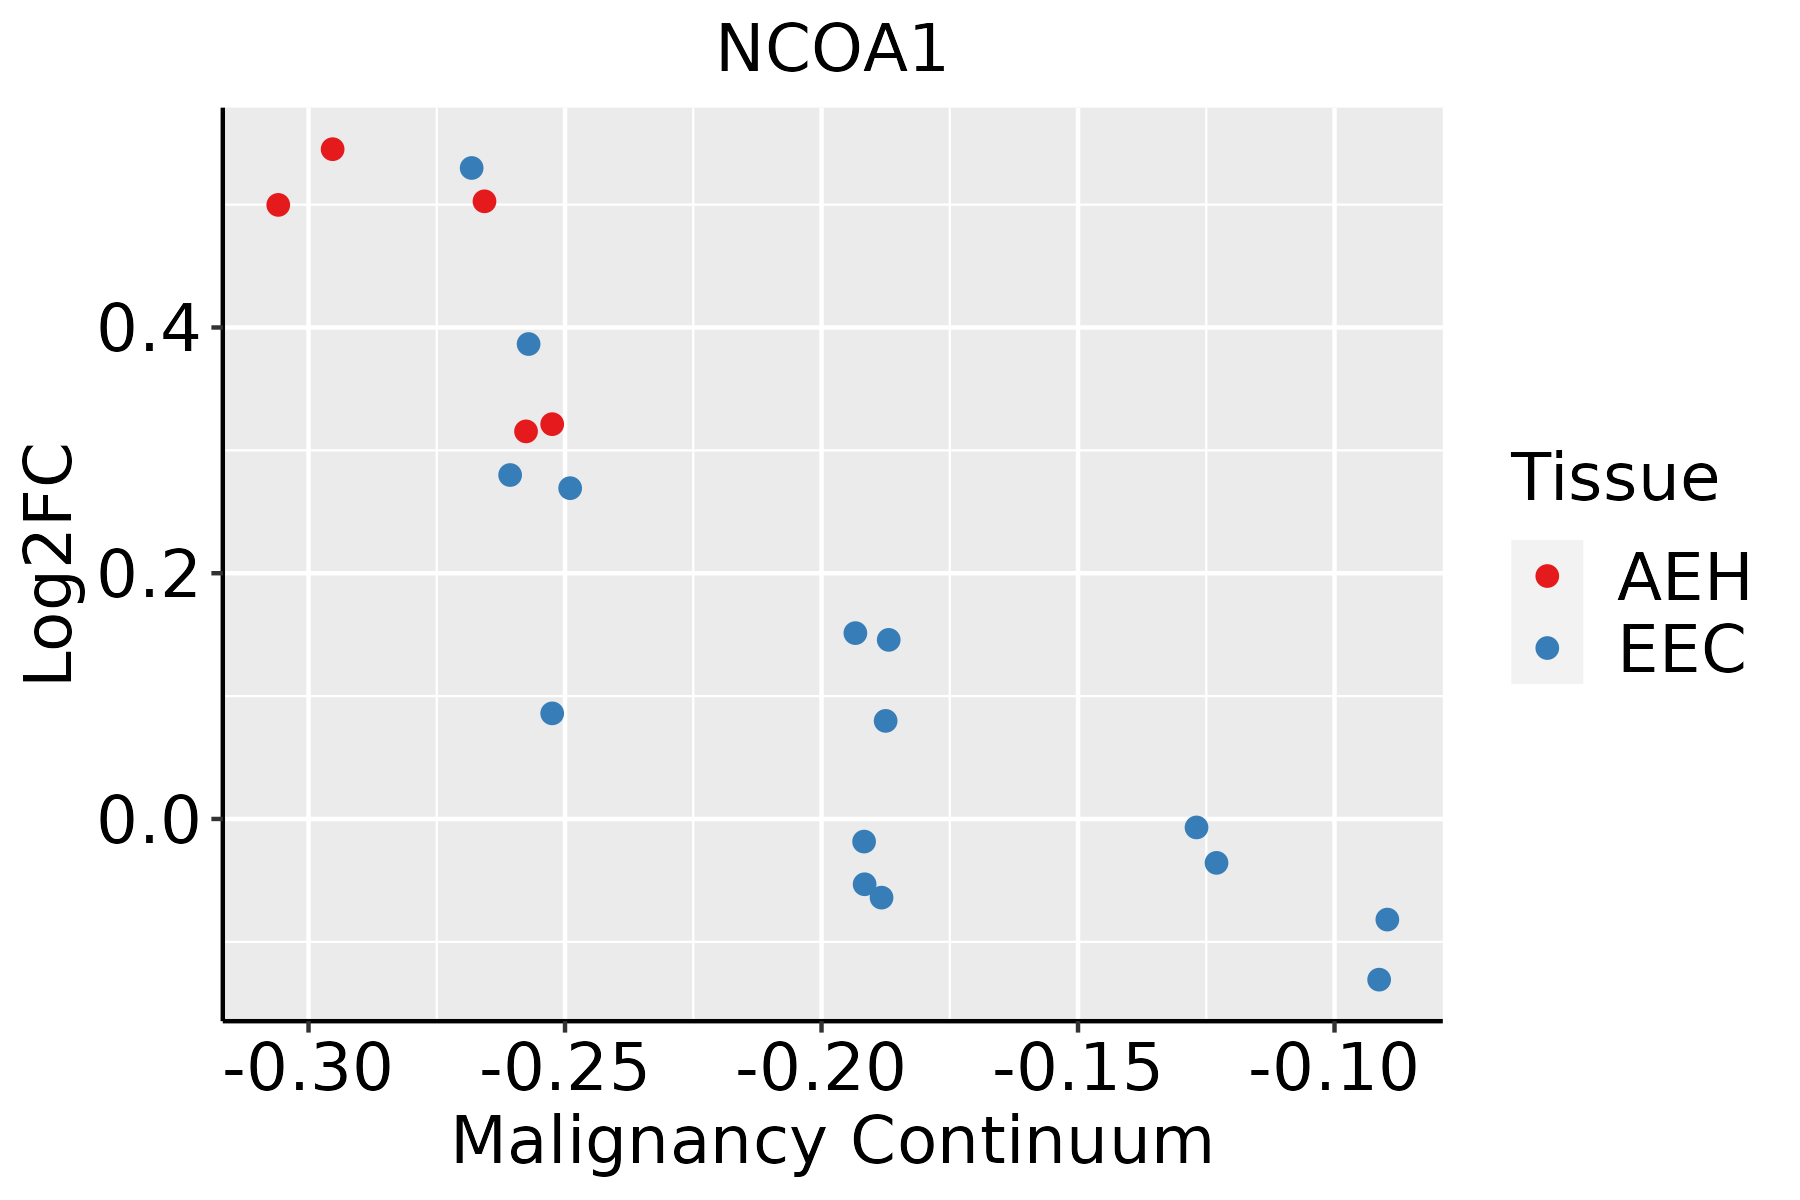 | AEH: Atypical endometrial hyperplasia |
| EEC: Endometrioid Cancer |
| Esophagus | 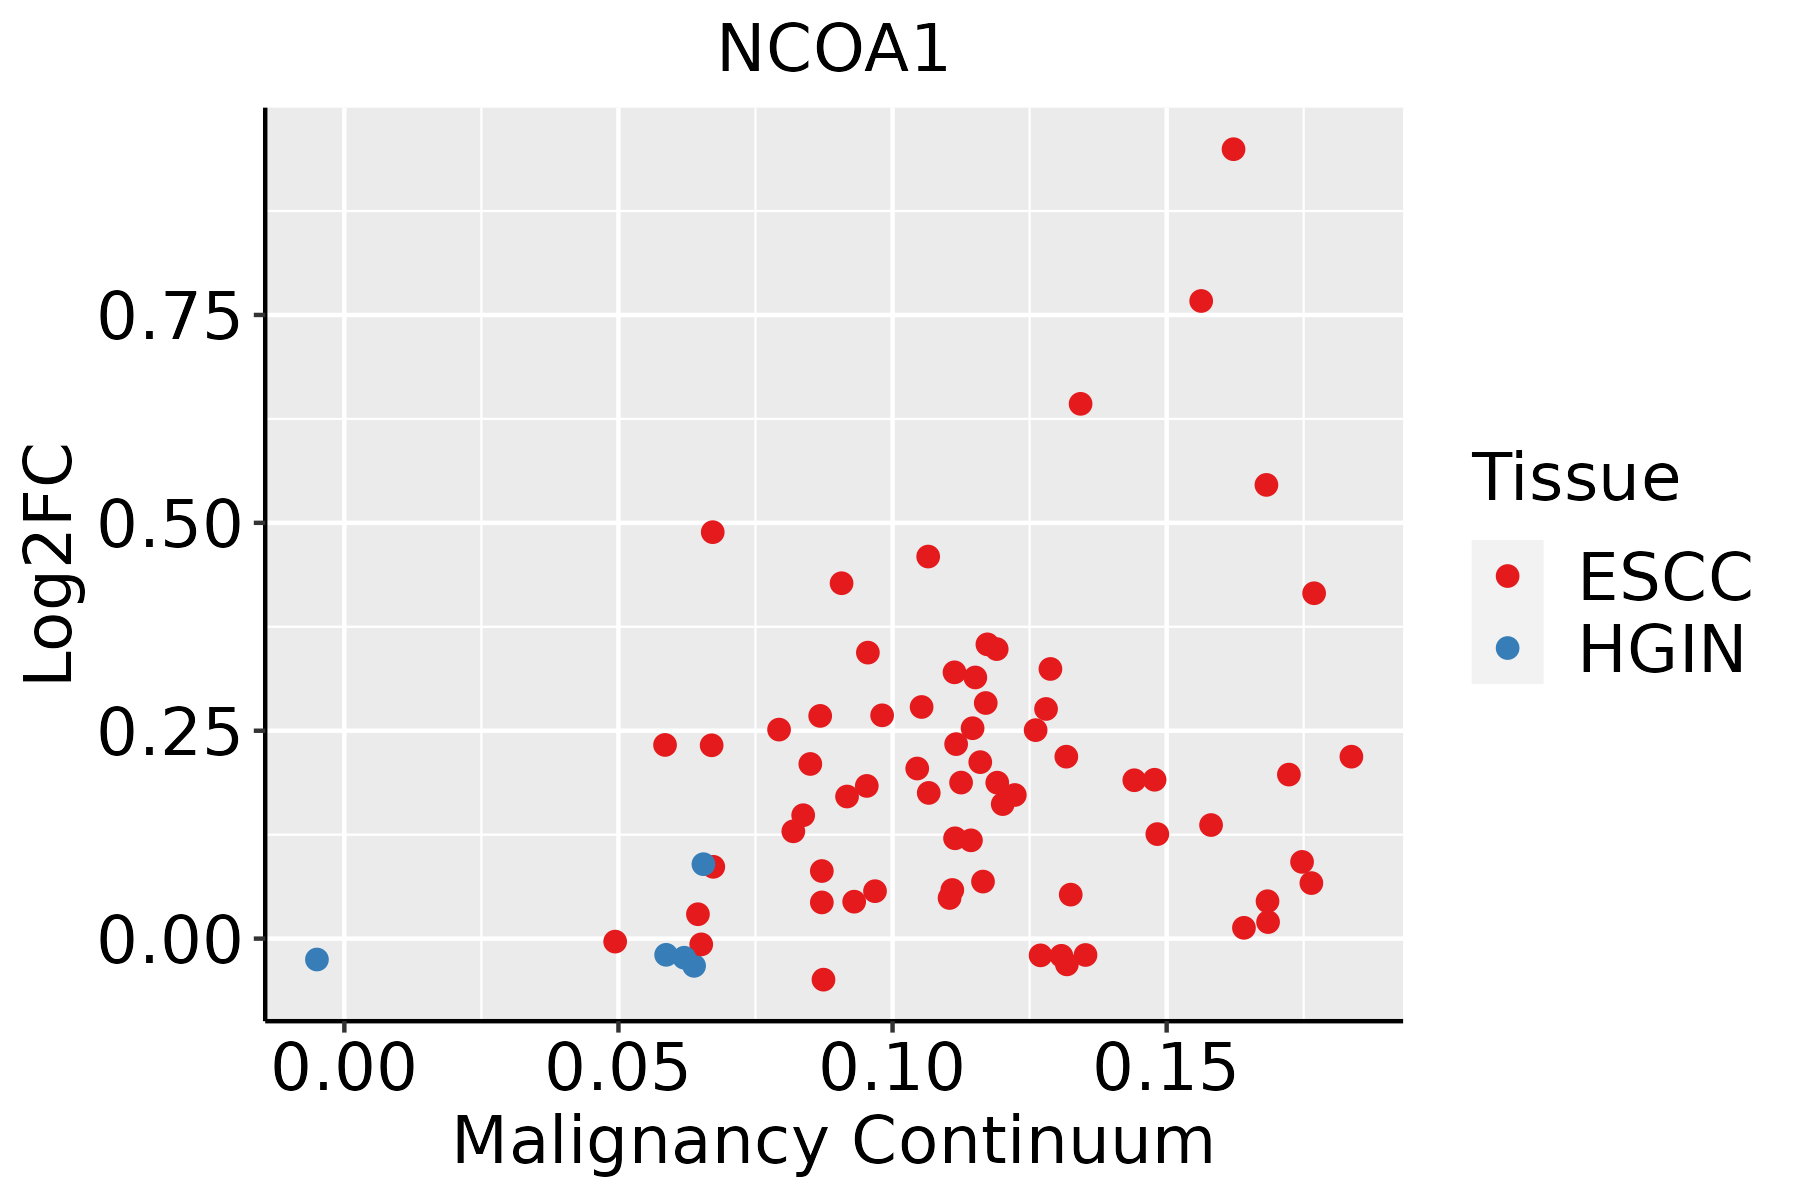 | ESCC: Esophageal squamous cell carcinoma |
| HGIN: High-grade intraepithelial neoplasias |
| LGIN: Low-grade intraepithelial neoplasias |
| Liver | 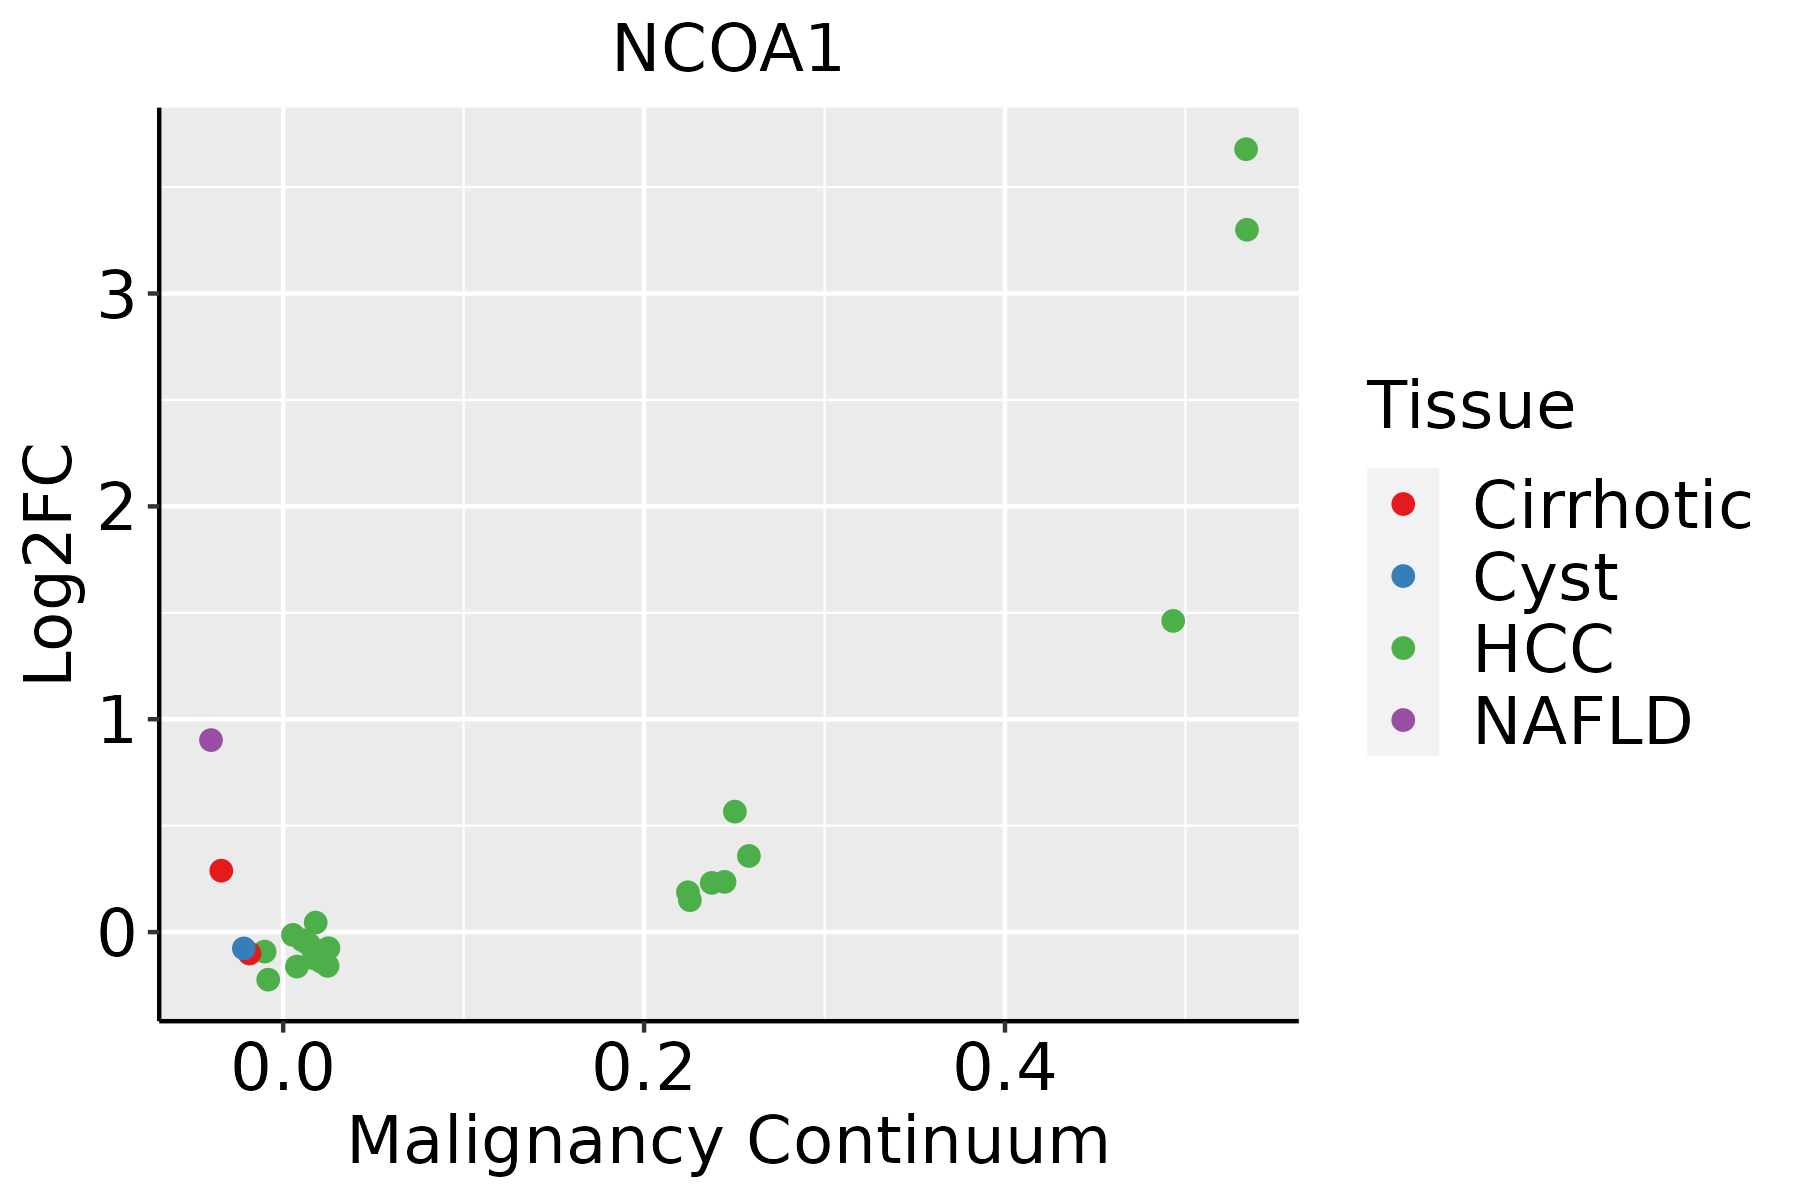 | HCC: Hepatocellular carcinoma |
| NAFLD: Non-alcoholic fatty liver disease |
| Lung |  | AAH: Atypical adenomatous hyperplasia |
| AIS: Adenocarcinoma in situ |
| IAC: Invasive lung adenocarcinoma |
| MIA: Minimally invasive adenocarcinoma |
| Oral Cavity | 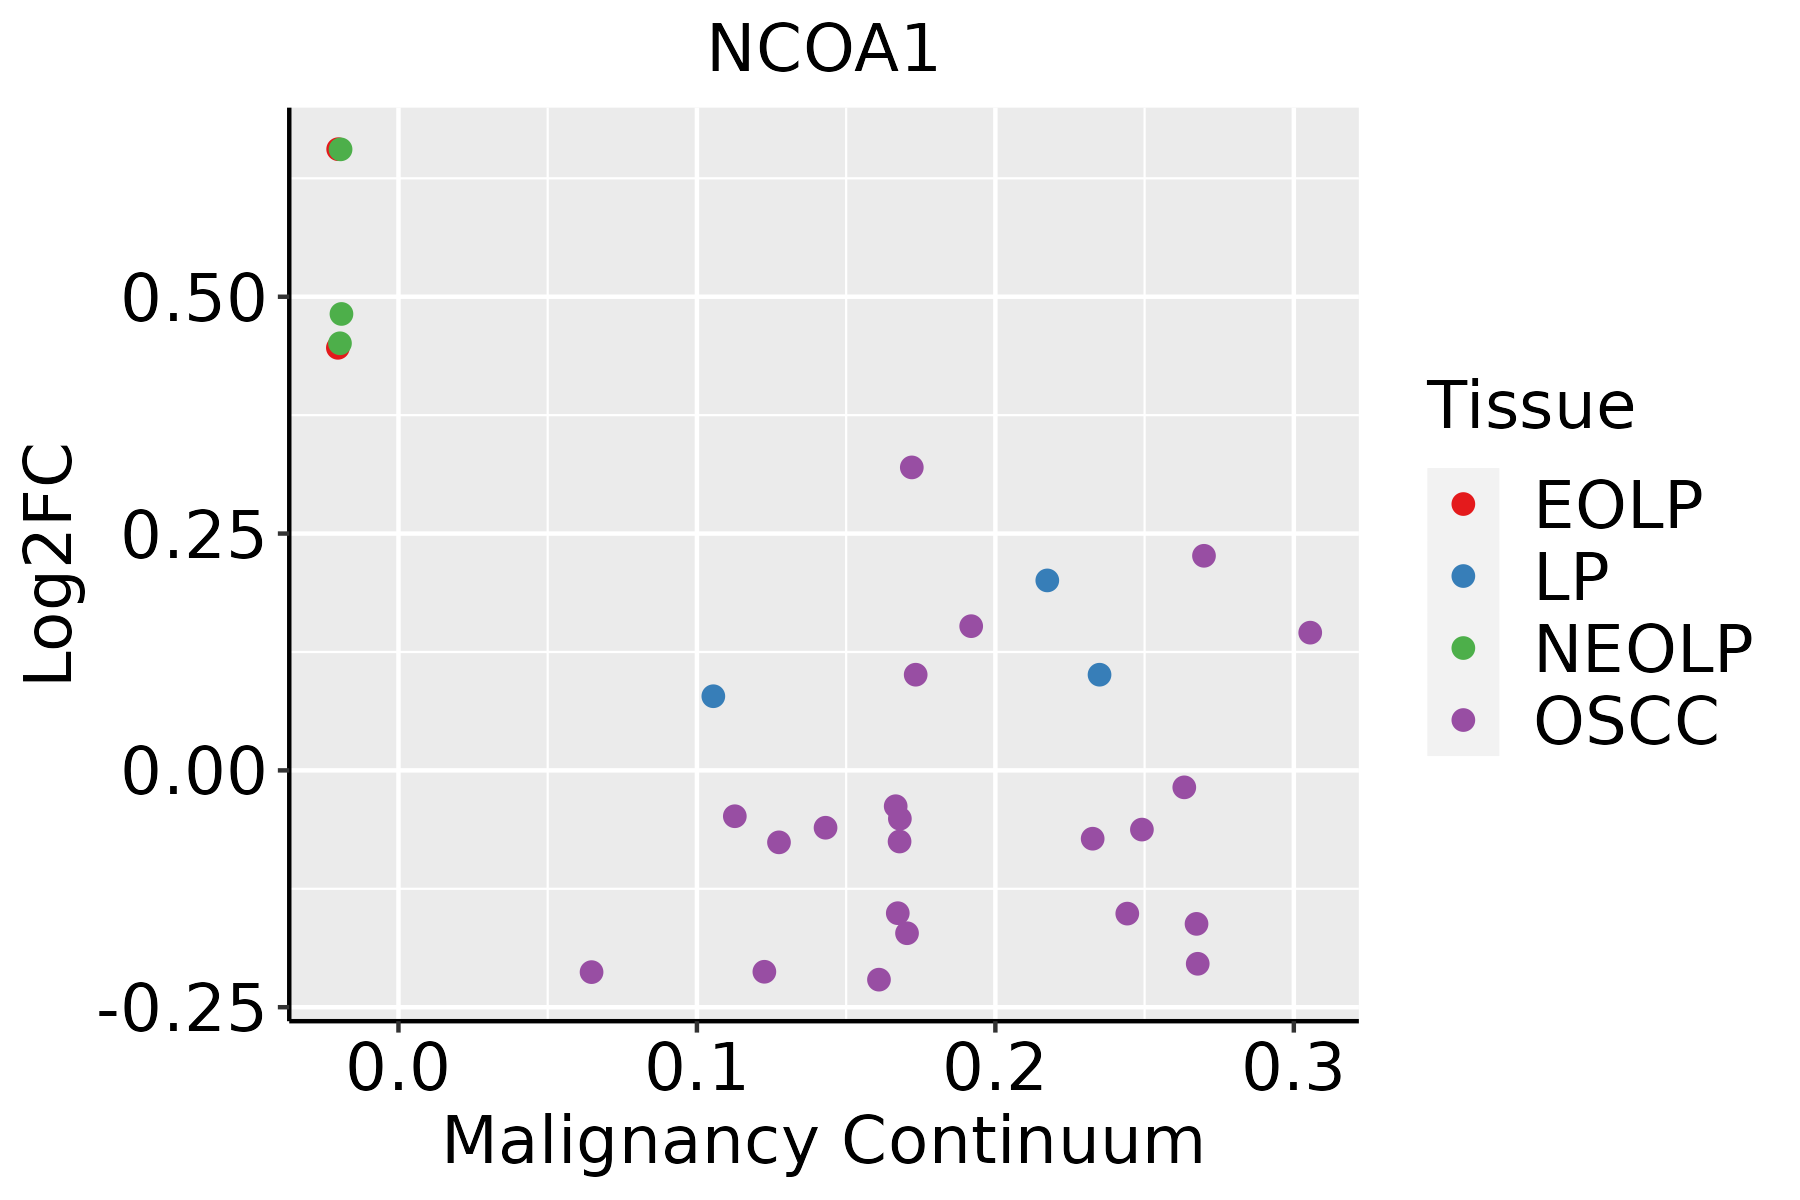 | EOLP: Erosive Oral lichen planus |
| LP: leukoplakia |
| NEOLP: Non-erosive oral lichen planus |
| OSCC: Oral squamous cell carcinoma |
| Prostate |  | BPH: Benign Prostatic Hyperplasia |
| Skin | 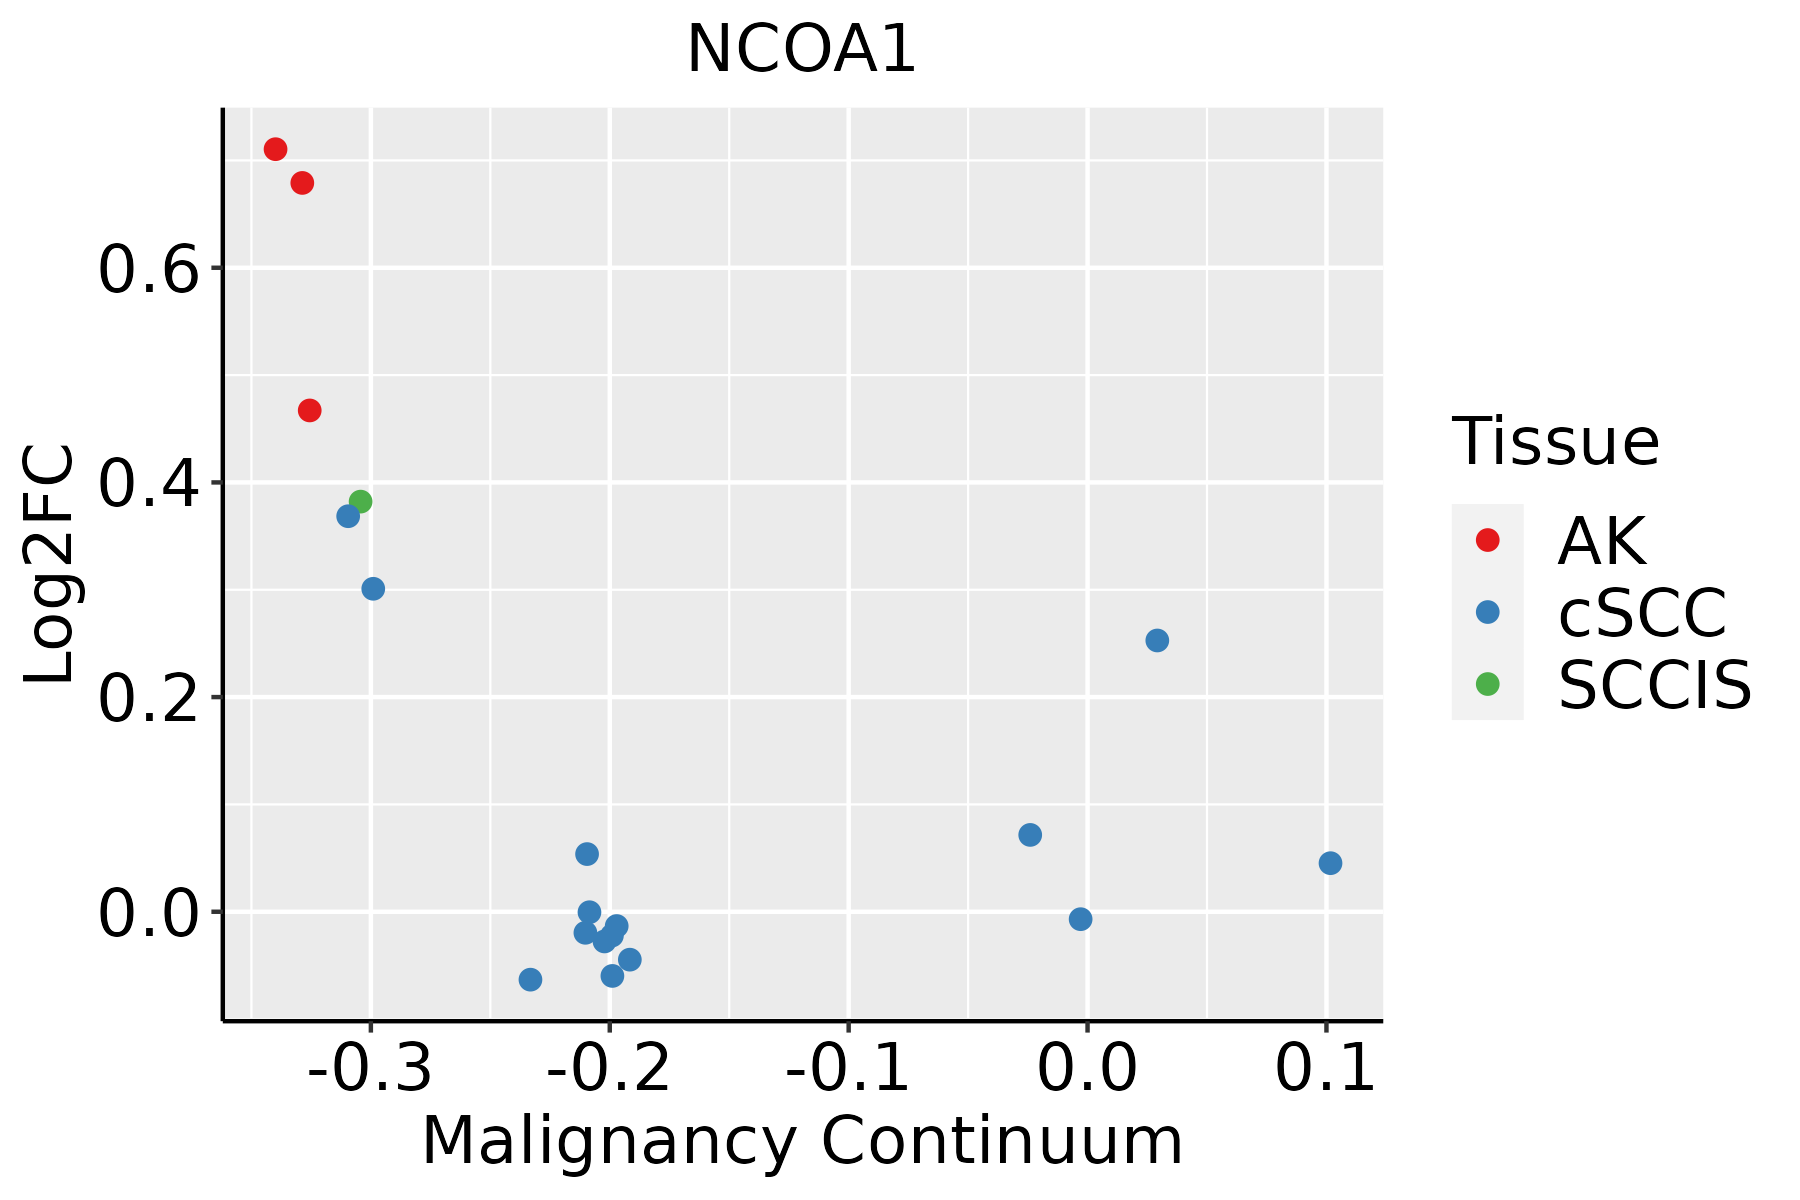 | AK: Actinic keratosis |
| cSCC: Cutaneous squamous cell carcinoma |
| SCCIS:squamous cell carcinoma in situ |
| Thyroid | 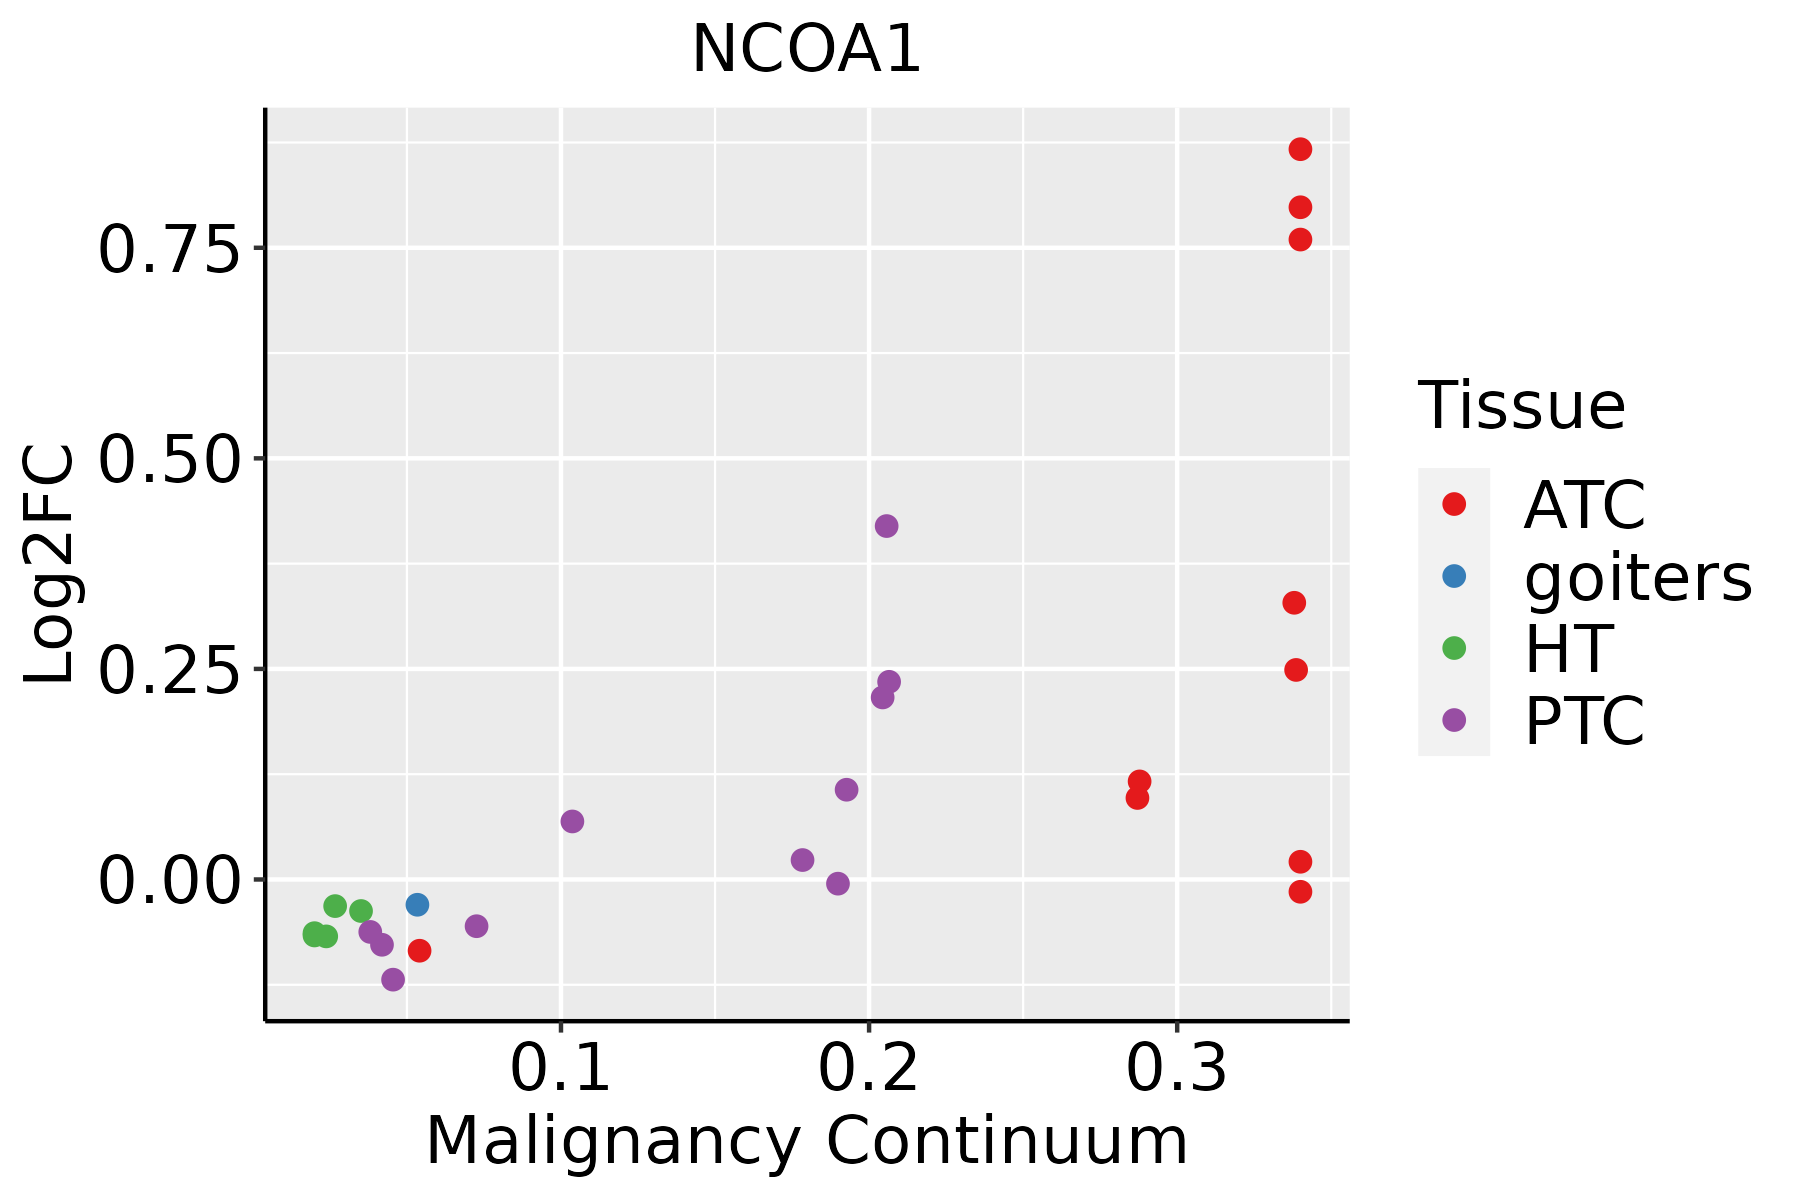 | ATC: Anaplastic thyroid cancer |
| HT: Hashimoto's thyroiditis |
| PTC: Papillary thyroid cancer |
| GO ID | Tissue | Disease Stage | Description | Gene Ratio | Bg Ratio | pvalue | p.adjust | Count |
| GO:007149610 | Cervix | CC | cellular response to external stimulus | 78/2311 | 320/18723 | 1.82e-09 | 1.98e-07 | 78 |
| GO:00316689 | Cervix | CC | cellular response to extracellular stimulus | 59/2311 | 246/18723 | 3.03e-07 | 1.24e-05 | 59 |
| GO:00018908 | Cervix | CC | placenta development | 40/2311 | 144/18723 | 4.59e-07 | 1.77e-05 | 40 |
| GO:004854510 | Cervix | CC | response to steroid hormone | 74/2311 | 339/18723 | 5.71e-07 | 2.09e-05 | 74 |
| GO:00614588 | Cervix | CC | reproductive system development | 87/2311 | 427/18723 | 1.37e-06 | 4.55e-05 | 87 |
| GO:00305229 | Cervix | CC | intracellular receptor signaling pathway | 60/2311 | 265/18723 | 1.89e-06 | 5.97e-05 | 60 |
| GO:00486088 | Cervix | CC | reproductive structure development | 86/2311 | 424/18723 | 1.90e-06 | 5.97e-05 | 86 |
| GO:00485118 | Cervix | CC | rhythmic process | 65/2311 | 298/18723 | 2.79e-06 | 8.04e-05 | 65 |
| GO:005087810 | Cervix | CC | regulation of body fluid levels | 78/2311 | 379/18723 | 3.20e-06 | 8.77e-05 | 78 |
| GO:003166710 | Cervix | CC | response to nutrient levels | 92/2311 | 474/18723 | 5.80e-06 | 1.42e-04 | 92 |
| GO:00316698 | Cervix | CC | cellular response to nutrient levels | 49/2311 | 215/18723 | 1.32e-05 | 2.68e-04 | 49 |
| GO:190165410 | Cervix | CC | response to ketone | 45/2311 | 194/18723 | 1.83e-05 | 3.44e-04 | 45 |
| GO:004873210 | Cervix | CC | gland development | 84/2311 | 436/18723 | 1.93e-05 | 3.54e-04 | 84 |
| GO:00017018 | Cervix | CC | in utero embryonic development | 71/2311 | 367/18723 | 7.21e-05 | 1.00e-03 | 71 |
| GO:00323556 | Cervix | CC | response to estradiol | 34/2311 | 141/18723 | 8.19e-05 | 1.11e-03 | 34 |
| GO:00165705 | Cervix | CC | histone modification | 84/2311 | 463/18723 | 1.70e-04 | 2.01e-03 | 84 |
| GO:00018928 | Cervix | CC | embryonic placenta development | 22/2311 | 82/18723 | 2.89e-04 | 3.12e-03 | 22 |
| GO:00325704 | Cervix | CC | response to progesterone | 13/2311 | 37/18723 | 2.99e-04 | 3.21e-03 | 13 |
| GO:00448492 | Cervix | CC | estrous cycle | 7/2311 | 16/18723 | 1.79e-03 | 1.34e-02 | 7 |
| GO:00094109 | Cervix | CC | response to xenobiotic stimulus | 78/2311 | 462/18723 | 2.39e-03 | 1.70e-02 | 78 |
| Pathway ID | Tissue | Disease Stage | Description | Gene Ratio | Bg Ratio | pvalue | p.adjust | qvalue | Count |
| hsa0491520 | Cervix | CC | Estrogen signaling pathway | 44/1267 | 138/8465 | 3.55e-07 | 3.97e-06 | 2.35e-06 | 44 |
| hsa0491918 | Cervix | CC | Thyroid hormone signaling pathway | 33/1267 | 121/8465 | 3.11e-04 | 1.65e-03 | 9.78e-04 | 33 |
| hsa05224 | Cervix | CC | Breast cancer | 32/1267 | 147/8465 | 1.66e-02 | 4.88e-02 | 2.88e-02 | 32 |
| hsa04915110 | Cervix | CC | Estrogen signaling pathway | 44/1267 | 138/8465 | 3.55e-07 | 3.97e-06 | 2.35e-06 | 44 |
| hsa0491919 | Cervix | CC | Thyroid hormone signaling pathway | 33/1267 | 121/8465 | 3.11e-04 | 1.65e-03 | 9.78e-04 | 33 |
| hsa052241 | Cervix | CC | Breast cancer | 32/1267 | 147/8465 | 1.66e-02 | 4.88e-02 | 2.88e-02 | 32 |
| hsa04919 | Colorectum | AD | Thyroid hormone signaling pathway | 51/2092 | 121/8465 | 1.71e-05 | 1.73e-04 | 1.10e-04 | 51 |
| hsa049191 | Colorectum | AD | Thyroid hormone signaling pathway | 51/2092 | 121/8465 | 1.71e-05 | 1.73e-04 | 1.10e-04 | 51 |
| hsa049192 | Colorectum | SER | Thyroid hormone signaling pathway | 40/1580 | 121/8465 | 1.02e-04 | 1.06e-03 | 7.67e-04 | 40 |
| hsa04915 | Colorectum | SER | Estrogen signaling pathway | 38/1580 | 138/8465 | 6.51e-03 | 3.68e-02 | 2.67e-02 | 38 |
| hsa049193 | Colorectum | SER | Thyroid hormone signaling pathway | 40/1580 | 121/8465 | 1.02e-04 | 1.06e-03 | 7.67e-04 | 40 |
| hsa049151 | Colorectum | SER | Estrogen signaling pathway | 38/1580 | 138/8465 | 6.51e-03 | 3.68e-02 | 2.67e-02 | 38 |
| hsa049194 | Colorectum | MSS | Thyroid hormone signaling pathway | 46/1875 | 121/8465 | 5.04e-05 | 4.97e-04 | 3.05e-04 | 46 |
| hsa049152 | Colorectum | MSS | Estrogen signaling pathway | 48/1875 | 138/8465 | 4.23e-04 | 3.08e-03 | 1.89e-03 | 48 |
| hsa049195 | Colorectum | MSS | Thyroid hormone signaling pathway | 46/1875 | 121/8465 | 5.04e-05 | 4.97e-04 | 3.05e-04 | 46 |
| hsa049153 | Colorectum | MSS | Estrogen signaling pathway | 48/1875 | 138/8465 | 4.23e-04 | 3.08e-03 | 1.89e-03 | 48 |
| hsa049196 | Colorectum | MSI-H | Thyroid hormone signaling pathway | 21/797 | 121/8465 | 4.18e-03 | 4.10e-02 | 3.44e-02 | 21 |
| hsa049197 | Colorectum | MSI-H | Thyroid hormone signaling pathway | 21/797 | 121/8465 | 4.18e-03 | 4.10e-02 | 3.44e-02 | 21 |
| hsa049198 | Colorectum | FAP | Thyroid hormone signaling pathway | 41/1404 | 121/8465 | 2.28e-06 | 4.28e-05 | 2.60e-05 | 41 |
| hsa049199 | Colorectum | FAP | Thyroid hormone signaling pathway | 41/1404 | 121/8465 | 2.28e-06 | 4.28e-05 | 2.60e-05 | 41 |
| Hugo Symbol | Variant Class | Variant Classification | dbSNP RS | HGVSc | HGVSp | HGVSp Short | SWISSPROT | BIOTYPE | SIFT | PolyPhen | Tumor Sample Barcode | Tissue | Histology | Sex | Age | Stage | Therapy Types | Drugs | Outcome |
| NCOA1 | SNV | Missense_Mutation | | c.2923N>A | p.Pro975Thr | p.P975T | Q15788 | protein_coding | tolerated(0.06) | possibly_damaging(0.766) | TCGA-A2-A0YJ-01 | Breast | breast invasive carcinoma | Female | <65 | III/IV | Chemotherapy | cytoxan | PD |
| NCOA1 | SNV | Missense_Mutation | novel | c.3535N>C | p.Thr1179Pro | p.T1179P | Q15788 | protein_coding | tolerated(0.2) | benign(0.269) | TCGA-A2-A1FW-01 | Breast | breast invasive carcinoma | Female | <65 | III/IV | Chemotherapy | cytoxan | SD |
| NCOA1 | SNV | Missense_Mutation | | c.258N>C | p.Glu86Asp | p.E86D | Q15788 | protein_coding | tolerated(0.43) | benign(0.105) | TCGA-AC-A23H-01 | Breast | breast invasive carcinoma | Female | >=65 | I/II | Unknown | Unknown | PD |
| NCOA1 | SNV | Missense_Mutation | novel | c.1729N>A | p.Pro577Thr | p.P577T | Q15788 | protein_coding | tolerated(0.08) | probably_damaging(0.941) | TCGA-AN-A03X-01 | Breast | breast invasive carcinoma | Female | >=65 | I/II | Unknown | Unknown | SD |
| NCOA1 | SNV | Missense_Mutation | | c.483N>A | p.His161Gln | p.H161Q | Q15788 | protein_coding | deleterious(0) | probably_damaging(1) | TCGA-AN-A0XO-01 | Breast | breast invasive carcinoma | Female | <65 | III/IV | Unknown | Unknown | SD |
| NCOA1 | SNV | Missense_Mutation | novel | c.1256A>C | p.Asn419Thr | p.N419T | Q15788 | protein_coding | tolerated(0.14) | benign(0.201) | TCGA-B6-A0I5-01 | Breast | breast invasive carcinoma | Female | <65 | I/II | Unknown | Unknown | SD |
| NCOA1 | SNV | Missense_Mutation | | c.4321G>A | p.Glu1441Lys | p.E1441K | Q15788 | protein_coding | deleterious_low_confidence(0) | probably_damaging(0.978) | TCGA-C8-A27B-01 | Breast | breast invasive carcinoma | Female | <65 | I/II | Chemotherapy | 5-fluorouracil | CR |
| NCOA1 | SNV | Missense_Mutation | | c.3938N>G | p.Asn1313Ser | p.N1313S | Q15788 | protein_coding | tolerated(0.2) | possibly_damaging(0.86) | TCGA-D8-A1XK-01 | Breast | breast invasive carcinoma | Female | <65 | I/II | Chemotherapy | doxorubicine+cyclophosphamide | SD |
| NCOA1 | SNV | Missense_Mutation | novel | c.2646N>T | p.Gln882His | p.Q882H | Q15788 | protein_coding | deleterious(0.05) | possibly_damaging(0.601) | TCGA-OL-A5D8-01 | Breast | breast invasive carcinoma | Female | <65 | I/II | Unknown | Unknown | SD |
| NCOA1 | insertion | Nonsense_Mutation | novel | c.1730_1731insTTAAATTATTTGTATTAGGGAGACAAGGGAAG | p.Ala578Ter | p.A578* | Q15788 | protein_coding | | | TCGA-AN-A03X-01 | Breast | breast invasive carcinoma | Female | >=65 | I/II | Unknown | Unknown | SD |
| Entrez ID | Symbol | Category | Interaction Types | Drug Claim Name | Drug Name | PMIDs |
| 8648 | NCOA1 | ENZYME, CLINICALLY ACTIONABLE, TRANSCRIPTION FACTOR, NUCLEAR HORMONE RECEPTOR, TRANSCRIPTION FACTOR COMPLEX | | TCMDC-123764 | CHEMBL533226 | |
| 8648 | NCOA1 | ENZYME, CLINICALLY ACTIONABLE, TRANSCRIPTION FACTOR, NUCLEAR HORMONE RECEPTOR, TRANSCRIPTION FACTOR COMPLEX | | ETOPOSIDE | ETOPOSIDE | |
| 8648 | NCOA1 | ENZYME, CLINICALLY ACTIONABLE, TRANSCRIPTION FACTOR, NUCLEAR HORMONE RECEPTOR, TRANSCRIPTION FACTOR COMPLEX | inhibitor | 252827441 | | |
| 8648 | NCOA1 | ENZYME, CLINICALLY ACTIONABLE, TRANSCRIPTION FACTOR, NUCLEAR HORMONE RECEPTOR, TRANSCRIPTION FACTOR COMPLEX | | METHYLTHIONINIUM CHLORIDE | METHYLTHIONINIUM CHLORIDE | |
| 8648 | NCOA1 | ENZYME, CLINICALLY ACTIONABLE, TRANSCRIPTION FACTOR, NUCLEAR HORMONE RECEPTOR, TRANSCRIPTION FACTOR COMPLEX | | tamoxifen | TAMOXIFEN | 22174377 |


