
|
|||||
|
 | |
| |
| |
| |
| |
| |
|
Gene: NAB2 |
Gene summary for NAB2 |
| Gene information | Species | Human | Gene symbol | NAB2 | Gene ID | 4665 |
| Gene name | NGFI-A binding protein 2 | |
| Gene Alias | MADER | |
| Cytomap | 12q13.3 | |
| Gene Type | protein-coding | GO ID | GO:0001501 | UniProtAcc | Q15742 |
Top |
Malignant transformation analysis |
| Identification of the aberrant gene expression in precancerous and cancerous lesions by comparing the gene expression of stem-like cells in diseased tissues with normal stem cells |
| Entrez ID | Symbol | Replicates | Species | Organ | Tissue | Adj P-value | Log2FC | Malignancy |
| 4665 | NAB2 | C08 | Human | Oral cavity | OSCC | 2.53e-25 | 6.05e-01 | 0.1919 |
| 4665 | NAB2 | C09 | Human | Oral cavity | OSCC | 8.43e-08 | 3.69e-01 | 0.1431 |
| 4665 | NAB2 | LN22 | Human | Oral cavity | OSCC | 3.52e-03 | 6.23e-01 | 0.1733 |
| 4665 | NAB2 | LN46 | Human | Oral cavity | OSCC | 1.80e-10 | 4.21e-01 | 0.1666 |
| 4665 | NAB2 | LP15 | Human | Oral cavity | LP | 4.75e-04 | 5.68e-01 | 0.2174 |
| 4665 | NAB2 | SYSMH1 | Human | Oral cavity | OSCC | 7.69e-04 | 2.03e-01 | 0.1127 |
| 4665 | NAB2 | SYSMH2 | Human | Oral cavity | OSCC | 4.54e-09 | 2.61e-01 | 0.2326 |
| 4665 | NAB2 | SYSMH3 | Human | Oral cavity | OSCC | 6.28e-08 | 2.48e-01 | 0.2442 |
| 4665 | NAB2 | male-WTA | Human | Thyroid | PTC | 9.39e-50 | 5.08e-01 | 0.1037 |
| 4665 | NAB2 | PTC01 | Human | Thyroid | PTC | 6.46e-17 | 2.51e-01 | 0.1899 |
| 4665 | NAB2 | PTC03 | Human | Thyroid | PTC | 8.38e-05 | 1.41e-01 | 0.1784 |
| 4665 | NAB2 | PTC04 | Human | Thyroid | PTC | 6.68e-17 | 3.82e-01 | 0.1927 |
| 4665 | NAB2 | PTC05 | Human | Thyroid | PTC | 5.53e-12 | 7.33e-01 | 0.2065 |
| 4665 | NAB2 | PTC06 | Human | Thyroid | PTC | 1.09e-19 | 6.03e-01 | 0.2057 |
| 4665 | NAB2 | PTC07 | Human | Thyroid | PTC | 2.47e-35 | 5.25e-01 | 0.2044 |
| 4665 | NAB2 | ATC09 | Human | Thyroid | ATC | 3.13e-06 | 7.06e-02 | 0.2871 |
| 4665 | NAB2 | ATC12 | Human | Thyroid | ATC | 1.44e-18 | 2.98e-01 | 0.34 |
| 4665 | NAB2 | ATC13 | Human | Thyroid | ATC | 6.00e-20 | 2.25e-01 | 0.34 |
| 4665 | NAB2 | ATC1 | Human | Thyroid | ATC | 2.06e-05 | 5.08e-02 | 0.2878 |
| 4665 | NAB2 | ATC2 | Human | Thyroid | ATC | 7.22e-04 | 1.09e-01 | 0.34 |
| Page: 1 2 3 4 5 |
| Tissue | Expression Dynamics | Abbreviation |
| Esophagus |  | ESCC: Esophageal squamous cell carcinoma |
| HGIN: High-grade intraepithelial neoplasias | ||
| LGIN: Low-grade intraepithelial neoplasias | ||
| Oral Cavity |  | EOLP: Erosive Oral lichen planus |
| LP: leukoplakia | ||
| NEOLP: Non-erosive oral lichen planus | ||
| OSCC: Oral squamous cell carcinoma | ||
| Thyroid | 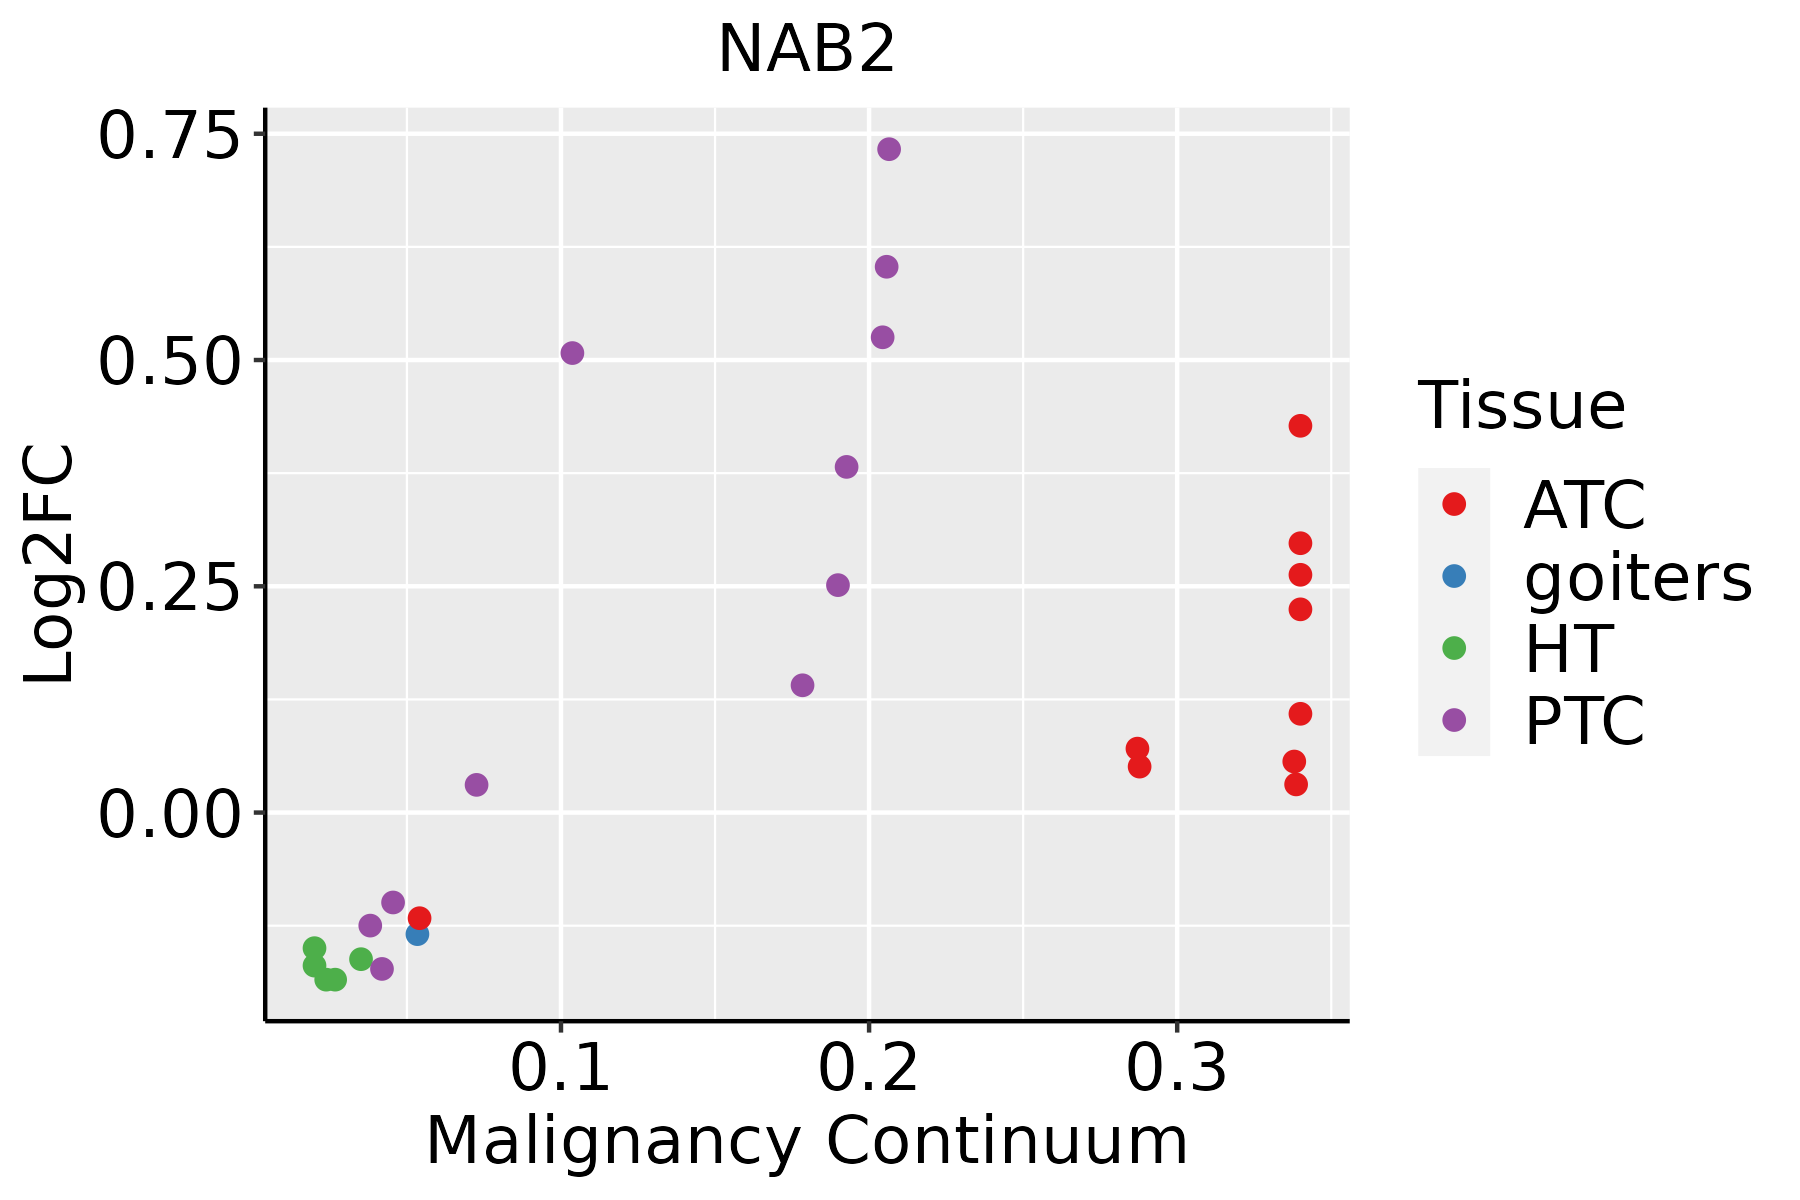 | ATC: Anaplastic thyroid cancer |
| HT: Hashimoto's thyroiditis | ||
| PTC: Papillary thyroid cancer |
| ∗log2FC in expression of this searched gene in stem-like cells from each diseased tissue sample relative to stem-like cells in normal samples in each tissue plotted against the malignancy continuum. Samples are colored based on if they are from different disease stage. |
Top |
Malignant transformation related pathway analysis |
| Find out the enriched GO biological processes and KEGG pathways involved in transition from healthy to precancer to cancer |
| Tissue | Disease Stage | Enriched GO biological Processes |
| Colorectum | AD |  |
| Colorectum | SER |  |
| Colorectum | MSS |  |
| Colorectum | MSI-H |  |
| Colorectum | FAP |  |
| ∗Top 15 enriched GO BP terms are showed in the bar plot of each disease state in each tissue. Each row represents a significant GO biological process which is colored according to the -log10(p.adjust). |
| Page: 1 2 3 4 5 6 7 8 9 |
| GO ID | Tissue | Disease Stage | Description | Gene Ratio | Bg Ratio | pvalue | p.adjust | Count |
| GO:00063833 | Esophagus | ESCC | transcription by RNA polymerase III | 41/8552 | 46/18723 | 7.69e-10 | 1.90e-08 | 41 |
| GO:000854410 | Esophagus | ESCC | epidermis development | 193/8552 | 324/18723 | 2.87e-07 | 4.19e-06 | 193 |
| GO:000150317 | Esophagus | ESCC | ossification | 232/8552 | 408/18723 | 3.00e-06 | 3.40e-05 | 232 |
| GO:004586018 | Esophagus | ESCC | positive regulation of protein kinase activity | 219/8552 | 386/18723 | 6.91e-06 | 6.97e-05 | 219 |
| GO:003367420 | Esophagus | ESCC | positive regulation of kinase activity | 260/8552 | 467/18723 | 7.26e-06 | 7.22e-05 | 260 |
| GO:00425524 | Esophagus | ESCC | myelination | 85/8552 | 134/18723 | 2.51e-05 | 2.13e-04 | 85 |
| GO:00072724 | Esophagus | ESCC | ensheathment of neurons | 86/8552 | 136/18723 | 2.68e-05 | 2.24e-04 | 86 |
| GO:00083664 | Esophagus | ESCC | axon ensheathment | 86/8552 | 136/18723 | 2.68e-05 | 2.24e-04 | 86 |
| GO:00456826 | Esophagus | ESCC | regulation of epidermis development | 46/8552 | 65/18723 | 3.65e-05 | 2.97e-04 | 46 |
| GO:00420636 | Esophagus | ESCC | gliogenesis | 172/8552 | 301/18723 | 3.75e-05 | 3.04e-04 | 172 |
| GO:0006359 | Esophagus | ESCC | regulation of transcription by RNA polymerase III | 19/8552 | 22/18723 | 9.52e-05 | 6.78e-04 | 19 |
| GO:00100016 | Esophagus | ESCC | glial cell differentiation | 129/8552 | 225/18723 | 2.73e-04 | 1.65e-03 | 129 |
| GO:00140373 | Esophagus | ESCC | Schwann cell differentiation | 28/8552 | 40/18723 | 1.61e-03 | 7.50e-03 | 28 |
| GO:00603485 | Esophagus | ESCC | bone development | 115/8552 | 205/18723 | 1.67e-03 | 7.72e-03 | 115 |
| GO:00487052 | Esophagus | ESCC | skeletal system morphogenesis | 120/8552 | 220/18723 | 4.90e-03 | 1.89e-02 | 120 |
| GO:0006739 | Liver | HCC | NADP metabolic process | 25/7958 | 35/18723 | 5.05e-04 | 3.29e-03 | 25 |
| GO:00085449 | Oral cavity | OSCC | epidermis development | 171/7305 | 324/18723 | 2.89e-07 | 4.43e-06 | 171 |
| GO:00063832 | Oral cavity | OSCC | transcription by RNA polymerase III | 34/7305 | 46/18723 | 1.61e-06 | 2.11e-05 | 34 |
| GO:004586016 | Oral cavity | OSCC | positive regulation of protein kinase activity | 194/7305 | 386/18723 | 3.90e-06 | 4.59e-05 | 194 |
| GO:000150310 | Oral cavity | OSCC | ossification | 203/7305 | 408/18723 | 5.54e-06 | 6.19e-05 | 203 |
| Page: 1 2 3 |
| Pathway ID | Tissue | Disease Stage | Description | Gene Ratio | Bg Ratio | pvalue | p.adjust | qvalue | Count |
| Page: 1 |
Top |
Cell-cell communication analysis |
| Identification of potential cell-cell interactions between two cell types and their ligand-receptor pairs for different disease states |
| Ligand | Receptor | LRpair | Pathway | Tissue | Disease Stage |
| Page: 1 |
Top |
Single-cell gene regulatory network inference analysis |
| Find out the significant the regulons (TFs) and the target genes of each regulon across cell types for different disease states |
| TF | Cell Type | Tissue | Disease Stage | Target Gene | RSS | Regulon Activity |
| ∗The dot plots of a searched regulon are shown for all cell subpopulations in each disease state of each tissue based on the regulon specific score inferred using pySCENIC and by calculating the average expression. |
| Page: 1 |
Top |
Somatic mutation of malignant transformation related genes |
| Annotation of somatic variants for genes involved in malignant transformation |
| Hugo Symbol | Variant Class | Variant Classification | dbSNP RS | HGVSc | HGVSp | HGVSp Short | SWISSPROT | BIOTYPE | SIFT | PolyPhen | Tumor Sample Barcode | Tissue | Histology | Sex | Age | Stage | Therapy Types | Drugs | Outcome |
| NAB2 | SNV | Missense_Mutation | novel | c.908N>C | p.Gly303Ala | p.G303A | Q15742 | protein_coding | deleterious(0) | probably_damaging(1) | TCGA-BH-A0B6-01 | Breast | breast invasive carcinoma | Female | <65 | I/II | Unknown | Unknown | SD |
| NAB2 | SNV | Missense_Mutation | novel | c.1165N>A | p.Glu389Lys | p.E389K | Q15742 | protein_coding | tolerated(0.5) | benign(0.191) | TCGA-BH-A0B6-01 | Breast | breast invasive carcinoma | Female | <65 | I/II | Unknown | Unknown | SD |
| NAB2 | SNV | Missense_Mutation | novel | c.110N>T | p.Pro37Leu | p.P37L | Q15742 | protein_coding | deleterious(0) | probably_damaging(0.985) | TCGA-C8-A12T-01 | Breast | breast invasive carcinoma | Female | <65 | I/II | Unknown | Unknown | SD |
| NAB2 | SNV | Missense_Mutation | c.392N>G | p.Ser131Cys | p.S131C | Q15742 | protein_coding | tolerated(0.08) | probably_damaging(0.945) | TCGA-D8-A27G-01 | Breast | breast invasive carcinoma | Female | >=65 | I/II | Unknown | Unknown | SD | |
| NAB2 | insertion | Nonsense_Mutation | novel | c.208_209insATTTCTTGTAAAATAACTAACTTGA | p.Gln70HisfsTer4 | p.Q70Hfs*4 | Q15742 | protein_coding | TCGA-B6-A0RG-01 | Breast | breast invasive carcinoma | Female | <65 | I/II | Unknown | Unknown | SD | ||
| NAB2 | SNV | Missense_Mutation | novel | c.1004N>T | p.Thr335Met | p.T335M | Q15742 | protein_coding | deleterious(0) | probably_damaging(0.974) | TCGA-2W-A8YY-01 | Cervix | cervical & endocervical cancer | Female | <65 | I/II | Chemotherapy | cisplatin | CR |
| NAB2 | SNV | Missense_Mutation | rs767681676 | c.955N>A | p.Glu319Lys | p.E319K | Q15742 | protein_coding | deleterious(0) | probably_damaging(0.999) | TCGA-DG-A2KL-01 | Cervix | cervical & endocervical cancer | Female | <65 | I/II | Chemotherapy | cisplatin | SD |
| NAB2 | SNV | Missense_Mutation | c.177N>C | p.Glu59Asp | p.E59D | Q15742 | protein_coding | tolerated(0.87) | benign(0.028) | TCGA-DS-A1OC-01 | Cervix | cervical & endocervical cancer | Female | <65 | I/II | Chemotherapy | gemcitabine | SD | |
| NAB2 | SNV | Missense_Mutation | c.223G>A | p.Ala75Thr | p.A75T | Q15742 | protein_coding | deleterious(0) | probably_damaging(0.995) | TCGA-FU-A40J-01 | Cervix | cervical & endocervical cancer | Female | <65 | III/IV | Chemotherapy | carboplatin | CR | |
| NAB2 | SNV | Missense_Mutation | c.1561G>A | p.Glu521Lys | p.E521K | Q15742 | protein_coding | deleterious_low_confidence(0.01) | possibly_damaging(0.636) | TCGA-HG-A2PA-01 | Cervix | cervical & endocervical cancer | Female | <65 | I/II | Unspecific | Taxol | PD |
| Page: 1 2 3 4 5 |
Top |
Related drugs of malignant transformation related genes |
| Identification of chemicals and drugs interact with genes involved in malignant transfromation |
| (DGIdb 4.0) |
| Entrez ID | Symbol | Category | Interaction Types | Drug Claim Name | Drug Name | PMIDs |
| Page: 1 |

Copyright 2023-Present -The University of Texas Health Science Center at Houston |