
|
|||||
|
 | |
| |
| |
| |
| |
| |
|
Gene: MRPL53 |
Gene summary for MRPL53 |
| Gene information | Species | Human | Gene symbol | MRPL53 | Gene ID | 116540 |
| Gene name | mitochondrial ribosomal protein L53 | |
| Gene Alias | L53MT | |
| Cytomap | 2p13.1 | |
| Gene Type | protein-coding | GO ID | GO:0000313 | UniProtAcc | Q96EL3 |
Top |
Malignant transformation analysis |
| Identification of the aberrant gene expression in precancerous and cancerous lesions by comparing the gene expression of stem-like cells in diseased tissues with normal stem cells |
| Entrez ID | Symbol | Replicates | Species | Organ | Tissue | Adj P-value | Log2FC | Malignancy |
| 116540 | MRPL53 | S016 | Human | Liver | HCC | 8.44e-03 | 2.24e-01 | 0.2243 |
| 116540 | MRPL53 | C04 | Human | Oral cavity | OSCC | 1.55e-06 | 3.10e-01 | 0.2633 |
| 116540 | MRPL53 | C21 | Human | Oral cavity | OSCC | 6.64e-05 | 2.52e-01 | 0.2678 |
| 116540 | MRPL53 | C30 | Human | Oral cavity | OSCC | 4.19e-24 | 8.66e-01 | 0.3055 |
| 116540 | MRPL53 | C43 | Human | Oral cavity | OSCC | 2.95e-02 | 8.17e-02 | 0.1704 |
| 116540 | MRPL53 | C46 | Human | Oral cavity | OSCC | 4.24e-11 | 2.75e-01 | 0.1673 |
| 116540 | MRPL53 | C57 | Human | Oral cavity | OSCC | 8.05e-07 | 2.83e-01 | 0.1679 |
| 116540 | MRPL53 | C08 | Human | Oral cavity | OSCC | 1.33e-26 | 5.14e-01 | 0.1919 |
| 116540 | MRPL53 | C09 | Human | Oral cavity | OSCC | 1.64e-02 | 2.02e-01 | 0.1431 |
| 116540 | MRPL53 | LP15 | Human | Oral cavity | LP | 4.46e-09 | 9.35e-01 | 0.2174 |
| 116540 | MRPL53 | SYSMH1 | Human | Oral cavity | OSCC | 4.79e-04 | 6.65e-02 | 0.1127 |
| 116540 | MRPL53 | SYSMH2 | Human | Oral cavity | OSCC | 3.80e-05 | 1.50e-01 | 0.2326 |
| 116540 | MRPL53 | SYSMH3 | Human | Oral cavity | OSCC | 5.69e-03 | 1.30e-01 | 0.2442 |
| 116540 | MRPL53 | SYSMH6 | Human | Oral cavity | OSCC | 2.19e-02 | 8.96e-02 | 0.1275 |
| Page: 1 2 3 4 |
| Tissue | Expression Dynamics | Abbreviation |
| Esophagus | 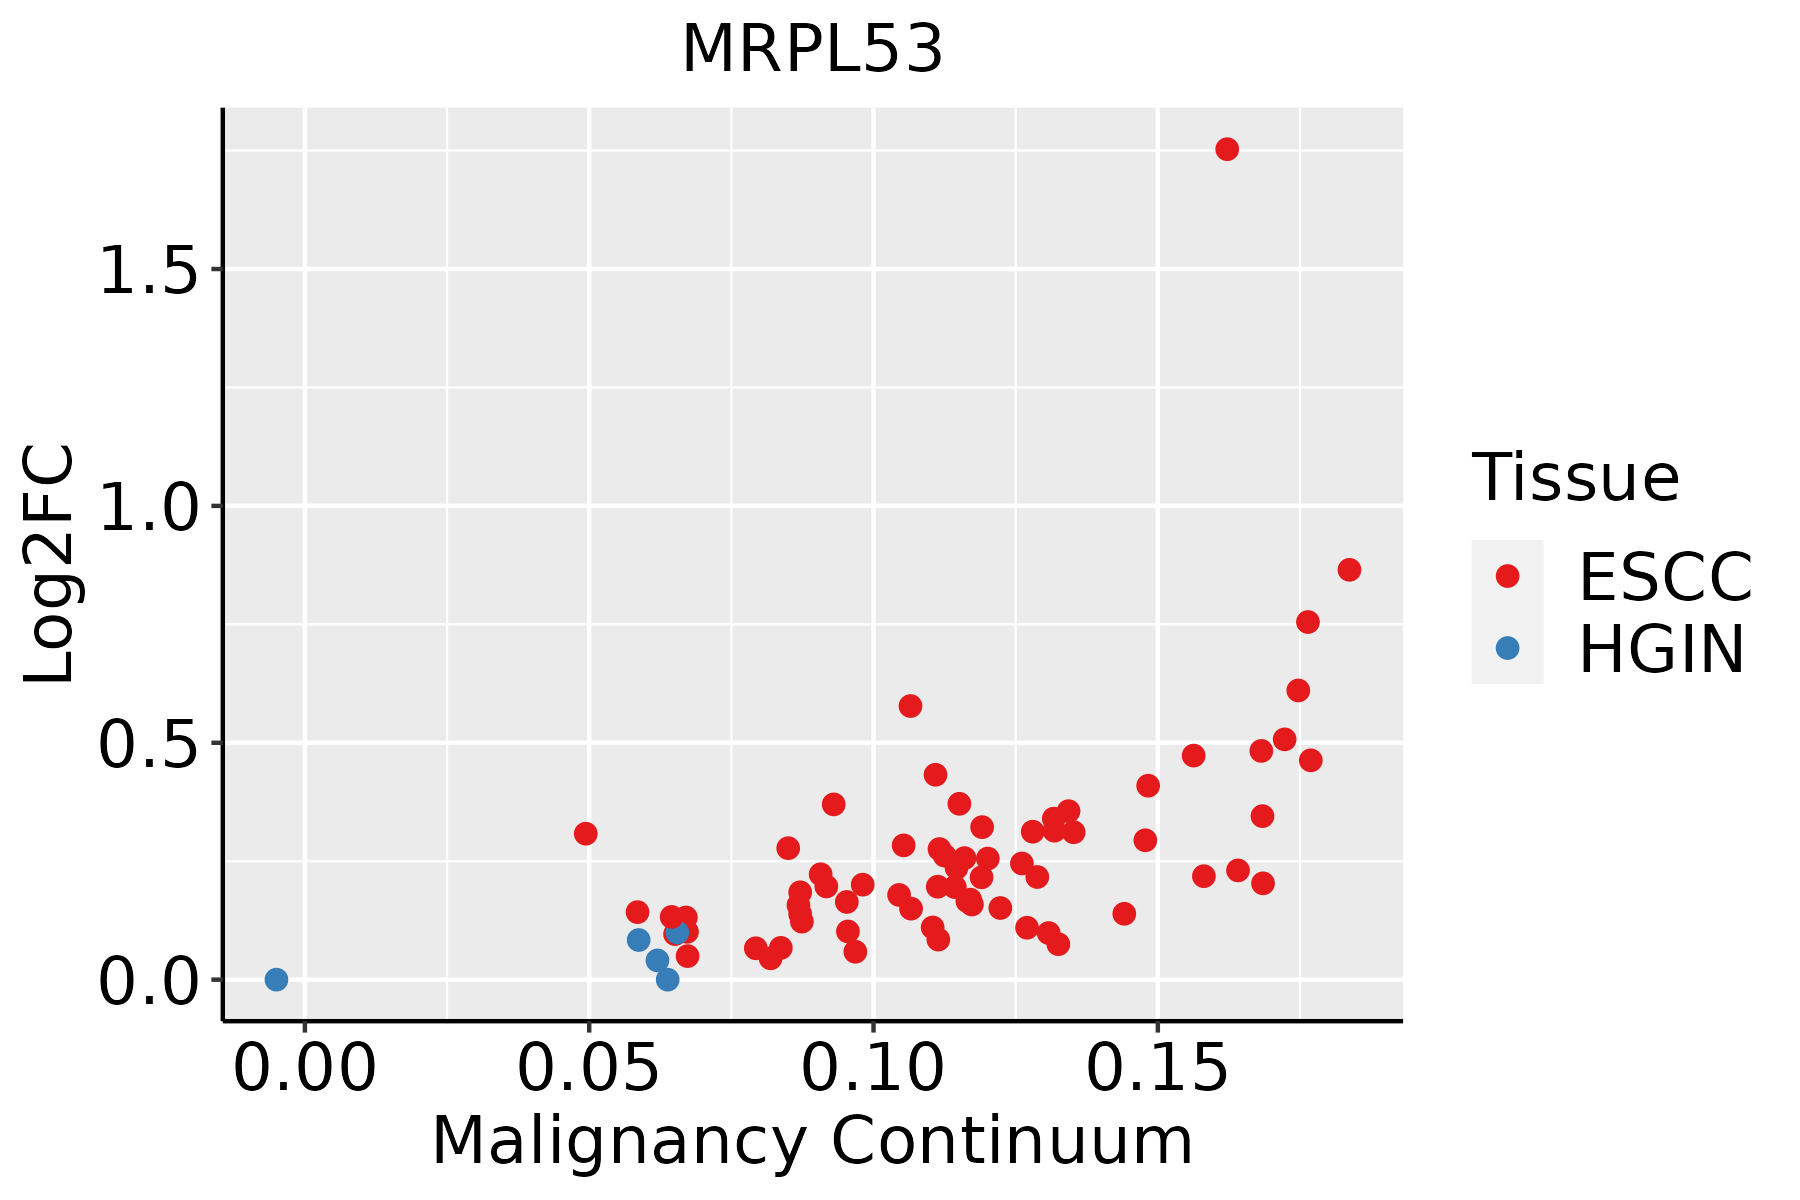 | ESCC: Esophageal squamous cell carcinoma |
| HGIN: High-grade intraepithelial neoplasias | ||
| LGIN: Low-grade intraepithelial neoplasias | ||
| Liver | 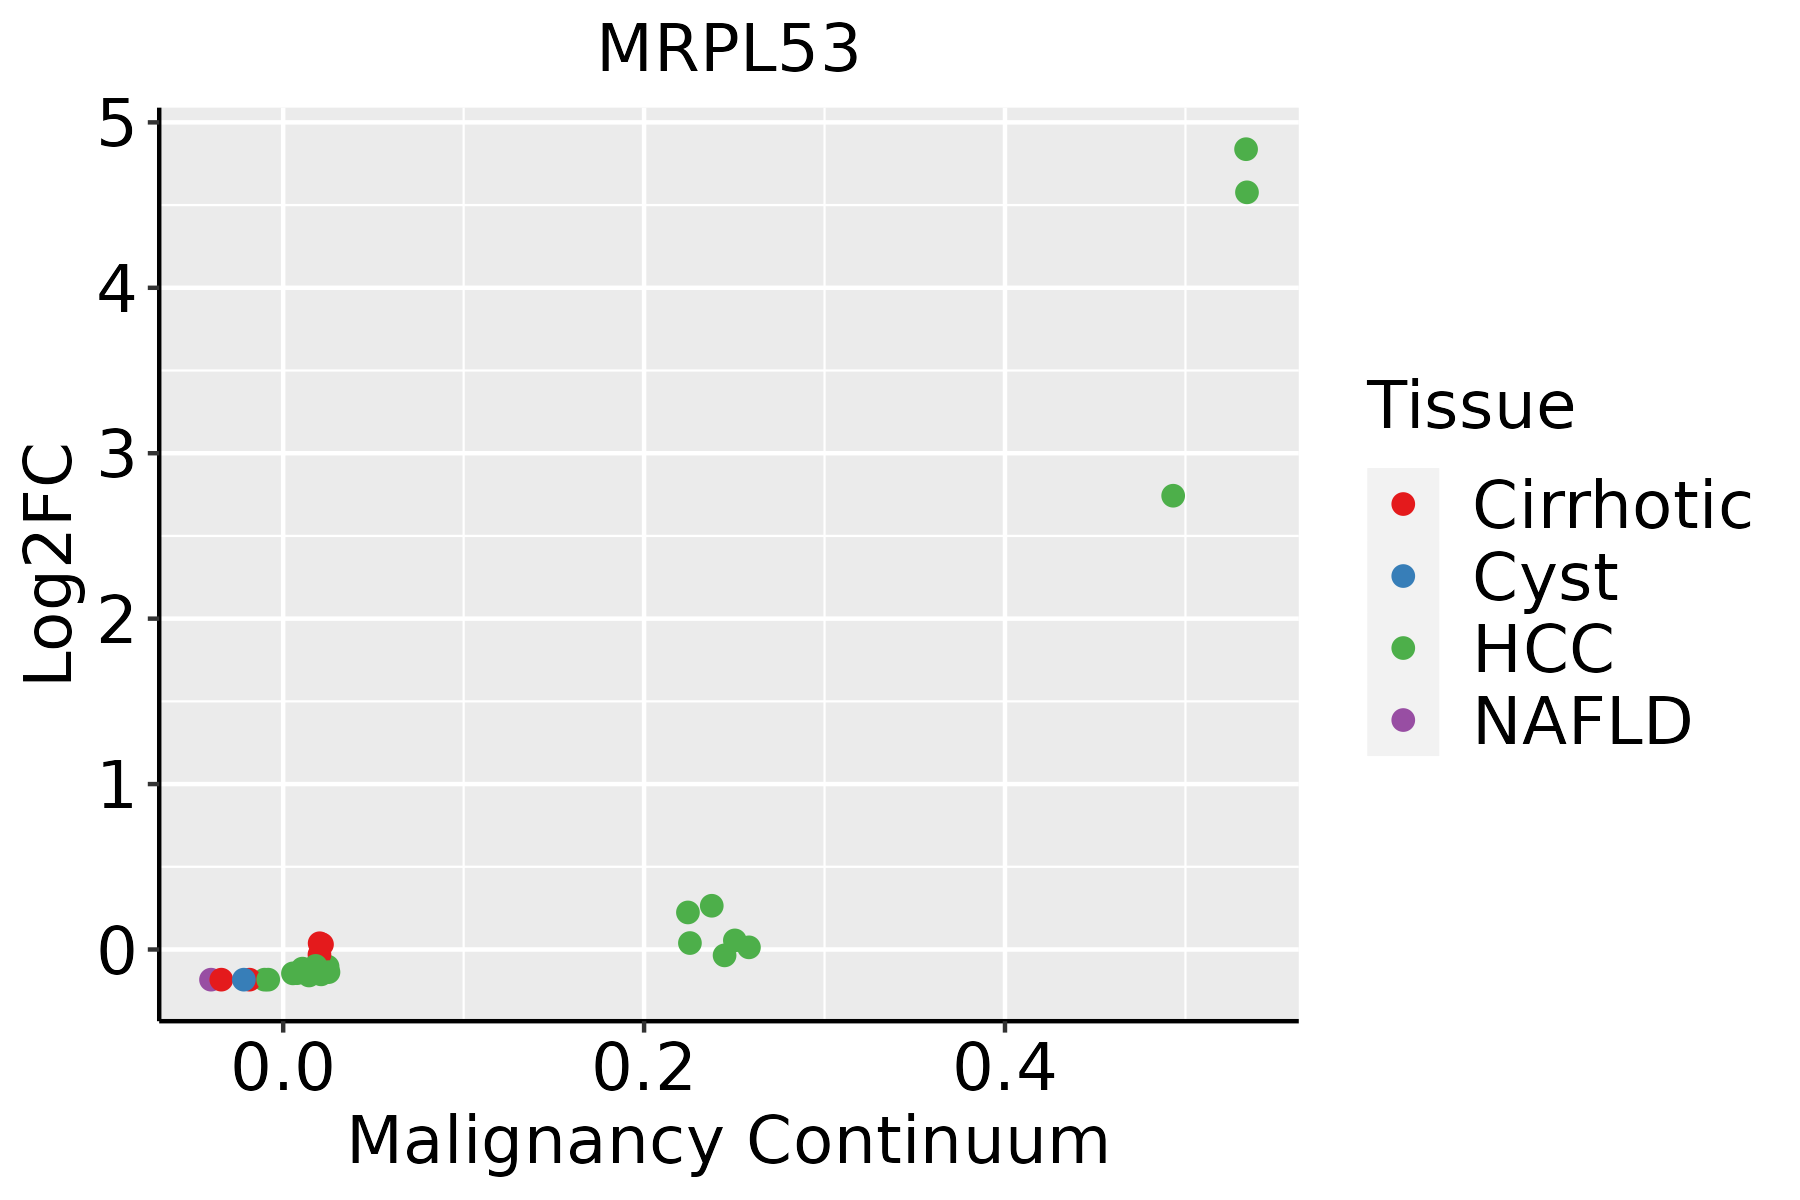 | HCC: Hepatocellular carcinoma |
| NAFLD: Non-alcoholic fatty liver disease | ||
| Oral Cavity | 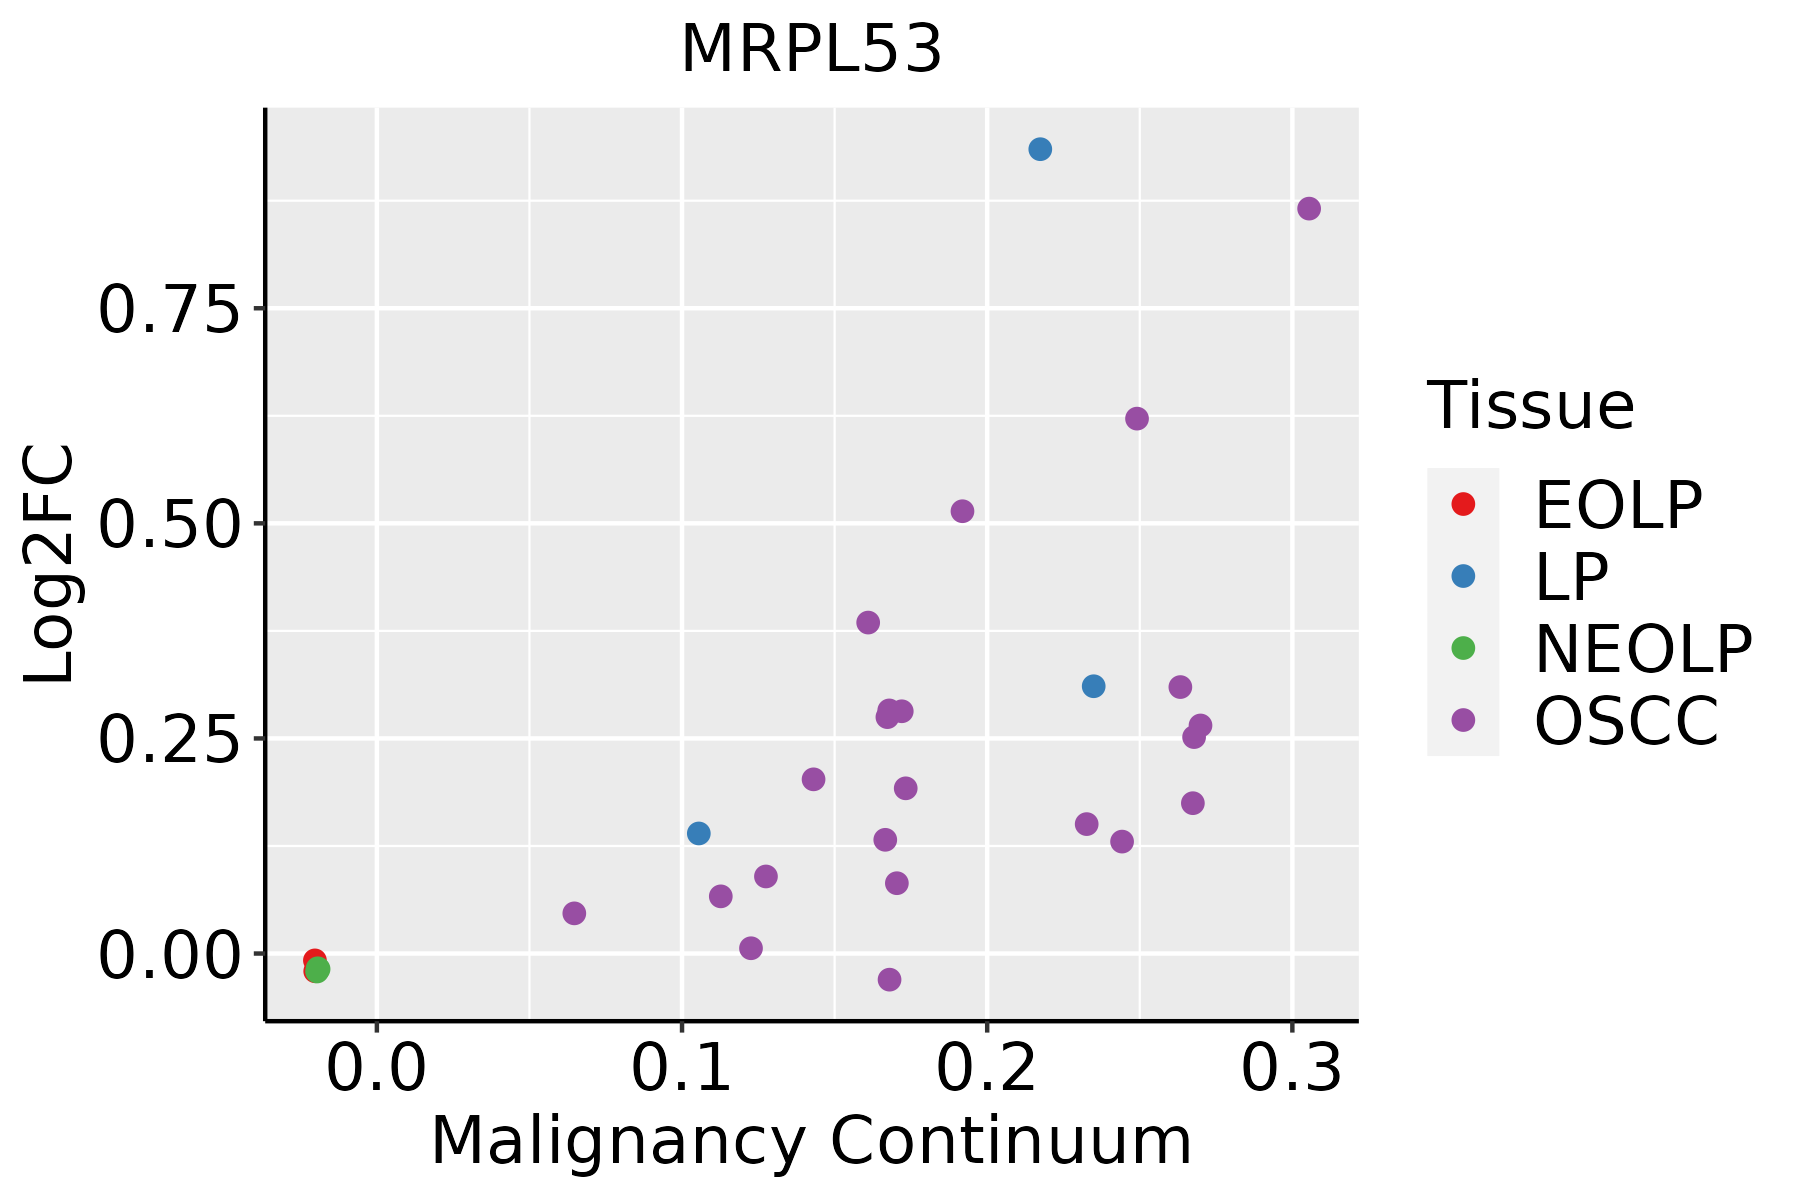 | EOLP: Erosive Oral lichen planus |
| LP: leukoplakia | ||
| NEOLP: Non-erosive oral lichen planus | ||
| OSCC: Oral squamous cell carcinoma |
| ∗log2FC in expression of this searched gene in stem-like cells from each diseased tissue sample relative to stem-like cells in normal samples in each tissue plotted against the malignancy continuum. Samples are colored based on if they are from different disease stage. |
Top |
Malignant transformation related pathway analysis |
| Find out the enriched GO biological processes and KEGG pathways involved in transition from healthy to precancer to cancer |
| Tissue | Disease Stage | Enriched GO biological Processes |
| Colorectum | AD |  |
| Colorectum | SER |  |
| Colorectum | MSS |  |
| Colorectum | MSI-H |  |
| Colorectum | FAP |  |
| ∗Top 15 enriched GO BP terms are showed in the bar plot of each disease state in each tissue. Each row represents a significant GO biological process which is colored according to the -log10(p.adjust). |
| Page: 1 2 3 4 5 6 7 8 9 |
| GO ID | Tissue | Disease Stage | Description | Gene Ratio | Bg Ratio | pvalue | p.adjust | Count |
| Page: 1 |
| Pathway ID | Tissue | Disease Stage | Description | Gene Ratio | Bg Ratio | pvalue | p.adjust | qvalue | Count |
| Page: 1 |
Top |
Cell-cell communication analysis |
| Identification of potential cell-cell interactions between two cell types and their ligand-receptor pairs for different disease states |
| Ligand | Receptor | LRpair | Pathway | Tissue | Disease Stage |
| Page: 1 |
Top |
Single-cell gene regulatory network inference analysis |
| Find out the significant the regulons (TFs) and the target genes of each regulon across cell types for different disease states |
| TF | Cell Type | Tissue | Disease Stage | Target Gene | RSS | Regulon Activity |
| ∗The dot plots of a searched regulon are shown for all cell subpopulations in each disease state of each tissue based on the regulon specific score inferred using pySCENIC and by calculating the average expression. |
| Page: 1 |
Top |
Somatic mutation of malignant transformation related genes |
| Annotation of somatic variants for genes involved in malignant transformation |
| Hugo Symbol | Variant Class | Variant Classification | dbSNP RS | HGVSc | HGVSp | HGVSp Short | SWISSPROT | BIOTYPE | SIFT | PolyPhen | Tumor Sample Barcode | Tissue | Histology | Sex | Age | Stage | Therapy Types | Drugs | Outcome |
| MRPL53 | SNV | Missense_Mutation | rs150499635 | c.19C>T | p.Arg7Trp | p.R7W | Q96EL3 | protein_coding | deleterious(0.01) | benign(0.165) | TCGA-3C-AALI-01 | Breast | breast invasive carcinoma | Female | <65 | I/II | Unspecific | Poly E | Complete Response |
| MRPL53 | SNV | Missense_Mutation | novel | c.70G>C | p.Glu24Gln | p.E24Q | Q96EL3 | protein_coding | deleterious(0.03) | benign(0.38) | TCGA-AR-A0TX-01 | Breast | breast invasive carcinoma | Female | <65 | I/II | Unknown | Unknown | SD |
| MRPL53 | SNV | Missense_Mutation | rs202083153 | c.217N>T | p.Arg73Cys | p.R73C | Q96EL3 | protein_coding | deleterious(0) | probably_damaging(0.981) | TCGA-D8-A1JC-01 | Breast | breast invasive carcinoma | Female | <65 | III/IV | Chemotherapy | adriamycin | SD |
| MRPL53 | SNV | Missense_Mutation | rs773890839 | c.317C>T | p.Pro106Leu | p.P106L | Q96EL3 | protein_coding | deleterious_low_confidence(0.05) | probably_damaging(0.995) | TCGA-2W-A8YY-01 | Cervix | cervical & endocervical cancer | Female | <65 | I/II | Chemotherapy | cisplatin | CR |
| MRPL53 | SNV | Missense_Mutation | c.72N>T | p.Glu24Asp | p.E24D | Q96EL3 | protein_coding | tolerated(0.08) | benign(0.074) | TCGA-VS-A953-01 | Cervix | cervical & endocervical cancer | Female | <65 | I/II | Unknown | Unknown | PD | |
| MRPL53 | SNV | Missense_Mutation | novel | c.61T>A | p.Cys21Ser | p.C21S | Q96EL3 | protein_coding | tolerated(0.07) | probably_damaging(0.986) | TCGA-AA-3949-01 | Colorectum | colon adenocarcinoma | Female | >=65 | III/IV | Unknown | Unknown | SD |
| MRPL53 | SNV | Missense_Mutation | novel | c.146N>T | p.Cys49Phe | p.C49F | Q96EL3 | protein_coding | deleterious(0) | probably_damaging(1) | TCGA-CA-6717-01 | Colorectum | colon adenocarcinoma | Male | <65 | I/II | Chemotherapy | oxaliplatin | CR |
| MRPL53 | SNV | Missense_Mutation | novel | c.60N>A | p.Phe20Leu | p.F20L | Q96EL3 | protein_coding | tolerated(0.06) | possibly_damaging(0.809) | TCGA-AG-A002-01 | Colorectum | rectum adenocarcinoma | Male | <65 | I/II | Unknown | Unknown | SD |
| MRPL53 | SNV | Missense_Mutation | novel | c.124N>A | p.Val42Ile | p.V42I | Q96EL3 | protein_coding | tolerated(0.39) | benign(0.003) | TCGA-BG-A221-01 | Endometrium | uterine corpus endometrioid carcinoma | Female | >=65 | I/II | Unknown | Unknown | SD |
| MRPL53 | insertion | Frame_Shift_Ins | novel | c.77_78insG | p.Asn26LysfsTer15 | p.N26Kfs*15 | Q96EL3 | protein_coding | TCGA-AX-A2HC-01 | Endometrium | uterine corpus endometrioid carcinoma | Female | <65 | III/IV | Chemotherapy | paclitaxel | PD |
| Page: 1 2 |
Top |
Related drugs of malignant transformation related genes |
| Identification of chemicals and drugs interact with genes involved in malignant transfromation |
| (DGIdb 4.0) |
| Entrez ID | Symbol | Category | Interaction Types | Drug Claim Name | Drug Name | PMIDs |
| Page: 1 |

Copyright 2023-Present -The University of Texas Health Science Center at Houston |