
|
|||||
|
 | |
| |
| |
| |
| |
| |
|
Gene: MRPL32 |
Gene summary for MRPL32 |
| Gene information | Species | Human | Gene symbol | MRPL32 | Gene ID | 64983 |
| Gene name | mitochondrial ribosomal protein L32 | |
| Gene Alias | HSPC283 | |
| Cytomap | 7p14.1 | |
| Gene Type | protein-coding | GO ID | GO:0006412 | UniProtAcc | A4D1V4 |
Top |
Malignant transformation analysis |
| Identification of the aberrant gene expression in precancerous and cancerous lesions by comparing the gene expression of stem-like cells in diseased tissues with normal stem cells |
| Entrez ID | Symbol | Replicates | Species | Organ | Tissue | Adj P-value | Log2FC | Malignancy |
| 64983 | MRPL32 | P57T-E | Human | Esophagus | ESCC | 1.31e-17 | 3.15e-01 | 0.0926 |
| 64983 | MRPL32 | P61T-E | Human | Esophagus | ESCC | 1.90e-14 | 3.70e-01 | 0.099 |
| 64983 | MRPL32 | P62T-E | Human | Esophagus | ESCC | 2.34e-47 | 9.77e-01 | 0.1302 |
| 64983 | MRPL32 | P65T-E | Human | Esophagus | ESCC | 3.11e-10 | 8.41e-02 | 0.0978 |
| 64983 | MRPL32 | P74T-E | Human | Esophagus | ESCC | 3.19e-35 | 1.26e+00 | 0.1479 |
| 64983 | MRPL32 | P75T-E | Human | Esophagus | ESCC | 2.04e-39 | 8.49e-01 | 0.1125 |
| 64983 | MRPL32 | P76T-E | Human | Esophagus | ESCC | 5.80e-19 | 4.75e-01 | 0.1207 |
| 64983 | MRPL32 | P79T-E | Human | Esophagus | ESCC | 2.62e-23 | 4.99e-01 | 0.1154 |
| 64983 | MRPL32 | P80T-E | Human | Esophagus | ESCC | 1.31e-41 | 1.31e+00 | 0.155 |
| 64983 | MRPL32 | P82T-E | Human | Esophagus | ESCC | 1.91e-08 | 8.36e-01 | 0.1072 |
| 64983 | MRPL32 | P83T-E | Human | Esophagus | ESCC | 2.03e-54 | 1.78e+00 | 0.1738 |
| 64983 | MRPL32 | P84T-E | Human | Esophagus | ESCC | 1.06e-02 | 3.37e-01 | 0.0933 |
| 64983 | MRPL32 | P89T-E | Human | Esophagus | ESCC | 8.25e-19 | 1.60e+00 | 0.1752 |
| 64983 | MRPL32 | P91T-E | Human | Esophagus | ESCC | 1.97e-15 | 1.75e+00 | 0.1828 |
| 64983 | MRPL32 | P107T-E | Human | Esophagus | ESCC | 1.88e-63 | 1.77e+00 | 0.171 |
| 64983 | MRPL32 | P126T-E | Human | Esophagus | ESCC | 3.73e-08 | 8.60e-01 | 0.1125 |
| 64983 | MRPL32 | P127T-E | Human | Esophagus | ESCC | 3.26e-20 | 1.78e-01 | 0.0826 |
| 64983 | MRPL32 | P128T-E | Human | Esophagus | ESCC | 1.91e-41 | 1.47e+00 | 0.1241 |
| 64983 | MRPL32 | P130T-E | Human | Esophagus | ESCC | 5.64e-59 | 1.39e+00 | 0.1676 |
| 64983 | MRPL32 | S43 | Human | Liver | Cirrhotic | 7.23e-11 | -3.57e-01 | -0.0187 |
| Page: 1 2 3 4 5 6 7 |
| Tissue | Expression Dynamics | Abbreviation |
| Colorectum (GSE201348) | 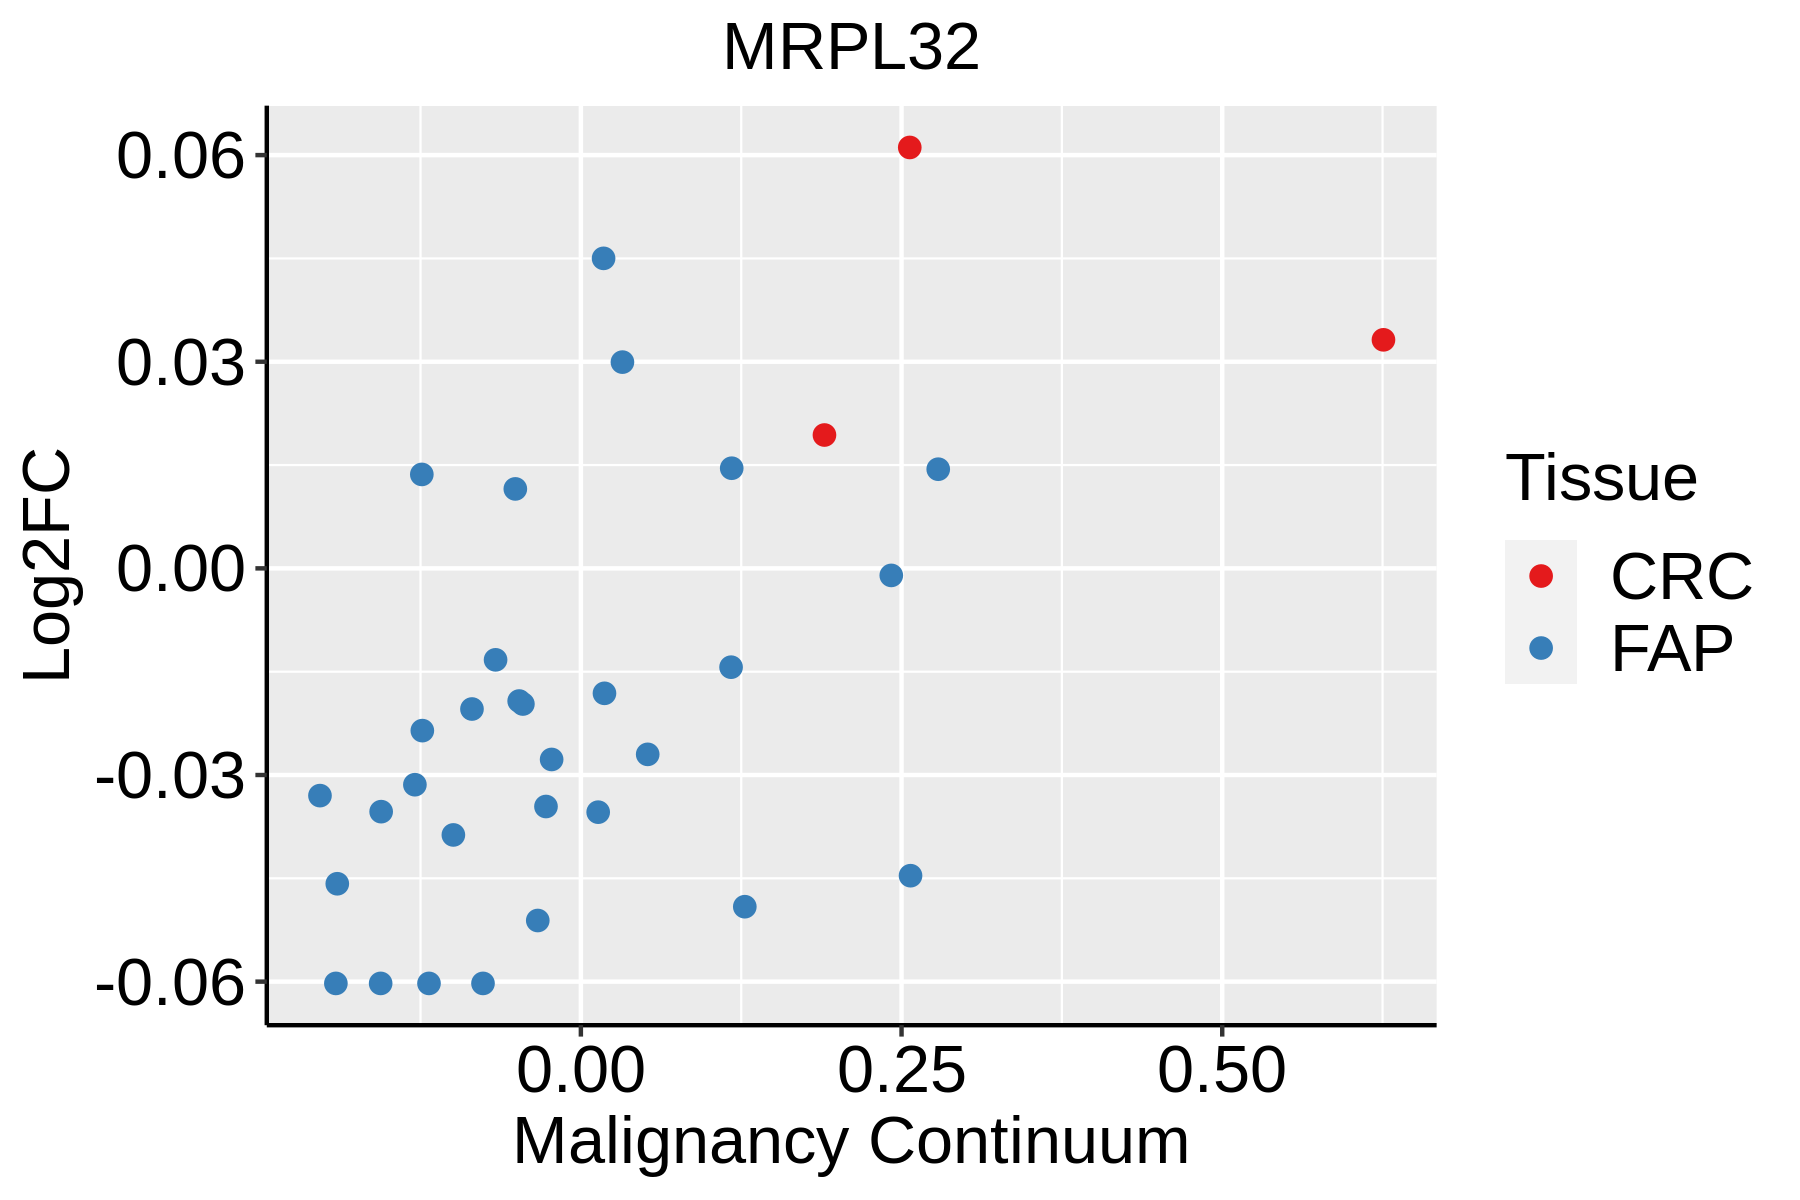 | FAP: Familial adenomatous polyposis |
| CRC: Colorectal cancer | ||
| Colorectum (HTA11) |  | AD: Adenomas |
| SER: Sessile serrated lesions | ||
| MSI-H: Microsatellite-high colorectal cancer | ||
| MSS: Microsatellite stable colorectal cancer | ||
| Esophagus |  | ESCC: Esophageal squamous cell carcinoma |
| HGIN: High-grade intraepithelial neoplasias | ||
| LGIN: Low-grade intraepithelial neoplasias | ||
| Liver | 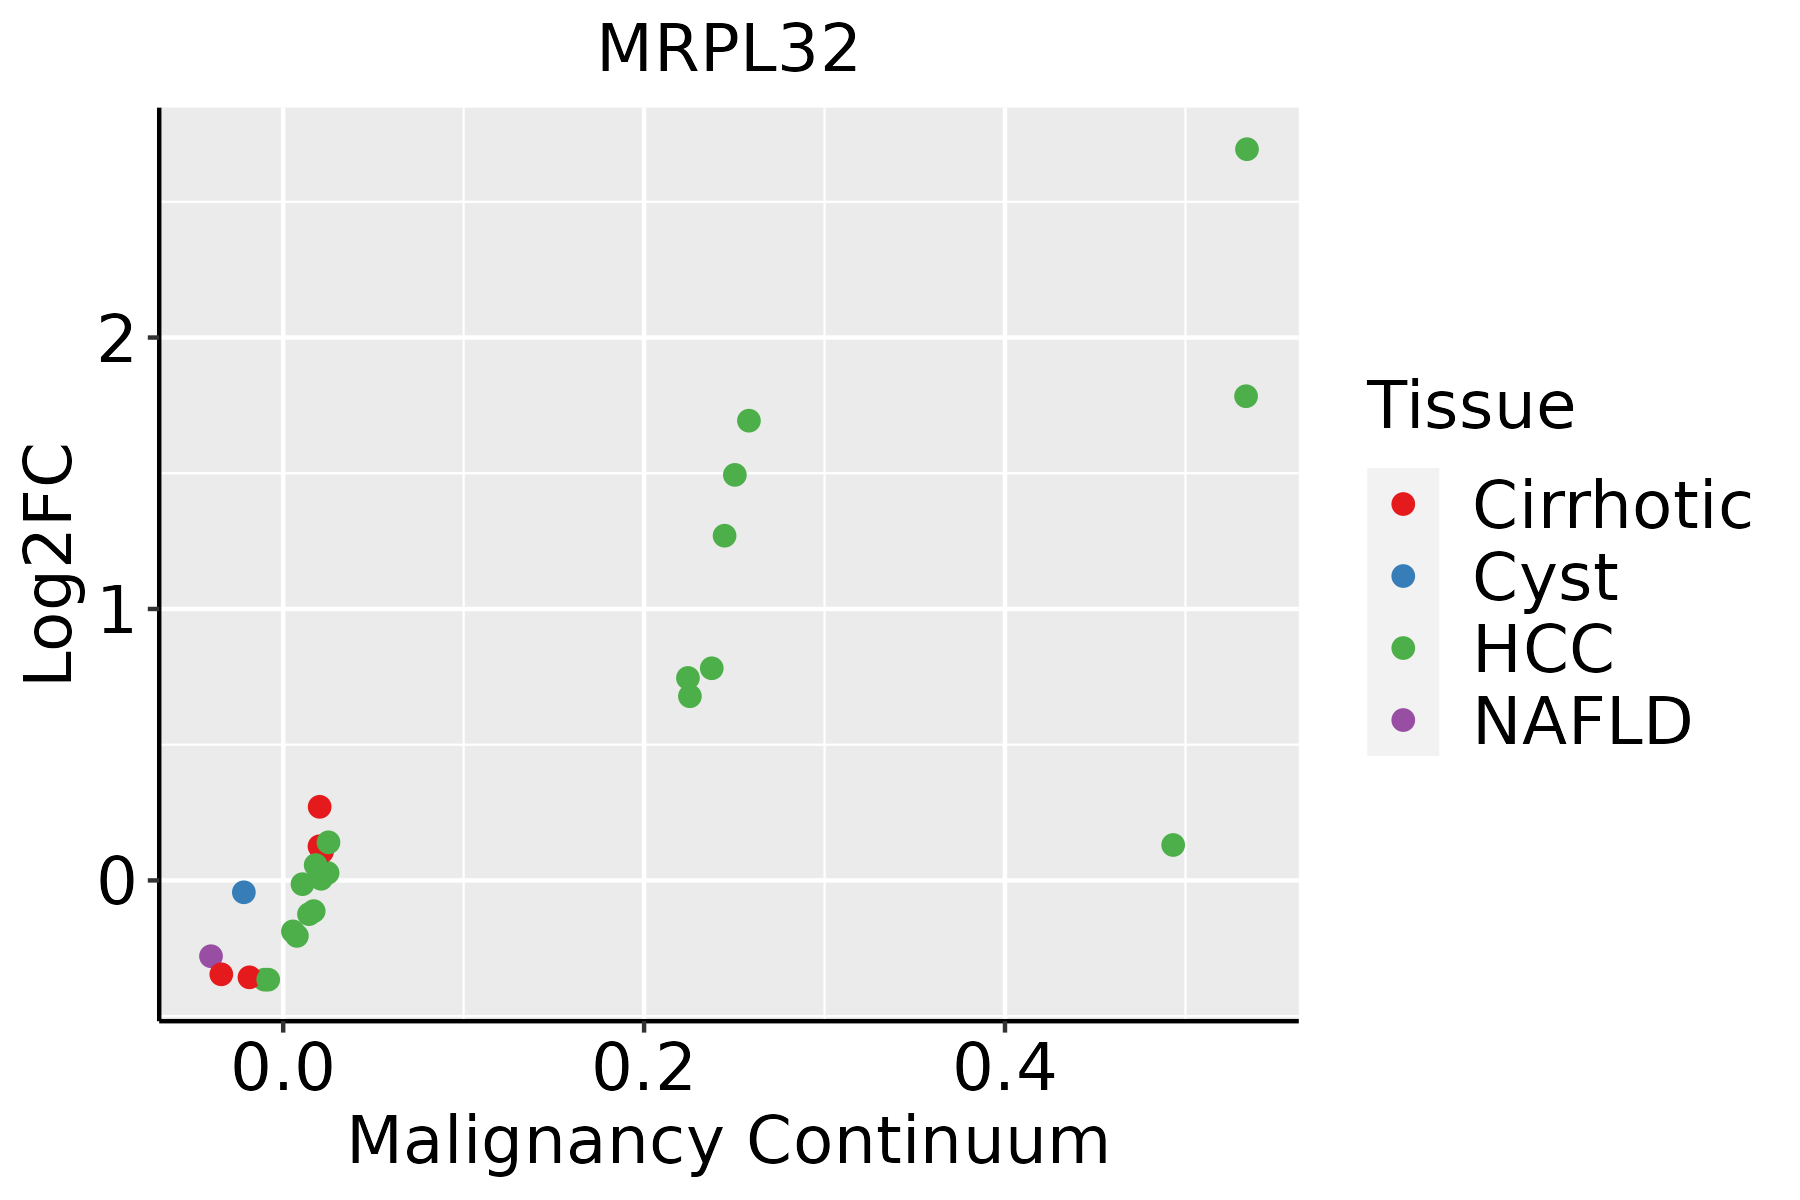 | HCC: Hepatocellular carcinoma |
| NAFLD: Non-alcoholic fatty liver disease | ||
| Oral Cavity | 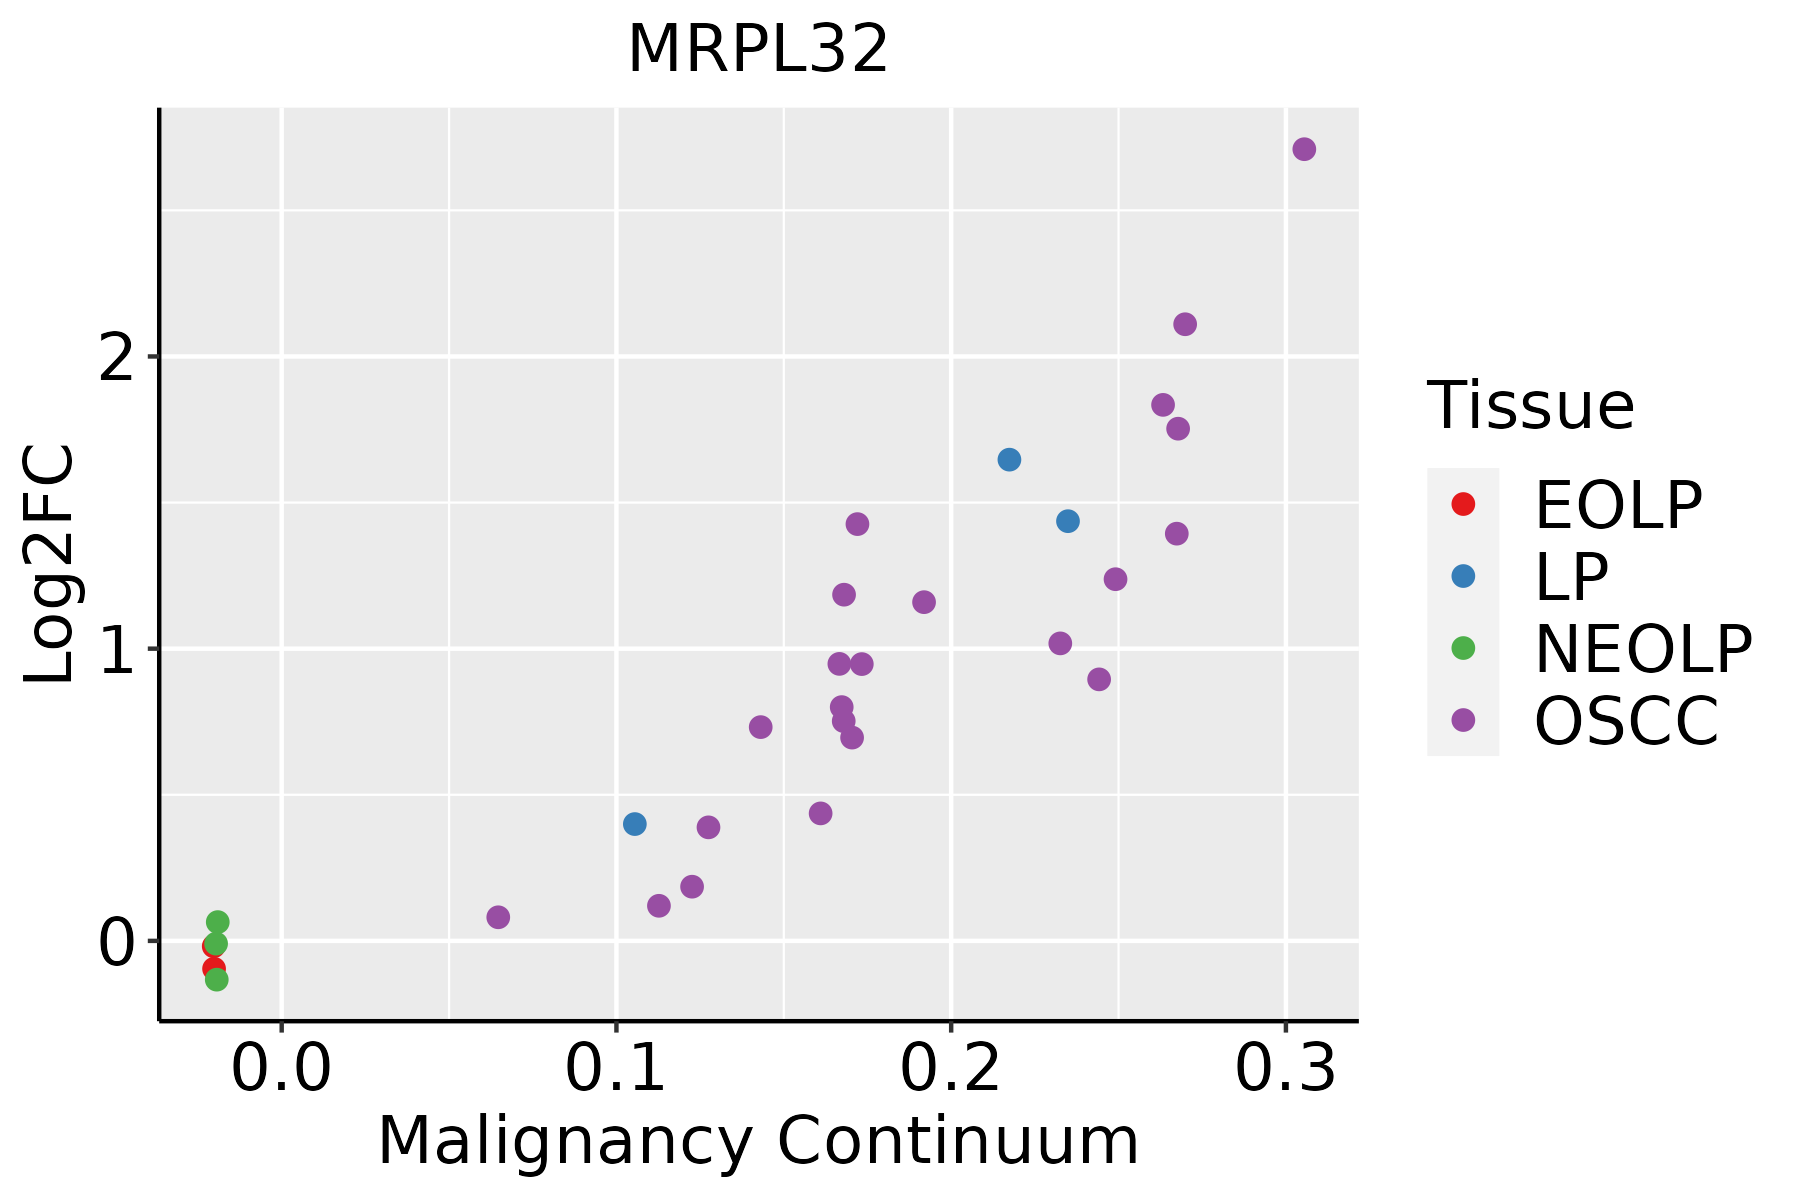 | EOLP: Erosive Oral lichen planus |
| LP: leukoplakia | ||
| NEOLP: Non-erosive oral lichen planus | ||
| OSCC: Oral squamous cell carcinoma | ||
| Prostate | 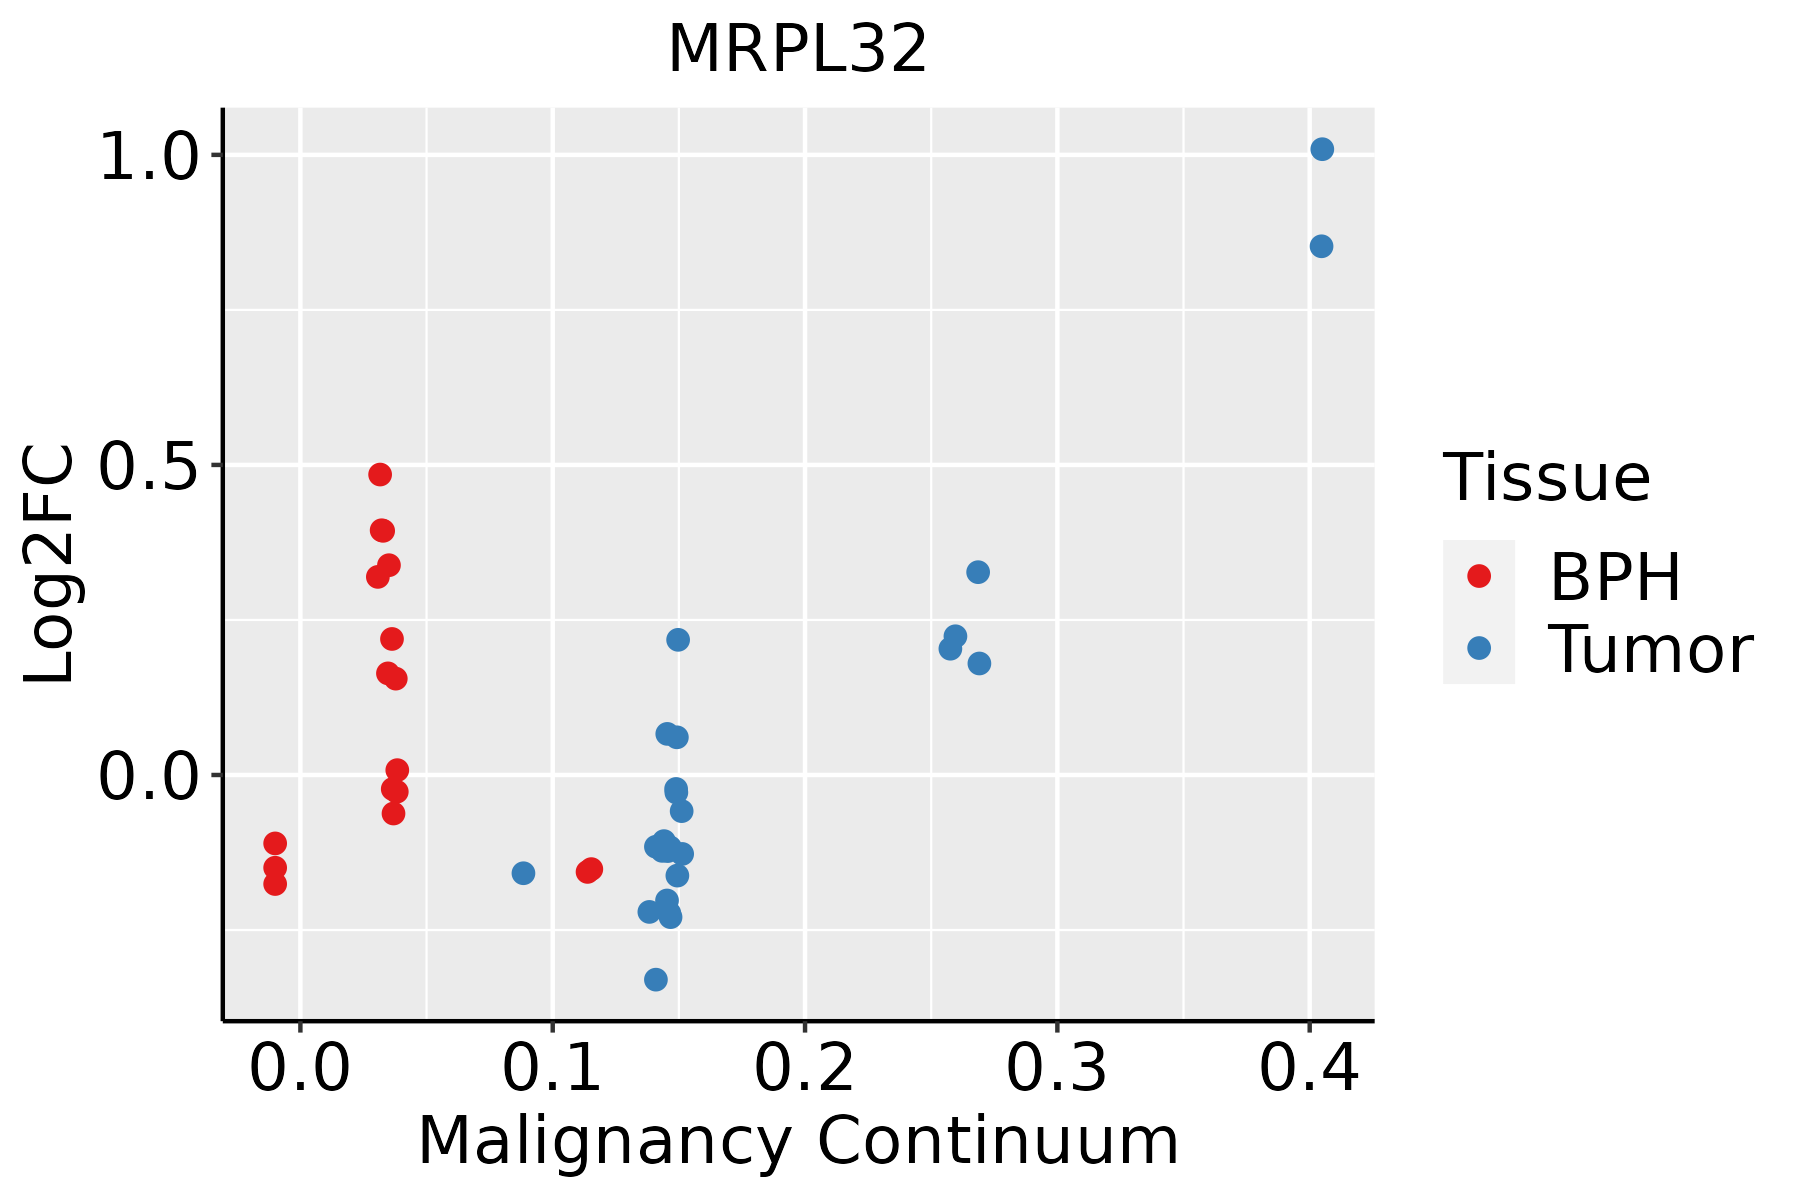 | BPH: Benign Prostatic Hyperplasia |
| Skin | 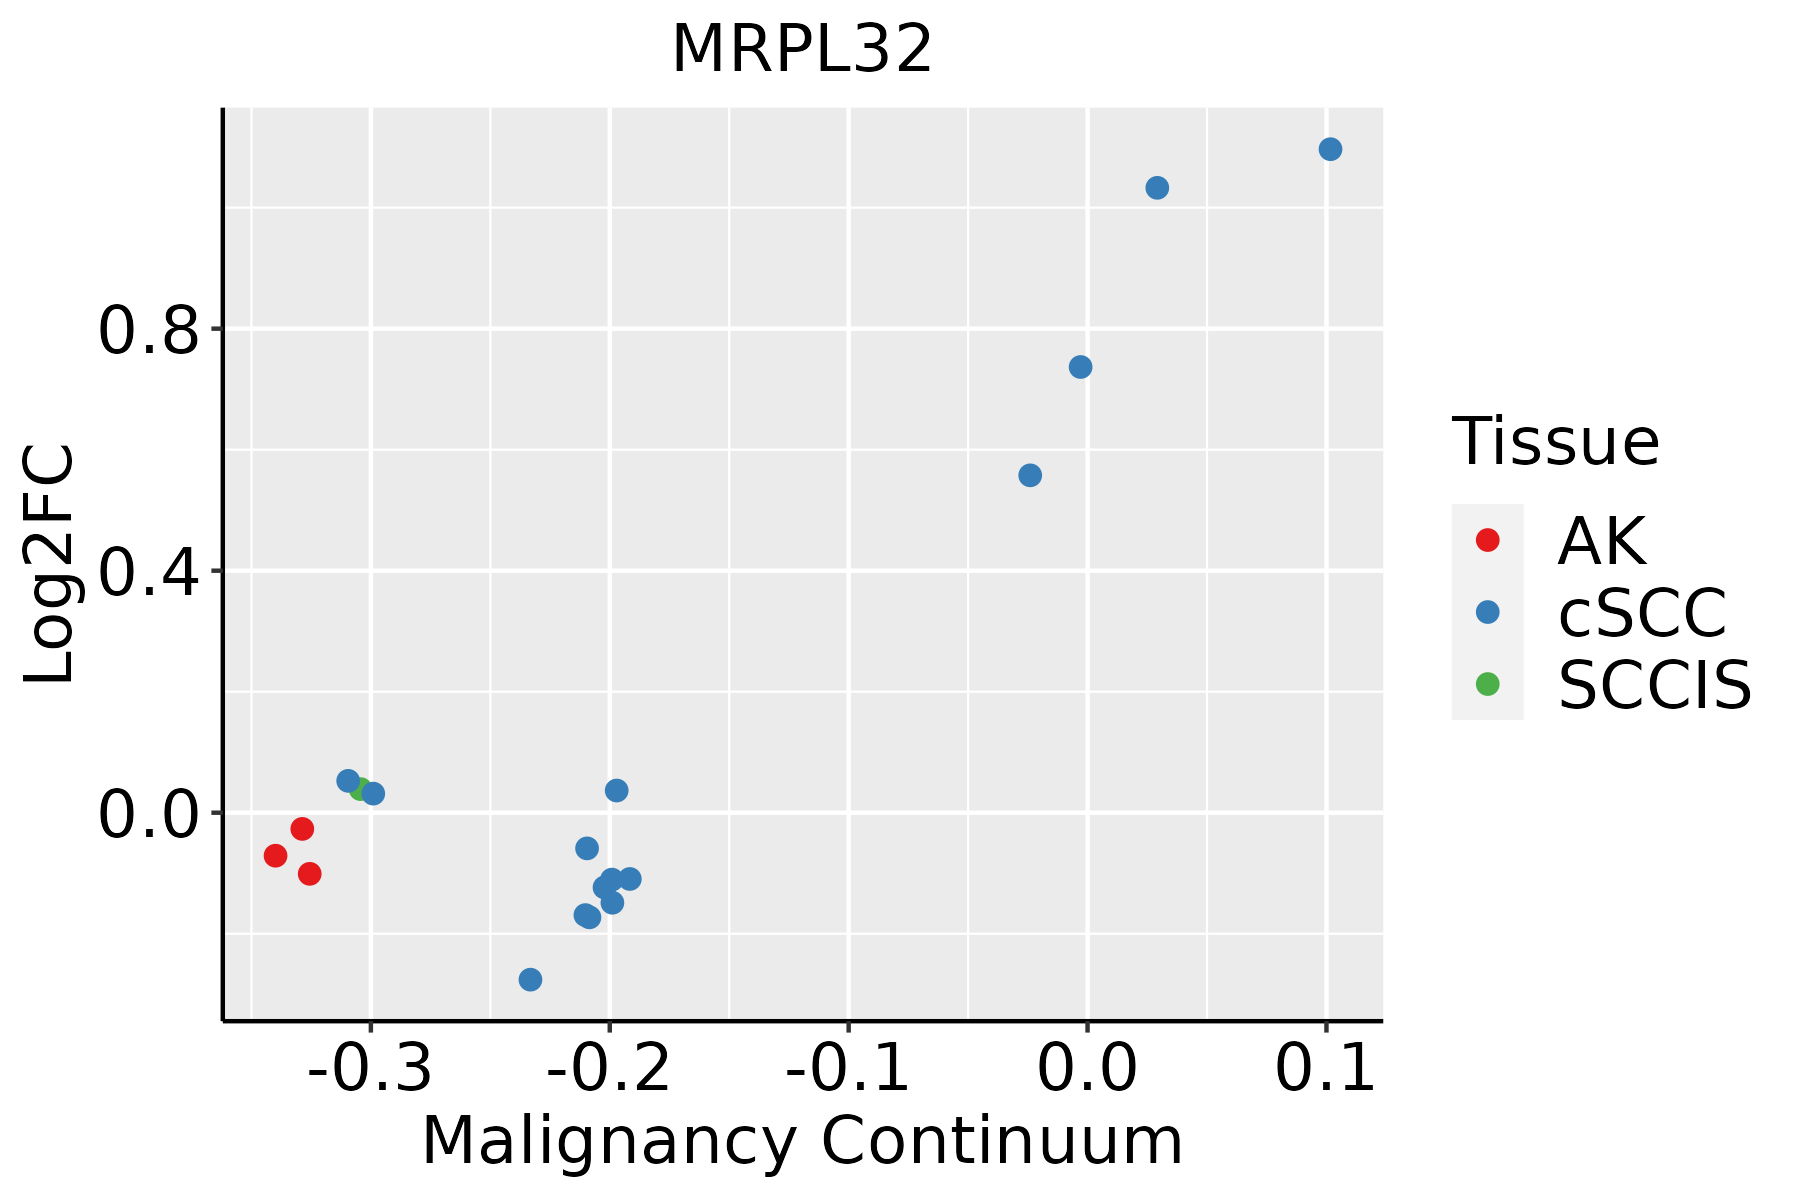 | AK: Actinic keratosis |
| cSCC: Cutaneous squamous cell carcinoma | ||
| SCCIS:squamous cell carcinoma in situ | ||
| Thyroid |  | ATC: Anaplastic thyroid cancer |
| HT: Hashimoto's thyroiditis | ||
| PTC: Papillary thyroid cancer |
| ∗log2FC in expression of this searched gene in stem-like cells from each diseased tissue sample relative to stem-like cells in normal samples in each tissue plotted against the malignancy continuum. Samples are colored based on if they are from different disease stage. |
Top |
Malignant transformation related pathway analysis |
| Find out the enriched GO biological processes and KEGG pathways involved in transition from healthy to precancer to cancer |
| Tissue | Disease Stage | Enriched GO biological Processes |
| Colorectum | AD |  |
| Colorectum | SER |  |
| Colorectum | MSS |  |
| Colorectum | MSI-H |  |
| Colorectum | FAP |  |
| ∗Top 15 enriched GO BP terms are showed in the bar plot of each disease state in each tissue. Each row represents a significant GO biological process which is colored according to the -log10(p.adjust). |
| Page: 1 2 3 4 5 6 7 8 9 |
| GO ID | Tissue | Disease Stage | Description | Gene Ratio | Bg Ratio | pvalue | p.adjust | Count |
| Page: 1 |
| Pathway ID | Tissue | Disease Stage | Description | Gene Ratio | Bg Ratio | pvalue | p.adjust | qvalue | Count |
| hsa03010 | Colorectum | AD | Ribosome | 96/2092 | 167/8465 | 8.28e-20 | 5.54e-18 | 3.54e-18 | 96 |
| hsa030101 | Colorectum | AD | Ribosome | 96/2092 | 167/8465 | 8.28e-20 | 5.54e-18 | 3.54e-18 | 96 |
| hsa030102 | Colorectum | SER | Ribosome | 92/1580 | 167/8465 | 2.21e-26 | 3.66e-24 | 2.66e-24 | 92 |
| hsa030103 | Colorectum | SER | Ribosome | 92/1580 | 167/8465 | 2.21e-26 | 3.66e-24 | 2.66e-24 | 92 |
| hsa030104 | Colorectum | MSS | Ribosome | 96/1875 | 167/8465 | 1.82e-23 | 2.03e-21 | 1.24e-21 | 96 |
| hsa030105 | Colorectum | MSS | Ribosome | 96/1875 | 167/8465 | 1.82e-23 | 2.03e-21 | 1.24e-21 | 96 |
| hsa0301039 | Esophagus | HGIN | Ribosome | 108/1383 | 167/8465 | 1.44e-45 | 4.71e-43 | 3.74e-43 | 108 |
| hsa03010115 | Esophagus | HGIN | Ribosome | 108/1383 | 167/8465 | 1.44e-45 | 4.71e-43 | 3.74e-43 | 108 |
| hsa03010211 | Esophagus | ESCC | Ribosome | 129/4205 | 167/8465 | 1.43e-13 | 3.43e-12 | 1.75e-12 | 129 |
| hsa03010310 | Esophagus | ESCC | Ribosome | 129/4205 | 167/8465 | 1.43e-13 | 3.43e-12 | 1.75e-12 | 129 |
| hsa0301022 | Liver | Cirrhotic | Ribosome | 127/2530 | 167/8465 | 2.12e-35 | 7.06e-33 | 4.35e-33 | 127 |
| hsa0301032 | Liver | Cirrhotic | Ribosome | 127/2530 | 167/8465 | 2.12e-35 | 7.06e-33 | 4.35e-33 | 127 |
| hsa0301042 | Liver | HCC | Ribosome | 128/4020 | 167/8465 | 7.32e-15 | 2.23e-13 | 1.24e-13 | 128 |
| hsa0301052 | Liver | HCC | Ribosome | 128/4020 | 167/8465 | 7.32e-15 | 2.23e-13 | 1.24e-13 | 128 |
| hsa0301030 | Oral cavity | OSCC | Ribosome | 128/3704 | 167/8465 | 2.42e-18 | 1.62e-16 | 8.25e-17 | 128 |
| hsa03010114 | Oral cavity | OSCC | Ribosome | 128/3704 | 167/8465 | 2.42e-18 | 1.62e-16 | 8.25e-17 | 128 |
| hsa03010210 | Oral cavity | LP | Ribosome | 127/2418 | 167/8465 | 1.22e-37 | 4.05e-35 | 2.61e-35 | 127 |
| hsa0301038 | Oral cavity | LP | Ribosome | 127/2418 | 167/8465 | 1.22e-37 | 4.05e-35 | 2.61e-35 | 127 |
| hsa0301028 | Prostate | BPH | Ribosome | 104/1718 | 167/8465 | 8.04e-33 | 1.33e-30 | 8.21e-31 | 104 |
| hsa03010113 | Prostate | BPH | Ribosome | 104/1718 | 167/8465 | 8.04e-33 | 1.33e-30 | 8.21e-31 | 104 |
| Page: 1 2 |
Top |
Cell-cell communication analysis |
| Identification of potential cell-cell interactions between two cell types and their ligand-receptor pairs for different disease states |
| Ligand | Receptor | LRpair | Pathway | Tissue | Disease Stage |
| Page: 1 |
Top |
Single-cell gene regulatory network inference analysis |
| Find out the significant the regulons (TFs) and the target genes of each regulon across cell types for different disease states |
| TF | Cell Type | Tissue | Disease Stage | Target Gene | RSS | Regulon Activity |
| ∗The dot plots of a searched regulon are shown for all cell subpopulations in each disease state of each tissue based on the regulon specific score inferred using pySCENIC and by calculating the average expression. |
| Page: 1 |
Top |
Somatic mutation of malignant transformation related genes |
| Annotation of somatic variants for genes involved in malignant transformation |
| Hugo Symbol | Variant Class | Variant Classification | dbSNP RS | HGVSc | HGVSp | HGVSp Short | SWISSPROT | BIOTYPE | SIFT | PolyPhen | Tumor Sample Barcode | Tissue | Histology | Sex | Age | Stage | Therapy Types | Drugs | Outcome |
| MRPL32 | SNV | Missense_Mutation | rs201769152 | c.49N>T | p.Arg17Trp | p.R17W | Q9BYC8 | protein_coding | deleterious_low_confidence(0.01) | benign(0.425) | TCGA-AC-A62V-01 | Breast | breast invasive carcinoma | Male | <65 | III/IV | Targeted Molecular therapy | denosumab | PD |
| MRPL32 | SNV | Missense_Mutation | rs755480767 | c.32N>T | p.Ser11Leu | p.S11L | Q9BYC8 | protein_coding | tolerated_low_confidence(0.82) | benign(0) | TCGA-BH-A0DI-01 | Breast | breast invasive carcinoma | Female | <65 | I/II | Chemotherapy | adriamycin | CR |
| MRPL32 | insertion | Frame_Shift_Ins | novel | c.470_471insCA | p.Val158ArgfsTer44 | p.V158Rfs*44 | Q9BYC8 | protein_coding | TCGA-AN-A0FN-01 | Breast | breast invasive carcinoma | Female | <65 | I/II | Unknown | Unknown | SD | ||
| MRPL32 | insertion | Frame_Shift_Ins | novel | c.472_473insGCCTTGAAAGAAAAGCTTCCGAGTTAGT | p.Val158GlyfsTer19 | p.V158Gfs*19 | Q9BYC8 | protein_coding | TCGA-AN-A0FN-01 | Breast | breast invasive carcinoma | Female | <65 | I/II | Unknown | Unknown | SD | ||
| MRPL32 | SNV | Missense_Mutation | rs780282413 | c.253C>T | p.Arg85Cys | p.R85C | Q9BYC8 | protein_coding | deleterious(0.01) | benign(0.398) | TCGA-AA-A01R-01 | Colorectum | colon adenocarcinoma | Male | <65 | III/IV | Chemotherapy | 5-fluorouracil | PD |
| MRPL32 | SNV | Missense_Mutation | c.106C>T | p.Pro36Ser | p.P36S | Q9BYC8 | protein_coding | tolerated(0.51) | benign(0.005) | TCGA-D5-6930-01 | Colorectum | colon adenocarcinoma | Male | >=65 | I/II | Unknown | Unknown | SD | |
| MRPL32 | SNV | Missense_Mutation | rs780282413 | c.253N>T | p.Arg85Cys | p.R85C | Q9BYC8 | protein_coding | deleterious(0.01) | benign(0.398) | TCGA-DM-A1D0-01 | Colorectum | colon adenocarcinoma | Female | >=65 | I/II | Unknown | Unknown | SD |
| MRPL32 | SNV | Missense_Mutation | c.532N>A | p.Asp178Asn | p.D178N | Q9BYC8 | protein_coding | tolerated(0.74) | benign(0) | TCGA-DM-A1D6-01 | Colorectum | colon adenocarcinoma | Male | >=65 | I/II | Unknown | Unknown | SD | |
| MRPL32 | SNV | Missense_Mutation | c.322N>A | p.Asp108Asn | p.D108N | Q9BYC8 | protein_coding | deleterious(0.02) | probably_damaging(0.928) | TCGA-G4-6304-01 | Colorectum | colon adenocarcinoma | Female | >=65 | I/II | Chemotherapy | fluorouracil | PD | |
| MRPL32 | SNV | Missense_Mutation | c.50N>C | p.Arg17Pro | p.R17P | Q9BYC8 | protein_coding | tolerated_low_confidence(0.08) | benign(0.003) | TCGA-AF-2687-01 | Colorectum | rectum adenocarcinoma | Male | <65 | III/IV | Chemotherapy | xeloda | PD |
| Page: 1 2 3 |
Top |
Related drugs of malignant transformation related genes |
| Identification of chemicals and drugs interact with genes involved in malignant transfromation |
| (DGIdb 4.0) |
| Entrez ID | Symbol | Category | Interaction Types | Drug Claim Name | Drug Name | PMIDs |
| Page: 1 |

Copyright 2023-Present -The University of Texas Health Science Center at Houston |