
|
|||||
|
 | |
| |
| |
| |
| |
| |
|
Gene: MPV17 |
Gene summary for MPV17 |
| Gene information | Species | Human | Gene symbol | MPV17 | Gene ID | 4358 |
| Gene name | mitochondrial inner membrane protein MPV17 | |
| Gene Alias | CMT2EE | |
| Cytomap | 2p23.3 | |
| Gene Type | protein-coding | GO ID | GO:0000002 | UniProtAcc | A0A0S2Z3Z9 |
Top |
Malignant transformation analysis |
| Identification of the aberrant gene expression in precancerous and cancerous lesions by comparing the gene expression of stem-like cells in diseased tissues with normal stem cells |
| Entrez ID | Symbol | Replicates | Species | Organ | Tissue | Adj P-value | Log2FC | Malignancy |
| 4358 | MPV17 | P91T-E | Human | Esophagus | ESCC | 5.04e-12 | 1.63e+00 | 0.1828 |
| 4358 | MPV17 | P94T-E | Human | Esophagus | ESCC | 1.39e-02 | 2.14e-01 | 0.0879 |
| 4358 | MPV17 | P104T-E | Human | Esophagus | ESCC | 1.91e-02 | 3.98e-01 | 0.0931 |
| 4358 | MPV17 | P107T-E | Human | Esophagus | ESCC | 8.82e-42 | 1.15e+00 | 0.171 |
| 4358 | MPV17 | P126T-E | Human | Esophagus | ESCC | 1.52e-07 | 7.27e-01 | 0.1125 |
| 4358 | MPV17 | P127T-E | Human | Esophagus | ESCC | 1.03e-31 | 5.66e-01 | 0.0826 |
| 4358 | MPV17 | P128T-E | Human | Esophagus | ESCC | 3.06e-34 | 1.20e+00 | 0.1241 |
| 4358 | MPV17 | P130T-E | Human | Esophagus | ESCC | 2.87e-77 | 1.65e+00 | 0.1676 |
| 4358 | MPV17 | HCC1_Meng | Human | Liver | HCC | 3.95e-82 | 2.44e-01 | 0.0246 |
| 4358 | MPV17 | HCC2_Meng | Human | Liver | HCC | 2.20e-11 | -3.18e-02 | 0.0107 |
| 4358 | MPV17 | cirrhotic1 | Human | Liver | Cirrhotic | 9.59e-03 | 1.04e-01 | 0.0202 |
| 4358 | MPV17 | cirrhotic2 | Human | Liver | Cirrhotic | 2.96e-06 | 1.23e-01 | 0.0201 |
| 4358 | MPV17 | cirrhotic3 | Human | Liver | Cirrhotic | 2.02e-07 | 1.09e-01 | 0.0215 |
| 4358 | MPV17 | HCC2 | Human | Liver | HCC | 4.43e-03 | 2.20e+00 | 0.5341 |
| 4358 | MPV17 | Pt13.b | Human | Liver | HCC | 6.22e-09 | 8.74e-02 | 0.0251 |
| 4358 | MPV17 | S014 | Human | Liver | HCC | 1.49e-22 | 8.43e-01 | 0.2254 |
| 4358 | MPV17 | S015 | Human | Liver | HCC | 2.01e-20 | 8.74e-01 | 0.2375 |
| 4358 | MPV17 | S016 | Human | Liver | HCC | 6.23e-30 | 9.33e-01 | 0.2243 |
| 4358 | MPV17 | S027 | Human | Liver | HCC | 2.65e-11 | 1.20e+00 | 0.2446 |
| 4358 | MPV17 | S028 | Human | Liver | HCC | 1.61e-26 | 1.12e+00 | 0.2503 |
| Page: 1 2 3 4 5 6 |
| Tissue | Expression Dynamics | Abbreviation |
| Esophagus | 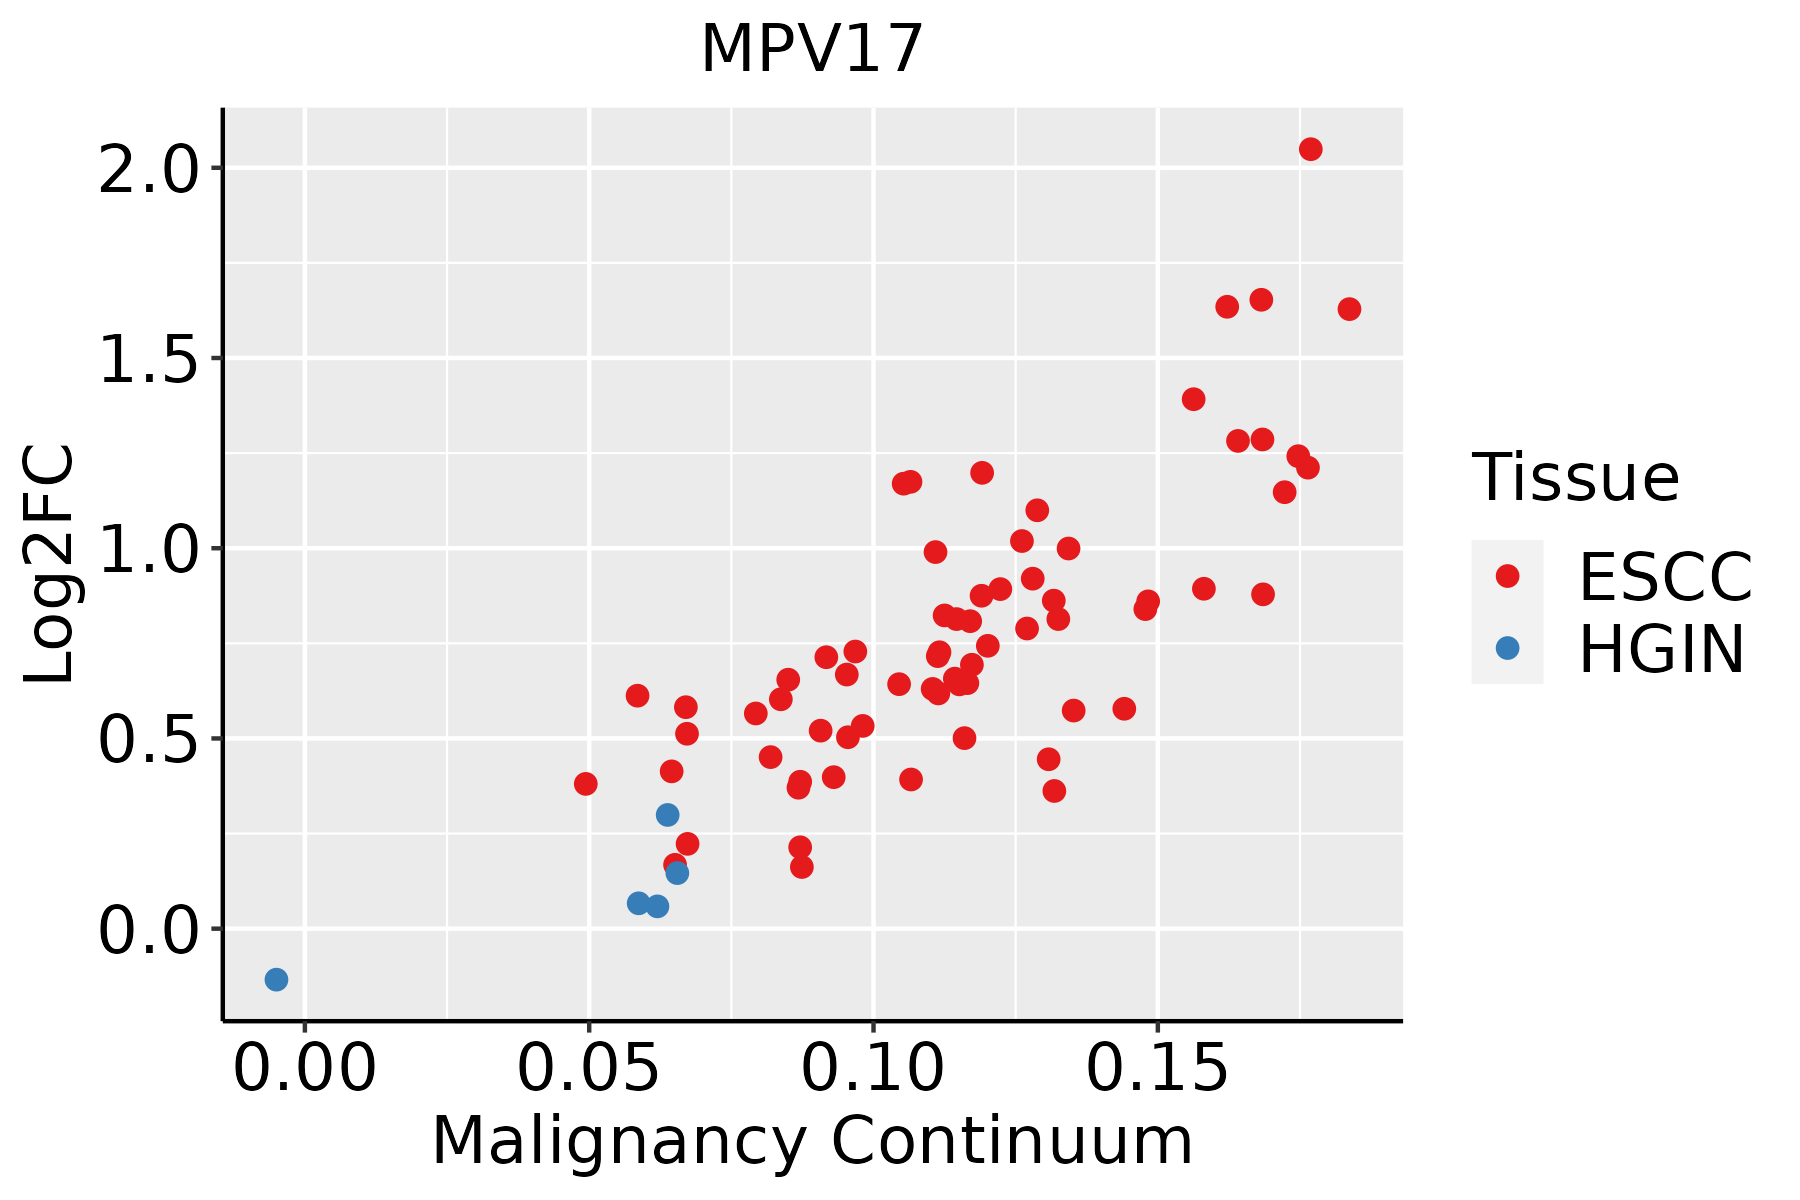 | ESCC: Esophageal squamous cell carcinoma |
| HGIN: High-grade intraepithelial neoplasias | ||
| LGIN: Low-grade intraepithelial neoplasias | ||
| Liver | 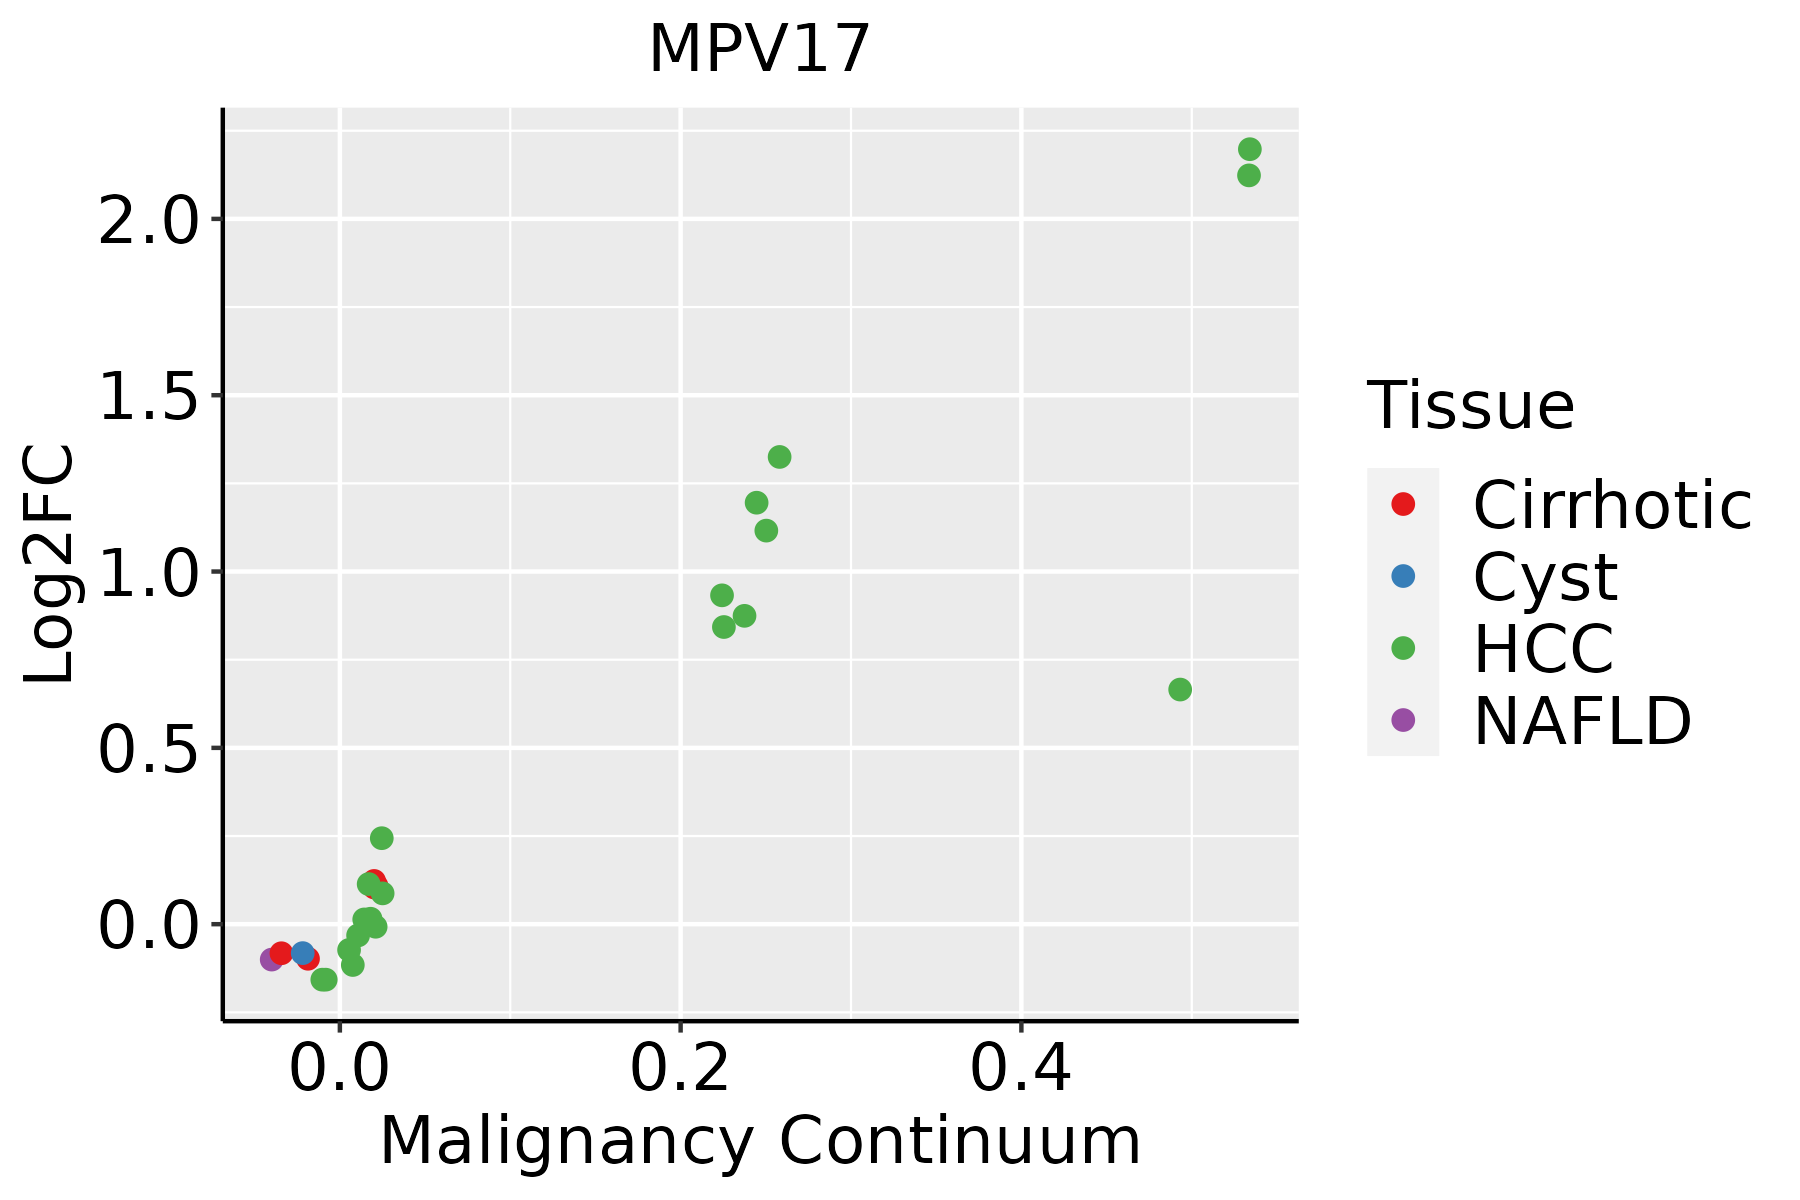 | HCC: Hepatocellular carcinoma |
| NAFLD: Non-alcoholic fatty liver disease | ||
| Oral Cavity | 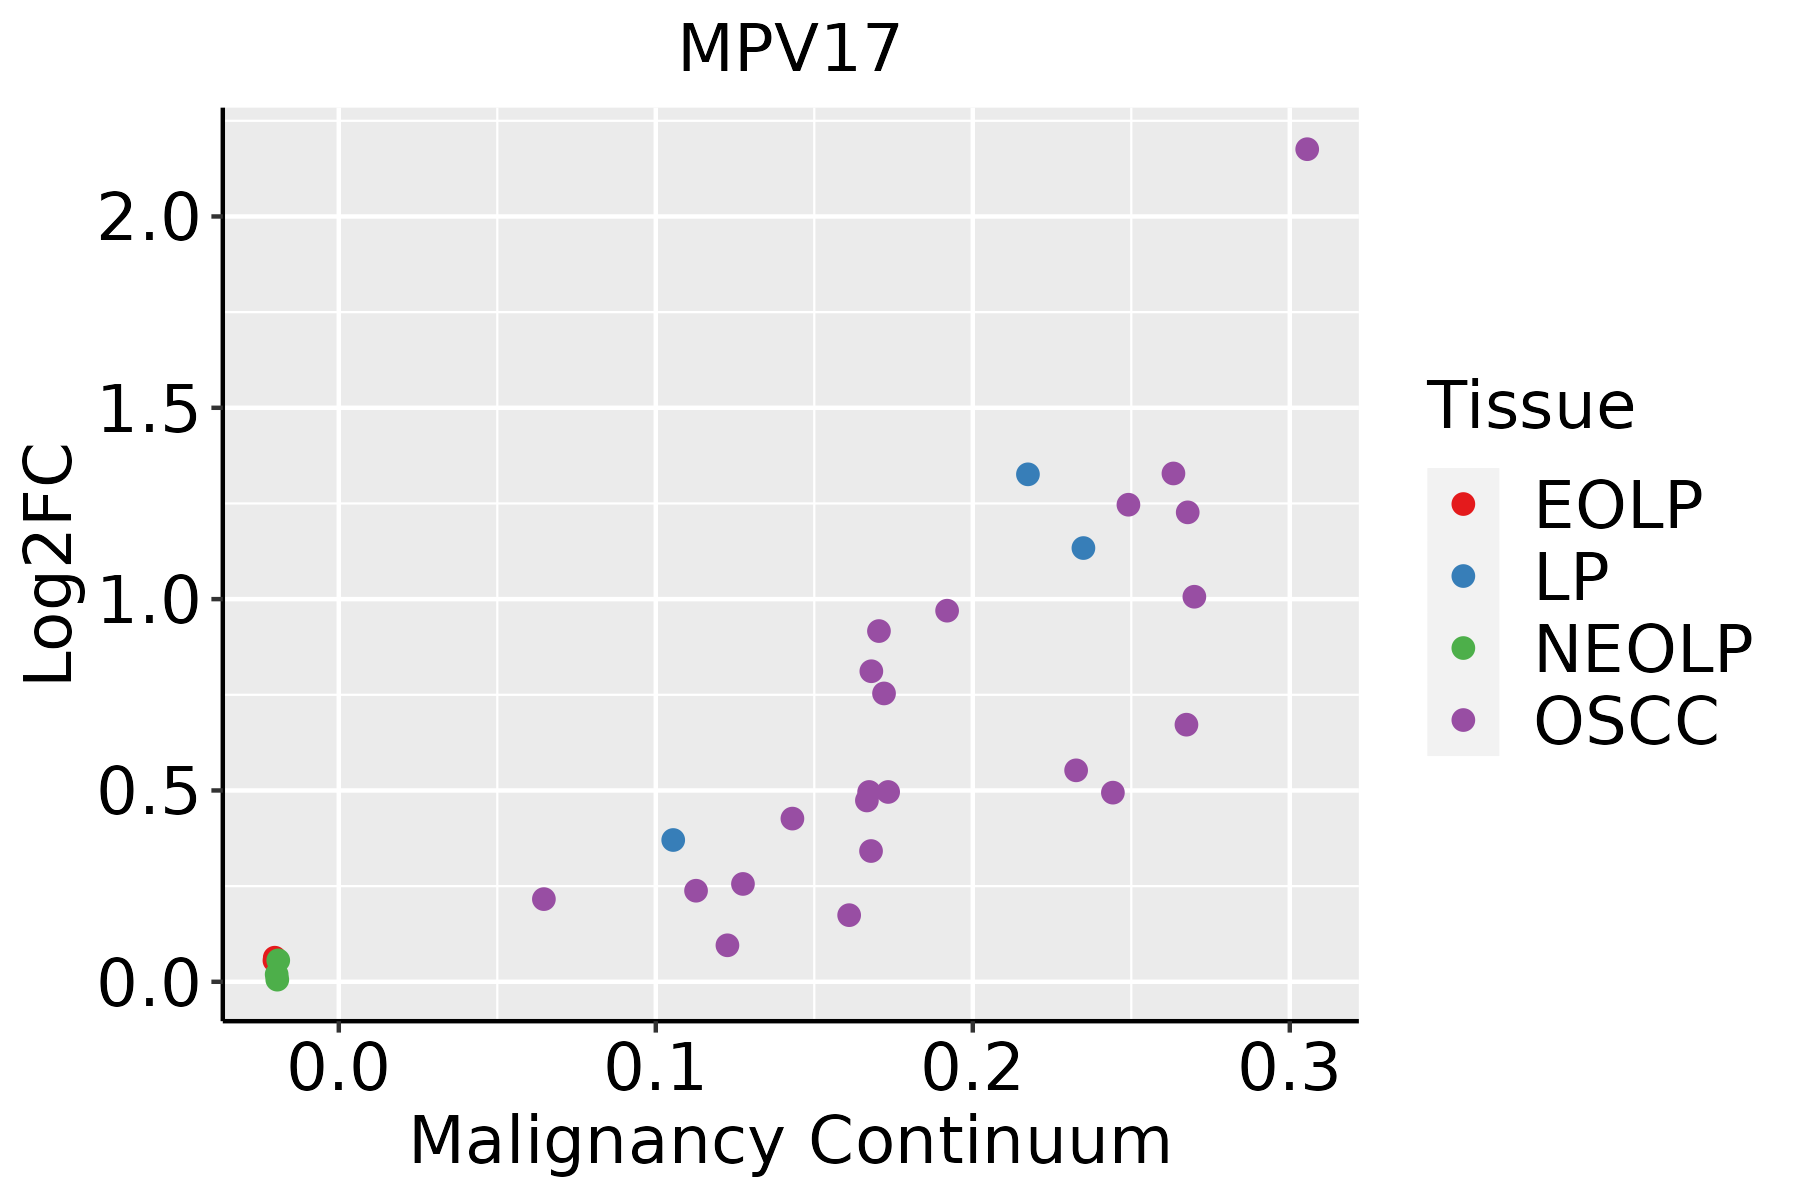 | EOLP: Erosive Oral lichen planus |
| LP: leukoplakia | ||
| NEOLP: Non-erosive oral lichen planus | ||
| OSCC: Oral squamous cell carcinoma | ||
| Skin |  | AK: Actinic keratosis |
| cSCC: Cutaneous squamous cell carcinoma | ||
| SCCIS:squamous cell carcinoma in situ | ||
| Thyroid | 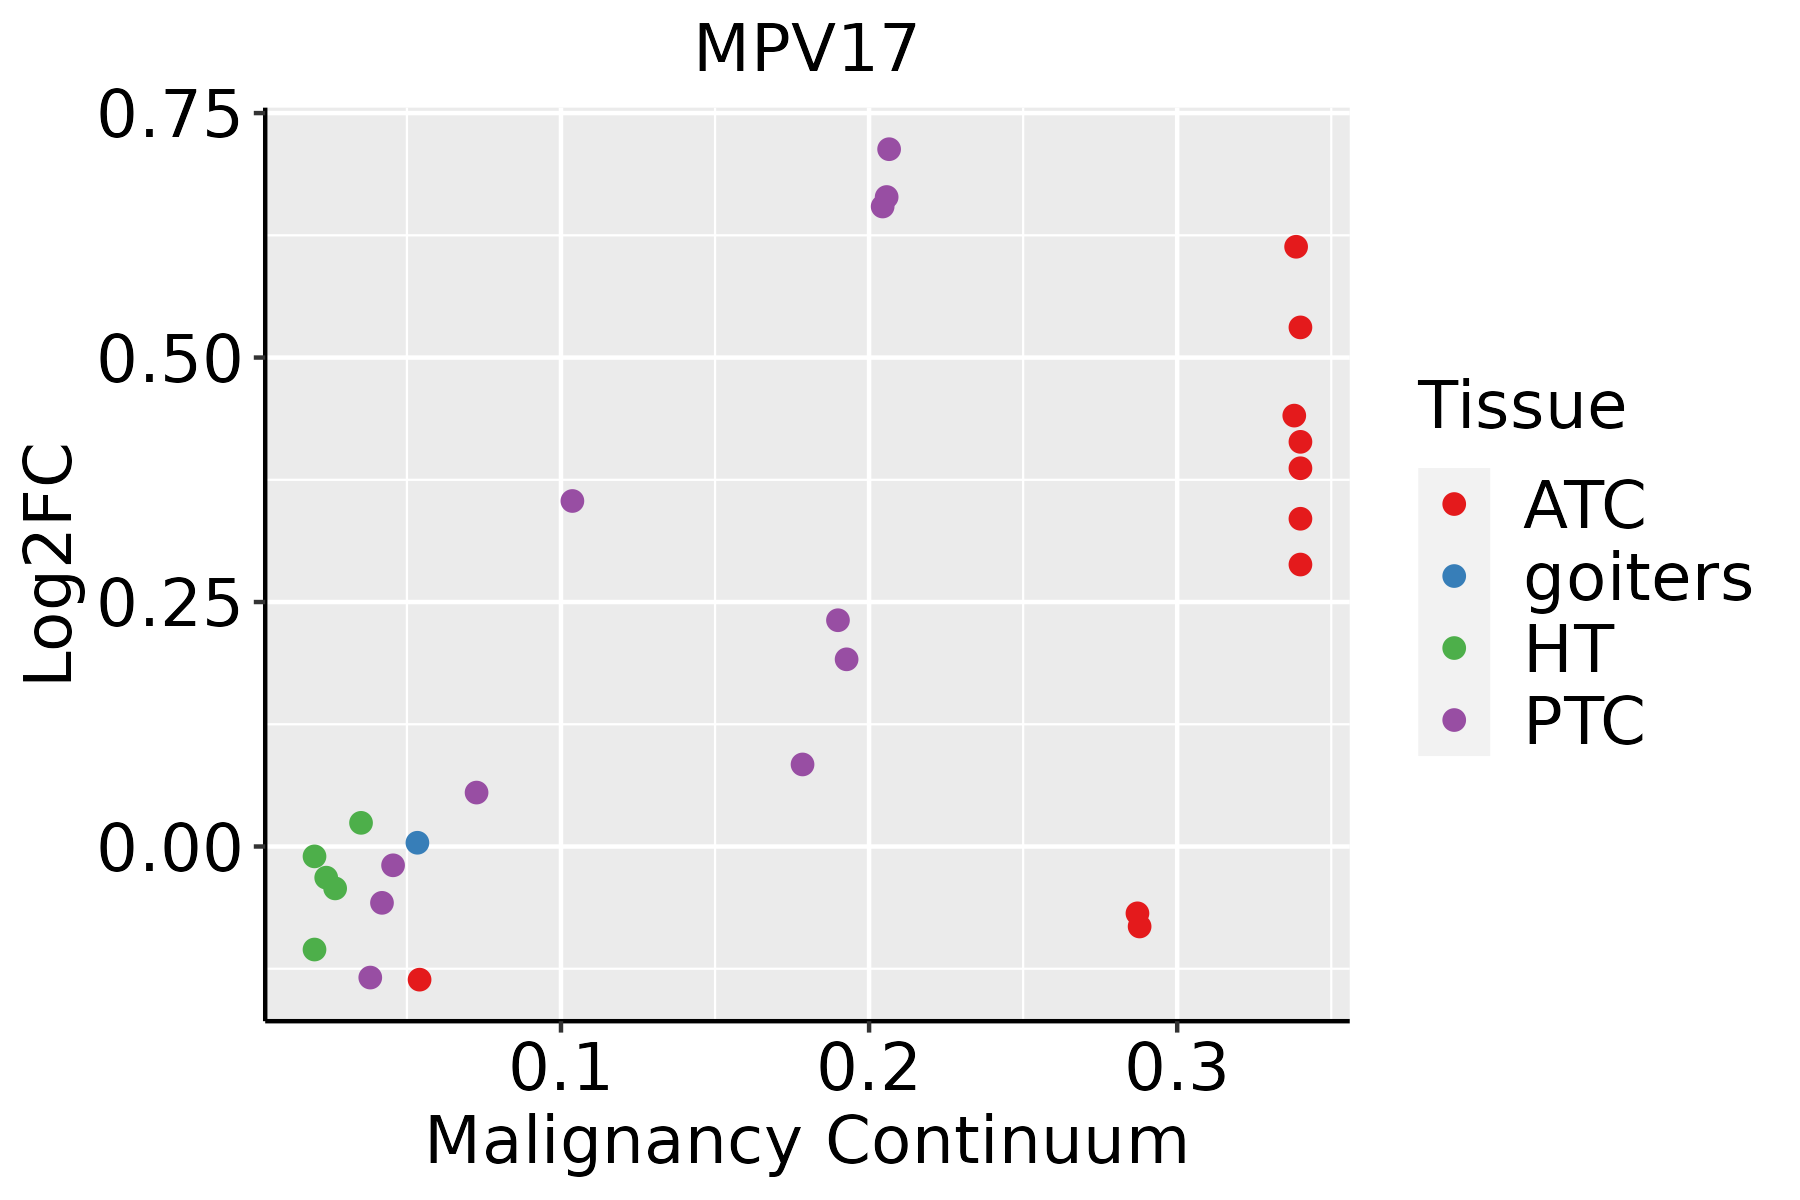 | ATC: Anaplastic thyroid cancer |
| HT: Hashimoto's thyroiditis | ||
| PTC: Papillary thyroid cancer |
| ∗log2FC in expression of this searched gene in stem-like cells from each diseased tissue sample relative to stem-like cells in normal samples in each tissue plotted against the malignancy continuum. Samples are colored based on if they are from different disease stage. |
Top |
Malignant transformation related pathway analysis |
| Find out the enriched GO biological processes and KEGG pathways involved in transition from healthy to precancer to cancer |
| Tissue | Disease Stage | Enriched GO biological Processes |
| Colorectum | AD |  |
| Colorectum | SER |  |
| Colorectum | MSS |  |
| Colorectum | MSI-H |  |
| Colorectum | FAP |  |
| ∗Top 15 enriched GO BP terms are showed in the bar plot of each disease state in each tissue. Each row represents a significant GO biological process which is colored according to the -log10(p.adjust). |
| Page: 1 2 3 4 5 6 7 8 9 |
| GO ID | Tissue | Disease Stage | Description | Gene Ratio | Bg Ratio | pvalue | p.adjust | Count |
| GO:000697927 | Esophagus | HGIN | response to oxidative stress | 107/2587 | 446/18723 | 3.91e-09 | 2.76e-07 | 107 |
| GO:006219727 | Esophagus | HGIN | cellular response to chemical stress | 76/2587 | 337/18723 | 8.00e-06 | 2.41e-04 | 76 |
| GO:005105214 | Esophagus | HGIN | regulation of DNA metabolic process | 79/2587 | 359/18723 | 1.38e-05 | 3.85e-04 | 79 |
| GO:003459926 | Esophagus | HGIN | cellular response to oxidative stress | 65/2587 | 288/18723 | 3.42e-05 | 8.66e-04 | 65 |
| GO:000030226 | Esophagus | HGIN | response to reactive oxygen species | 52/2587 | 222/18723 | 7.30e-05 | 1.66e-03 | 52 |
| GO:0022613111 | Esophagus | ESCC | ribonucleoprotein complex biogenesis | 365/8552 | 463/18723 | 1.74e-49 | 1.11e-45 | 365 |
| GO:0042254111 | Esophagus | ESCC | ribosome biogenesis | 252/8552 | 299/18723 | 3.27e-44 | 1.04e-40 | 252 |
| GO:2001233111 | Esophagus | ESCC | regulation of apoptotic signaling pathway | 256/8552 | 356/18723 | 4.11e-24 | 1.04e-21 | 256 |
| GO:0006979111 | Esophagus | ESCC | response to oxidative stress | 303/8552 | 446/18723 | 7.15e-22 | 1.30e-19 | 303 |
| GO:0006839110 | Esophagus | ESCC | mitochondrial transport | 187/8552 | 254/18723 | 8.35e-20 | 9.81e-18 | 187 |
| GO:0062197111 | Esophagus | ESCC | cellular response to chemical stress | 234/8552 | 337/18723 | 5.37e-19 | 5.97e-17 | 234 |
| GO:014005313 | Esophagus | ESCC | mitochondrial gene expression | 93/8552 | 108/18723 | 1.96e-18 | 2.03e-16 | 93 |
| GO:0006417111 | Esophagus | ESCC | regulation of translation | 304/8552 | 468/18723 | 1.53e-17 | 1.33e-15 | 304 |
| GO:003254314 | Esophagus | ESCC | mitochondrial translation | 68/8552 | 76/18723 | 1.02e-15 | 6.86e-14 | 68 |
| GO:2001234111 | Esophagus | ESCC | negative regulation of apoptotic signaling pathway | 161/8552 | 224/18723 | 1.24e-15 | 8.09e-14 | 161 |
| GO:0045727111 | Esophagus | ESCC | positive regulation of translation | 107/8552 | 136/18723 | 2.79e-15 | 1.68e-13 | 107 |
| GO:0034250111 | Esophagus | ESCC | positive regulation of cellular amide metabolic process | 123/8552 | 162/18723 | 3.32e-15 | 1.93e-13 | 123 |
| GO:0034599111 | Esophagus | ESCC | cellular response to oxidative stress | 197/8552 | 288/18723 | 3.76e-15 | 2.15e-13 | 197 |
| GO:000700619 | Esophagus | ESCC | mitochondrial membrane organization | 93/8552 | 116/18723 | 2.16e-14 | 1.11e-12 | 93 |
| GO:005105215 | Esophagus | ESCC | regulation of DNA metabolic process | 232/8552 | 359/18723 | 2.40e-13 | 1.13e-11 | 232 |
| Page: 1 2 3 4 5 6 7 8 |
| Pathway ID | Tissue | Disease Stage | Description | Gene Ratio | Bg Ratio | pvalue | p.adjust | qvalue | Count |
| hsa041467 | Esophagus | ESCC | Peroxisome | 55/4205 | 82/8465 | 1.04e-03 | 3.27e-03 | 1.68e-03 | 55 |
| hsa0414612 | Esophagus | ESCC | Peroxisome | 55/4205 | 82/8465 | 1.04e-03 | 3.27e-03 | 1.68e-03 | 55 |
| hsa041462 | Liver | Cirrhotic | Peroxisome | 36/2530 | 82/8465 | 4.79e-03 | 1.74e-02 | 1.07e-02 | 36 |
| hsa041463 | Liver | Cirrhotic | Peroxisome | 36/2530 | 82/8465 | 4.79e-03 | 1.74e-02 | 1.07e-02 | 36 |
| hsa041464 | Liver | HCC | Peroxisome | 58/4020 | 82/8465 | 1.57e-05 | 1.05e-04 | 5.85e-05 | 58 |
| hsa041465 | Liver | HCC | Peroxisome | 58/4020 | 82/8465 | 1.57e-05 | 1.05e-04 | 5.85e-05 | 58 |
| hsa041466 | Oral cavity | OSCC | Peroxisome | 47/3704 | 82/8465 | 9.01e-03 | 2.01e-02 | 1.03e-02 | 47 |
| hsa0414611 | Oral cavity | OSCC | Peroxisome | 47/3704 | 82/8465 | 9.01e-03 | 2.01e-02 | 1.03e-02 | 47 |
| hsa0414621 | Oral cavity | LP | Peroxisome | 33/2418 | 82/8465 | 1.48e-02 | 4.69e-02 | 3.03e-02 | 33 |
| hsa0414631 | Oral cavity | LP | Peroxisome | 33/2418 | 82/8465 | 1.48e-02 | 4.69e-02 | 3.03e-02 | 33 |
| Page: 1 |
Top |
Cell-cell communication analysis |
| Identification of potential cell-cell interactions between two cell types and their ligand-receptor pairs for different disease states |
| Ligand | Receptor | LRpair | Pathway | Tissue | Disease Stage |
| Page: 1 |
Top |
Single-cell gene regulatory network inference analysis |
| Find out the significant the regulons (TFs) and the target genes of each regulon across cell types for different disease states |
| TF | Cell Type | Tissue | Disease Stage | Target Gene | RSS | Regulon Activity |
| ∗The dot plots of a searched regulon are shown for all cell subpopulations in each disease state of each tissue based on the regulon specific score inferred using pySCENIC and by calculating the average expression. |
| Page: 1 |
Top |
Somatic mutation of malignant transformation related genes |
| Annotation of somatic variants for genes involved in malignant transformation |
| Hugo Symbol | Variant Class | Variant Classification | dbSNP RS | HGVSc | HGVSp | HGVSp Short | SWISSPROT | BIOTYPE | SIFT | PolyPhen | Tumor Sample Barcode | Tissue | Histology | Sex | Age | Stage | Therapy Types | Drugs | Outcome |
| MPV17 | SNV | Missense_Mutation | novel | c.526N>A | p.Leu176Ile | p.L176I | P39210 | protein_coding | tolerated_low_confidence(0.26) | benign(0.007) | TCGA-A2-A25A-01 | Breast | breast invasive carcinoma | Female | <65 | I/II | Unspecific | Cytoxan | SD |
| MPV17 | SNV | Missense_Mutation | rs773077701 | c.469N>A | p.Val157Ile | p.V157I | P39210 | protein_coding | deleterious(0.05) | benign(0.077) | TCGA-AR-A0TY-01 | Breast | breast invasive carcinoma | Female | <65 | I/II | Unspecific | Paclitaxel | PD |
| MPV17 | SNV | Missense_Mutation | novel | c.377A>G | p.Asp126Gly | p.D126G | P39210 | protein_coding | tolerated(0.12) | possibly_damaging(0.867) | TCGA-DS-A1OB-01 | Cervix | cervical & endocervical cancer | Female | <65 | I/II | Chemotherapy | carboplatin | PD |
| MPV17 | SNV | Missense_Mutation | novel | c.313N>A | p.Leu105Ile | p.L105I | P39210 | protein_coding | tolerated(0.11) | benign(0.132) | TCGA-AZ-4315-01 | Colorectum | colon adenocarcinoma | Male | <65 | I/II | Unknown | Unknown | SD |
| MPV17 | insertion | In_Frame_Ins | novel | c.430_431insTCT | p.Ala144delinsValSer | p.A144delinsVS | P39210 | protein_coding | TCGA-AM-5820-01 | Colorectum | colon adenocarcinoma | Female | <65 | I/II | Unknown | Unknown | SD | ||
| MPV17 | deletion | Frame_Shift_Del | rs886044454 | c.284delN | p.Gly95AlafsTer7 | p.G95Afs*7 | P39210 | protein_coding | TCGA-AZ-6598-01 | Colorectum | colon adenocarcinoma | Female | >=65 | I/II | Unknown | Unknown | SD | ||
| MPV17 | SNV | Missense_Mutation | novel | c.524N>T | p.Arg175Leu | p.R175L | P39210 | protein_coding | deleterious(0) | possibly_damaging(0.469) | TCGA-AP-A0LM-01 | Endometrium | uterine corpus endometrioid carcinoma | Female | <65 | III/IV | Chemotherapy | cisplatin | SD |
| MPV17 | SNV | Missense_Mutation | rs746180658 | c.524N>A | p.Arg175Gln | p.R175Q | P39210 | protein_coding | tolerated(0.16) | benign(0.006) | TCGA-AX-A06F-01 | Endometrium | uterine corpus endometrioid carcinoma | Female | <65 | III/IV | Chemotherapy | carboplatin | SD |
| MPV17 | SNV | Missense_Mutation | novel | c.467C>T | p.Ala156Val | p.A156V | P39210 | protein_coding | tolerated(0.33) | benign(0.03) | TCGA-AX-A2HD-01 | Endometrium | uterine corpus endometrioid carcinoma | Female | >=65 | III/IV | Unknown | Unknown | SD |
| MPV17 | SNV | Missense_Mutation | rs370061168 | c.223C>T | p.Arg75Trp | p.R75W | P39210 | protein_coding | tolerated(0.1) | benign(0.044) | TCGA-BS-A0UV-01 | Endometrium | uterine corpus endometrioid carcinoma | Female | <65 | III/IV | Unknown | Unknown | SD |
| Page: 1 2 |
Top |
Related drugs of malignant transformation related genes |
| Identification of chemicals and drugs interact with genes involved in malignant transfromation |
| (DGIdb 4.0) |
| Entrez ID | Symbol | Category | Interaction Types | Drug Claim Name | Drug Name | PMIDs |
| Page: 1 |

Copyright 2023-Present -The University of Texas Health Science Center at Houston |