
|
|||||
|
 | |
| |
| |
| |
| |
| |
|
Gene: MFSD14B |
Gene summary for MFSD14B |
| Gene information | Species | Human | Gene symbol | MFSD14B | Gene ID | 84641 |
| Gene name | major facilitator superfamily domain containing 14B | |
| Gene Alias | HIATL1 | |
| Cytomap | 9q22.32 | |
| Gene Type | protein-coding | GO ID | GO:0006810 | UniProtAcc | Q5SR56 |
Top |
Malignant transformation analysis |
| Identification of the aberrant gene expression in precancerous and cancerous lesions by comparing the gene expression of stem-like cells in diseased tissues with normal stem cells |
| Entrez ID | Symbol | Replicates | Species | Organ | Tissue | Adj P-value | Log2FC | Malignancy |
| 84641 | MFSD14B | P27T-E | Human | Esophagus | ESCC | 5.84e-15 | 7.38e-02 | 0.1055 |
| 84641 | MFSD14B | P28T-E | Human | Esophagus | ESCC | 1.32e-13 | 2.27e-01 | 0.1149 |
| 84641 | MFSD14B | P30T-E | Human | Esophagus | ESCC | 1.46e-22 | 6.86e-01 | 0.137 |
| 84641 | MFSD14B | P31T-E | Human | Esophagus | ESCC | 3.31e-21 | 2.44e-01 | 0.1251 |
| 84641 | MFSD14B | P32T-E | Human | Esophagus | ESCC | 2.45e-07 | 2.11e-01 | 0.1666 |
| 84641 | MFSD14B | P36T-E | Human | Esophagus | ESCC | 1.60e-06 | 2.91e-01 | 0.1187 |
| 84641 | MFSD14B | P37T-E | Human | Esophagus | ESCC | 2.16e-13 | 3.42e-01 | 0.1371 |
| 84641 | MFSD14B | P39T-E | Human | Esophagus | ESCC | 1.85e-14 | 3.33e-01 | 0.0894 |
| 84641 | MFSD14B | P40T-E | Human | Esophagus | ESCC | 5.85e-08 | 2.83e-01 | 0.109 |
| 84641 | MFSD14B | P42T-E | Human | Esophagus | ESCC | 7.33e-05 | 1.49e-01 | 0.1175 |
| 84641 | MFSD14B | P44T-E | Human | Esophagus | ESCC | 2.91e-08 | 5.80e-02 | 0.1096 |
| 84641 | MFSD14B | P47T-E | Human | Esophagus | ESCC | 7.85e-21 | 2.05e-01 | 0.1067 |
| 84641 | MFSD14B | P48T-E | Human | Esophagus | ESCC | 2.72e-03 | 1.15e-01 | 0.0959 |
| 84641 | MFSD14B | P49T-E | Human | Esophagus | ESCC | 1.88e-03 | 3.22e-01 | 0.1768 |
| 84641 | MFSD14B | P52T-E | Human | Esophagus | ESCC | 5.97e-12 | 2.67e-01 | 0.1555 |
| 84641 | MFSD14B | P54T-E | Human | Esophagus | ESCC | 8.50e-07 | 1.95e-01 | 0.0975 |
| 84641 | MFSD14B | P56T-E | Human | Esophagus | ESCC | 5.47e-06 | 7.19e-01 | 0.1613 |
| 84641 | MFSD14B | P57T-E | Human | Esophagus | ESCC | 6.53e-15 | 1.02e-01 | 0.0926 |
| 84641 | MFSD14B | P61T-E | Human | Esophagus | ESCC | 5.27e-05 | 1.86e-01 | 0.099 |
| 84641 | MFSD14B | P62T-E | Human | Esophagus | ESCC | 1.49e-16 | 2.61e-01 | 0.1302 |
| Page: 1 2 3 4 5 6 7 |
| Tissue | Expression Dynamics | Abbreviation |
| Cervix | 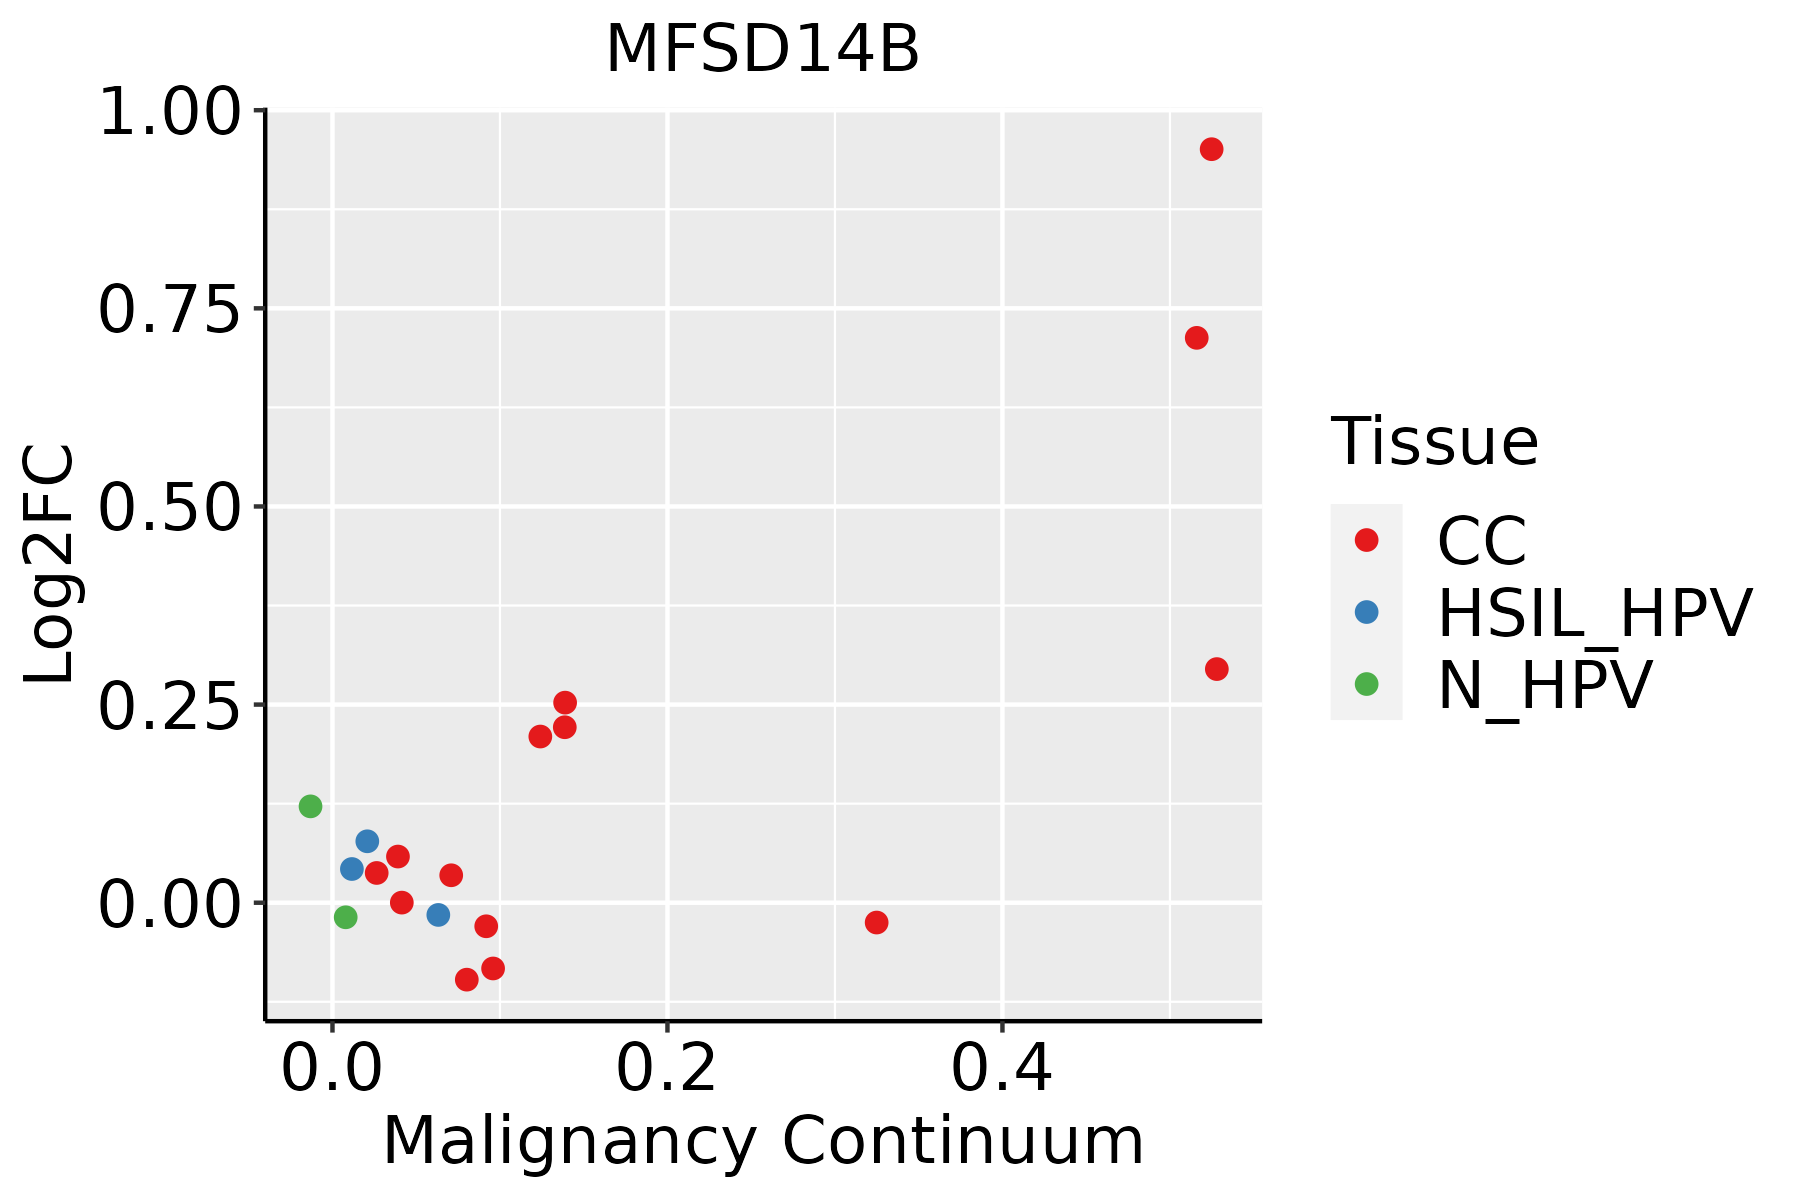 | CC: Cervix cancer |
| HSIL_HPV: HPV-infected high-grade squamous intraepithelial lesions | ||
| N_HPV: HPV-infected normal cervix | ||
| Colorectum (GSE201348) |  | FAP: Familial adenomatous polyposis |
| CRC: Colorectal cancer | ||
| Colorectum (HTA11) |  | AD: Adenomas |
| SER: Sessile serrated lesions | ||
| MSI-H: Microsatellite-high colorectal cancer | ||
| MSS: Microsatellite stable colorectal cancer | ||
| Esophagus |  | ESCC: Esophageal squamous cell carcinoma |
| HGIN: High-grade intraepithelial neoplasias | ||
| LGIN: Low-grade intraepithelial neoplasias | ||
| Oral Cavity |  | EOLP: Erosive Oral lichen planus |
| LP: leukoplakia | ||
| NEOLP: Non-erosive oral lichen planus | ||
| OSCC: Oral squamous cell carcinoma | ||
| Thyroid | 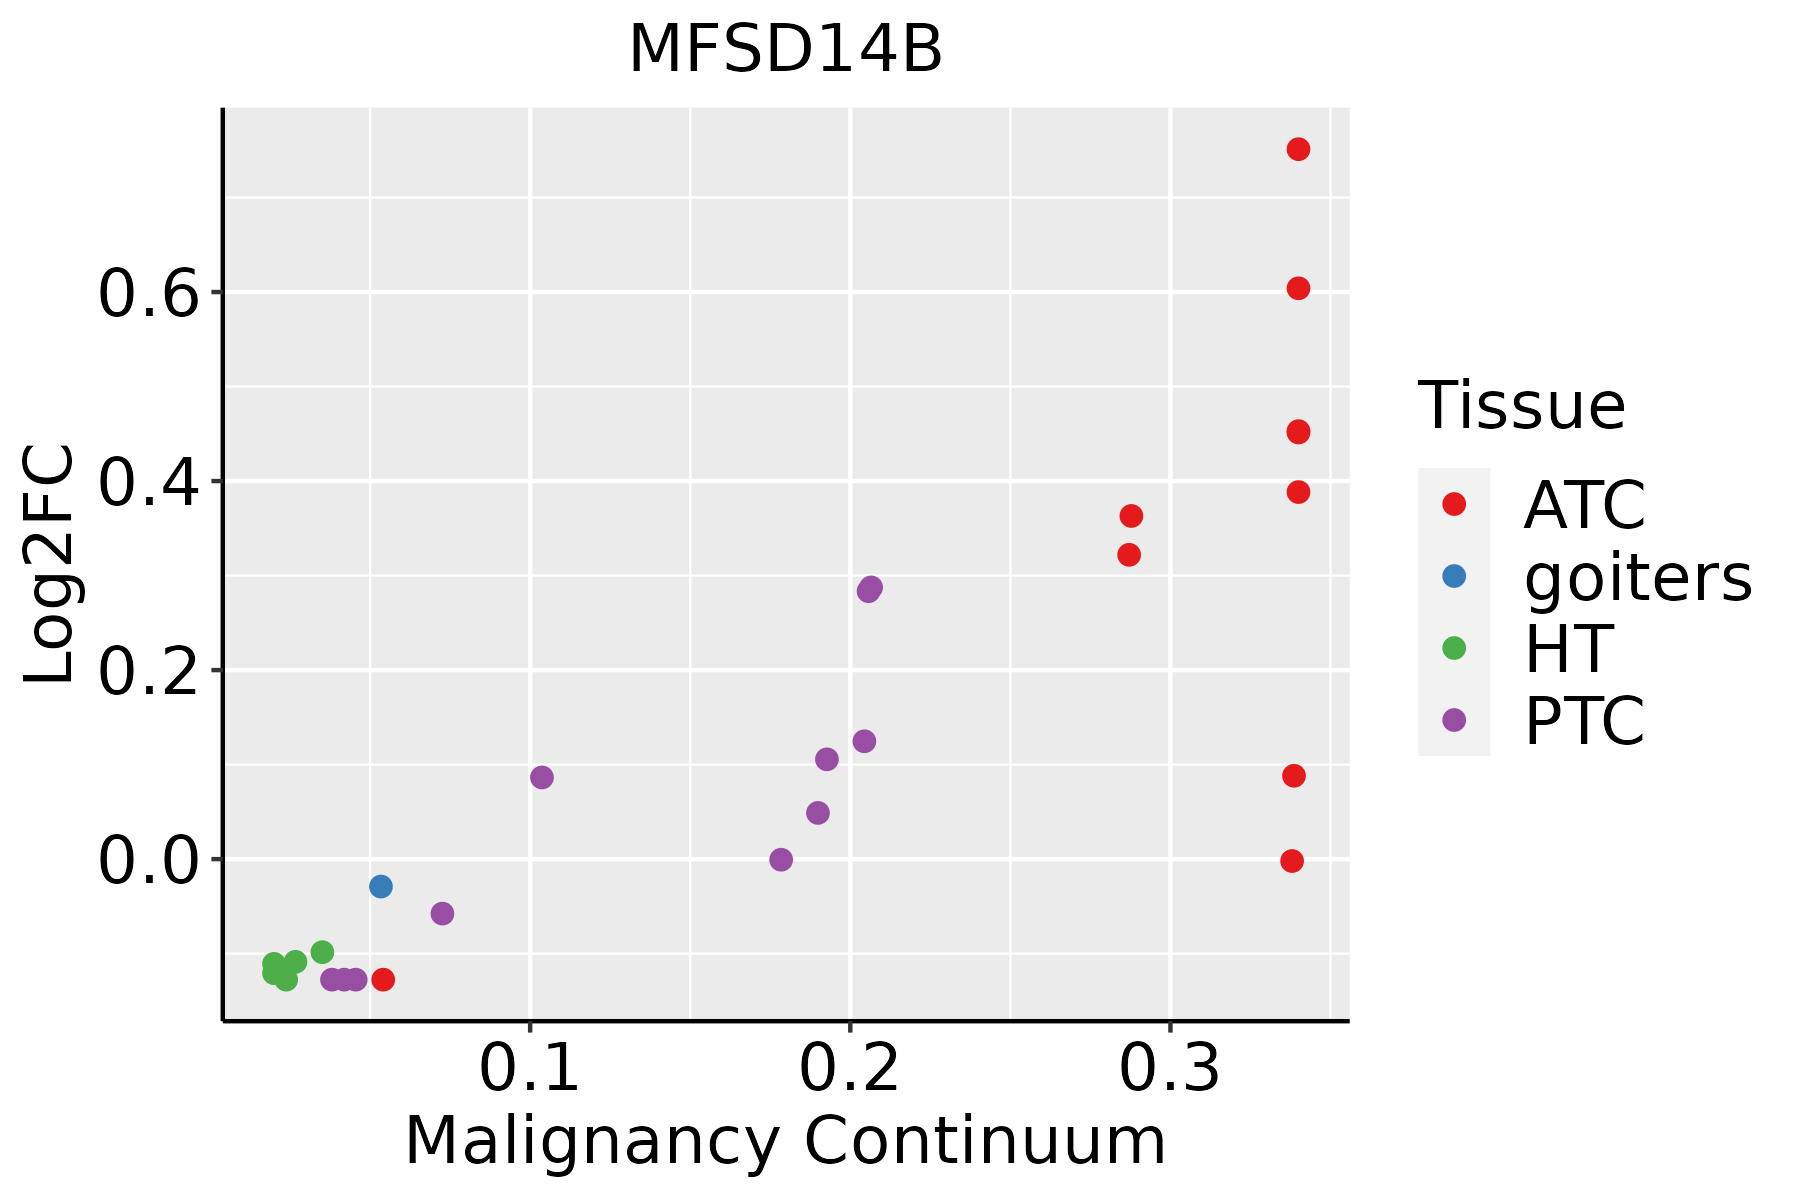 | ATC: Anaplastic thyroid cancer |
| HT: Hashimoto's thyroiditis | ||
| PTC: Papillary thyroid cancer |
| ∗log2FC in expression of this searched gene in stem-like cells from each diseased tissue sample relative to stem-like cells in normal samples in each tissue plotted against the malignancy continuum. Samples are colored based on if they are from different disease stage. |
Top |
Malignant transformation related pathway analysis |
| Find out the enriched GO biological processes and KEGG pathways involved in transition from healthy to precancer to cancer |
| Tissue | Disease Stage | Enriched GO biological Processes |
| Colorectum | AD |  |
| Colorectum | SER |  |
| Colorectum | MSS |  |
| Colorectum | MSI-H |  |
| Colorectum | FAP |  |
| ∗Top 15 enriched GO BP terms are showed in the bar plot of each disease state in each tissue. Each row represents a significant GO biological process which is colored according to the -log10(p.adjust). |
| Page: 1 2 3 4 5 6 7 8 9 |
| GO ID | Tissue | Disease Stage | Description | Gene Ratio | Bg Ratio | pvalue | p.adjust | Count |
| Page: 1 |
| Pathway ID | Tissue | Disease Stage | Description | Gene Ratio | Bg Ratio | pvalue | p.adjust | qvalue | Count |
| Page: 1 |
Top |
Cell-cell communication analysis |
| Identification of potential cell-cell interactions between two cell types and their ligand-receptor pairs for different disease states |
| Ligand | Receptor | LRpair | Pathway | Tissue | Disease Stage |
| Page: 1 |
Top |
Single-cell gene regulatory network inference analysis |
| Find out the significant the regulons (TFs) and the target genes of each regulon across cell types for different disease states |
| TF | Cell Type | Tissue | Disease Stage | Target Gene | RSS | Regulon Activity |
| ∗The dot plots of a searched regulon are shown for all cell subpopulations in each disease state of each tissue based on the regulon specific score inferred using pySCENIC and by calculating the average expression. |
| Page: 1 |
Top |
Somatic mutation of malignant transformation related genes |
| Annotation of somatic variants for genes involved in malignant transformation |
| Hugo Symbol | Variant Class | Variant Classification | dbSNP RS | HGVSc | HGVSp | HGVSp Short | SWISSPROT | BIOTYPE | SIFT | PolyPhen | Tumor Sample Barcode | Tissue | Histology | Sex | Age | Stage | Therapy Types | Drugs | Outcome |
| MFSD14B | insertion | Nonsense_Mutation | novel | c.782_783insACCTGAGAAGAGTGTAGGAATGTTCCCATAACTGTTTGCTTGTC | p.Phe262ProfsTer10 | p.F262Pfs*10 | Q5SR56 | protein_coding | TCGA-AO-A0J9-01 | Breast | breast invasive carcinoma | Female | <65 | III/IV | Chemotherapy | cyclophosphamide | PD | ||
| MFSD14B | insertion | Frame_Shift_Ins | novel | c.828dupT | p.Leu277SerfsTer13 | p.L277Sfs*13 | Q5SR56 | protein_coding | TCGA-BH-A1F8-01 | Breast | breast invasive carcinoma | Female | >=65 | III/IV | Unknown | Unknown | PD | ||
| MFSD14B | SNV | Missense_Mutation | rs770993570 | c.1079N>T | p.Pro360Leu | p.P360L | Q5SR56 | protein_coding | deleterious(0) | probably_damaging(1) | TCGA-EA-A410-01 | Cervix | cervical & endocervical cancer | Female | <65 | I/II | Unknown | Unknown | SD |
| MFSD14B | SNV | Missense_Mutation | c.1058N>T | p.Ala353Val | p.A353V | Q5SR56 | protein_coding | deleterious(0) | probably_damaging(0.938) | TCGA-AA-3663-01 | Colorectum | colon adenocarcinoma | Male | <65 | I/II | Unknown | Unknown | SD | |
| MFSD14B | SNV | Missense_Mutation | c.230N>G | p.His77Arg | p.H77R | Q5SR56 | protein_coding | tolerated(0.09) | probably_damaging(0.969) | TCGA-AA-3710-01 | Colorectum | colon adenocarcinoma | Female | >=65 | I/II | Unknown | Unknown | SD | |
| MFSD14B | SNV | Missense_Mutation | novel | c.527N>T | p.Ala176Val | p.A176V | Q5SR56 | protein_coding | deleterious(0) | probably_damaging(0.997) | TCGA-AZ-4315-01 | Colorectum | colon adenocarcinoma | Male | <65 | I/II | Unknown | Unknown | SD |
| MFSD14B | SNV | Missense_Mutation | rs767889393 | c.173C>T | p.Ala58Val | p.A58V | Q5SR56 | protein_coding | deleterious(0) | probably_damaging(0.957) | TCGA-G4-6588-01 | Colorectum | colon adenocarcinoma | Female | <65 | I/II | Unknown | Unknown | SD |
| MFSD14B | SNV | Missense_Mutation | rs200753636 | c.1423C>T | p.Arg475Trp | p.R475W | Q5SR56 | protein_coding | tolerated(0.07) | possibly_damaging(0.462) | TCGA-WS-AB45-01 | Colorectum | colon adenocarcinoma | Female | <65 | I/II | Unknown | Unknown | SD |
| MFSD14B | SNV | Missense_Mutation | rs199783937 | c.1399G>A | p.Gly467Ser | p.G467S | Q5SR56 | protein_coding | tolerated(0.44) | benign(0.009) | TCGA-AG-3882-01 | Colorectum | rectum adenocarcinoma | Female | >=65 | I/II | Unknown | Unknown | SD |
| MFSD14B | SNV | Missense_Mutation | novel | c.674N>G | p.Met225Arg | p.M225R | Q5SR56 | protein_coding | tolerated(0.15) | benign(0.005) | TCGA-A5-A0G2-01 | Endometrium | uterine corpus endometrioid carcinoma | Female | <65 | III/IV | Unknown | Unknown | SD |
| Page: 1 2 3 4 |
Top |
Related drugs of malignant transformation related genes |
| Identification of chemicals and drugs interact with genes involved in malignant transfromation |
| (DGIdb 4.0) |
| Entrez ID | Symbol | Category | Interaction Types | Drug Claim Name | Drug Name | PMIDs |
| Page: 1 |

Copyright 2023-Present -The University of Texas Health Science Center at Houston |