
|
|||||
|
 | |
| |
| |
| |
| |
| |
|
Gene: METTL17 |
Gene summary for METTL17 |
| Gene information | Species | Human | Gene symbol | METTL17 | Gene ID | 64745 |
| Gene name | methyltransferase like 17 | |
| Gene Alias | METT11D1 | |
| Cytomap | 14q11.2 | |
| Gene Type | protein-coding | GO ID | GO:0006412 | UniProtAcc | Q9H7H0 |
Top |
Malignant transformation analysis |
| Identification of the aberrant gene expression in precancerous and cancerous lesions by comparing the gene expression of stem-like cells in diseased tissues with normal stem cells |
| Entrez ID | Symbol | Replicates | Species | Organ | Tissue | Adj P-value | Log2FC | Malignancy |
| 64745 | METTL17 | P126T-E | Human | Esophagus | ESCC | 1.19e-06 | 5.60e-01 | 0.1125 |
| 64745 | METTL17 | P127T-E | Human | Esophagus | ESCC | 5.65e-12 | 5.04e-02 | 0.0826 |
| 64745 | METTL17 | P128T-E | Human | Esophagus | ESCC | 2.47e-31 | 8.90e-01 | 0.1241 |
| 64745 | METTL17 | P130T-E | Human | Esophagus | ESCC | 2.50e-47 | 9.35e-01 | 0.1676 |
| 64745 | METTL17 | HCC1_Meng | Human | Liver | HCC | 3.28e-53 | 3.45e-02 | 0.0246 |
| 64745 | METTL17 | HCC2_Meng | Human | Liver | HCC | 2.29e-15 | 6.92e-02 | 0.0107 |
| 64745 | METTL17 | HCC2 | Human | Liver | HCC | 4.82e-15 | 3.13e+00 | 0.5341 |
| 64745 | METTL17 | S014 | Human | Liver | HCC | 7.15e-11 | 4.82e-01 | 0.2254 |
| 64745 | METTL17 | S015 | Human | Liver | HCC | 2.05e-06 | 5.53e-01 | 0.2375 |
| 64745 | METTL17 | S016 | Human | Liver | HCC | 5.91e-11 | 4.50e-01 | 0.2243 |
| 64745 | METTL17 | S028 | Human | Liver | HCC | 2.00e-02 | 2.59e-01 | 0.2503 |
| 64745 | METTL17 | S029 | Human | Liver | HCC | 2.64e-06 | 3.96e-01 | 0.2581 |
| 64745 | METTL17 | C04 | Human | Oral cavity | OSCC | 2.45e-12 | 8.53e-01 | 0.2633 |
| 64745 | METTL17 | C21 | Human | Oral cavity | OSCC | 1.05e-24 | 8.48e-01 | 0.2678 |
| 64745 | METTL17 | C30 | Human | Oral cavity | OSCC | 1.60e-26 | 1.09e+00 | 0.3055 |
| 64745 | METTL17 | C43 | Human | Oral cavity | OSCC | 2.67e-33 | 6.45e-01 | 0.1704 |
| 64745 | METTL17 | C46 | Human | Oral cavity | OSCC | 1.75e-23 | 6.85e-01 | 0.1673 |
| 64745 | METTL17 | C51 | Human | Oral cavity | OSCC | 7.25e-09 | 5.27e-01 | 0.2674 |
| 64745 | METTL17 | C08 | Human | Oral cavity | OSCC | 2.11e-11 | 3.29e-01 | 0.1919 |
| 64745 | METTL17 | LN22 | Human | Oral cavity | OSCC | 4.17e-06 | 6.29e-01 | 0.1733 |
| Page: 1 2 3 4 5 6 |
| Tissue | Expression Dynamics | Abbreviation |
| Esophagus | 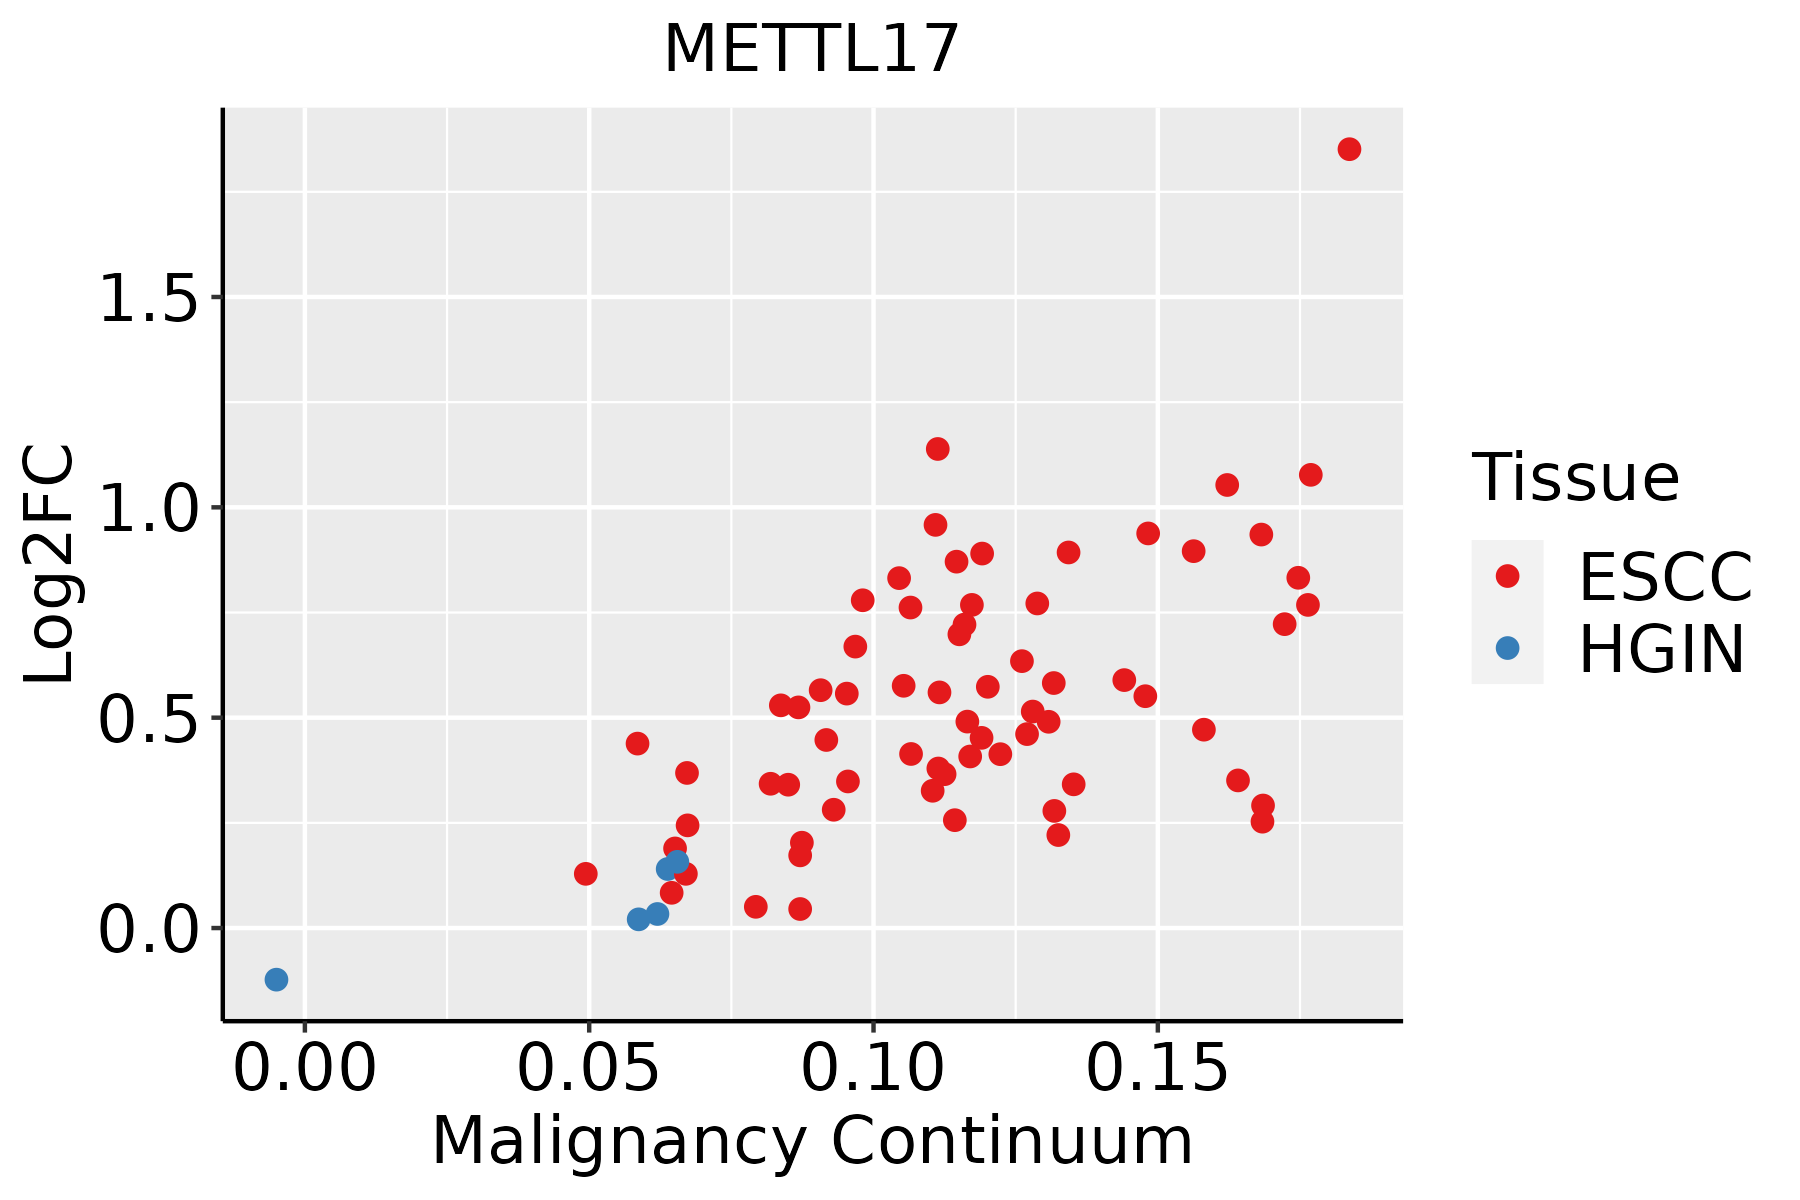 | ESCC: Esophageal squamous cell carcinoma |
| HGIN: High-grade intraepithelial neoplasias | ||
| LGIN: Low-grade intraepithelial neoplasias | ||
| Liver | 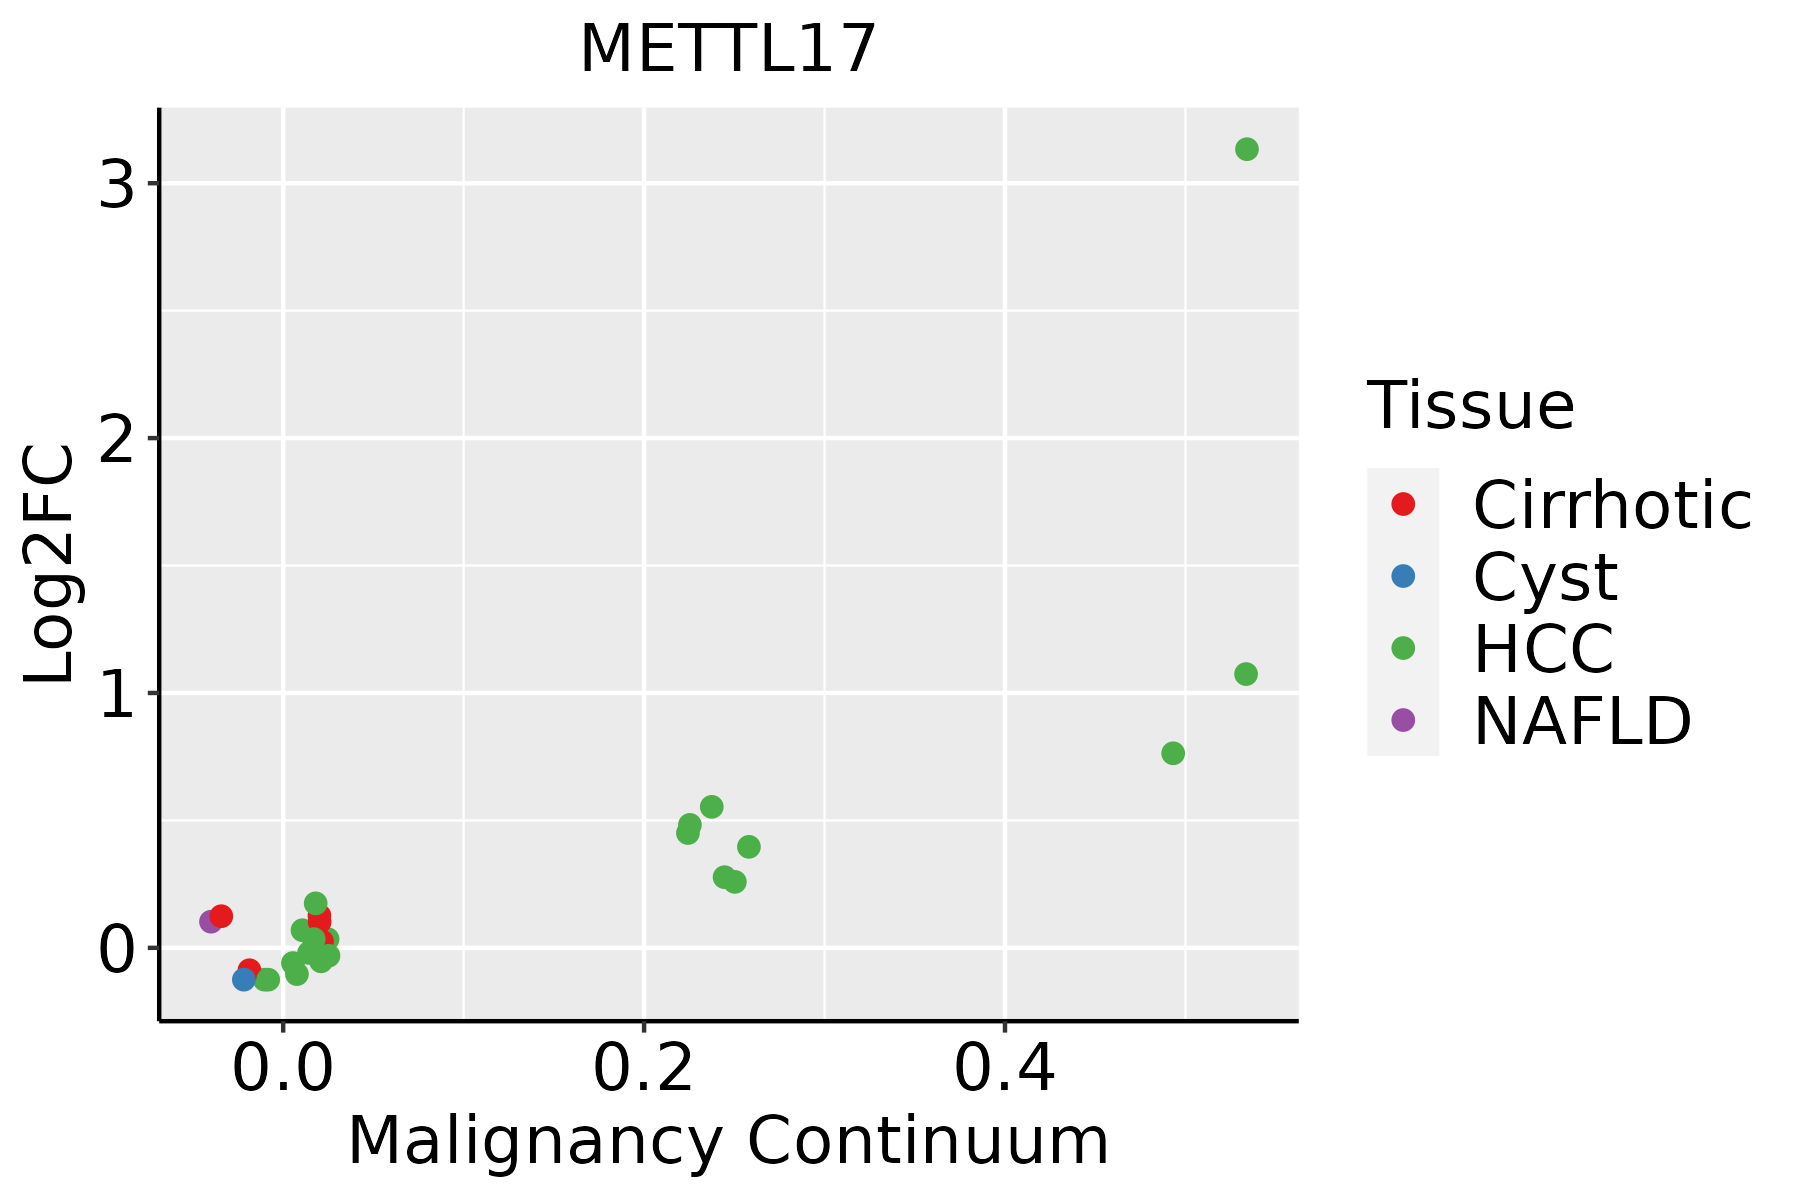 | HCC: Hepatocellular carcinoma |
| NAFLD: Non-alcoholic fatty liver disease | ||
| Oral Cavity |  | EOLP: Erosive Oral lichen planus |
| LP: leukoplakia | ||
| NEOLP: Non-erosive oral lichen planus | ||
| OSCC: Oral squamous cell carcinoma | ||
| Thyroid | 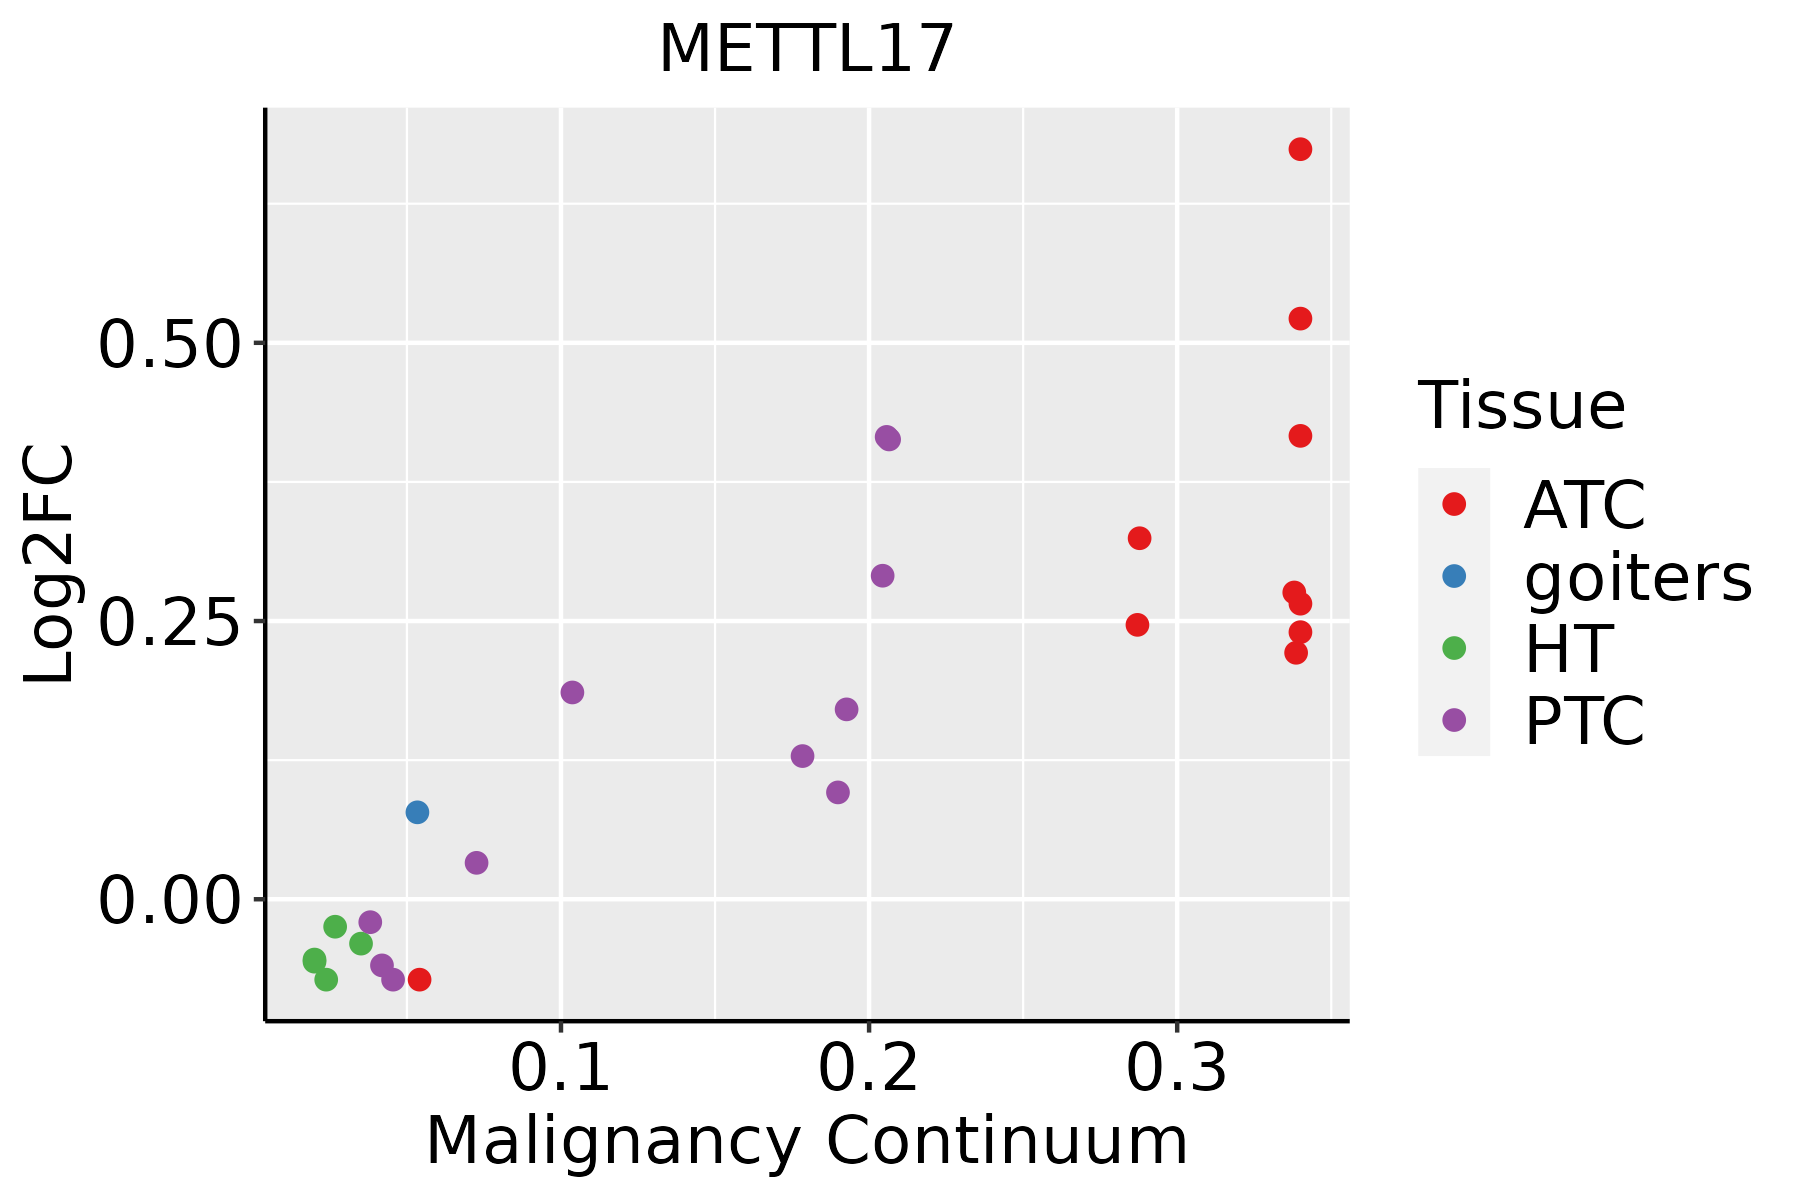 | ATC: Anaplastic thyroid cancer |
| HT: Hashimoto's thyroiditis | ||
| PTC: Papillary thyroid cancer |
| ∗log2FC in expression of this searched gene in stem-like cells from each diseased tissue sample relative to stem-like cells in normal samples in each tissue plotted against the malignancy continuum. Samples are colored based on if they are from different disease stage. |
Top |
Malignant transformation related pathway analysis |
| Find out the enriched GO biological processes and KEGG pathways involved in transition from healthy to precancer to cancer |
| Tissue | Disease Stage | Enriched GO biological Processes |
| Colorectum | AD |  |
| Colorectum | SER |  |
| Colorectum | MSS |  |
| Colorectum | MSI-H |  |
| Colorectum | FAP |  |
| ∗Top 15 enriched GO BP terms are showed in the bar plot of each disease state in each tissue. Each row represents a significant GO biological process which is colored according to the -log10(p.adjust). |
| Page: 1 2 3 4 5 6 7 8 9 |
| GO ID | Tissue | Disease Stage | Description | Gene Ratio | Bg Ratio | pvalue | p.adjust | Count |
| GO:0022613111 | Esophagus | ESCC | ribonucleoprotein complex biogenesis | 365/8552 | 463/18723 | 1.74e-49 | 1.11e-45 | 365 |
| GO:0042254111 | Esophagus | ESCC | ribosome biogenesis | 252/8552 | 299/18723 | 3.27e-44 | 1.04e-40 | 252 |
| GO:0042274111 | Esophagus | ESCC | ribosomal small subunit biogenesis | 67/8552 | 73/18723 | 6.62e-17 | 5.38e-15 | 67 |
| GO:00322592 | Esophagus | ESCC | methylation | 222/8552 | 364/18723 | 2.26e-09 | 5.09e-08 | 222 |
| GO:002261322 | Liver | HCC | ribonucleoprotein complex biogenesis | 355/7958 | 463/18723 | 7.76e-52 | 4.92e-48 | 355 |
| GO:004225422 | Liver | HCC | ribosome biogenesis | 246/7958 | 299/18723 | 4.99e-46 | 1.58e-42 | 246 |
| GO:004227422 | Liver | HCC | ribosomal small subunit biogenesis | 65/7958 | 73/18723 | 1.09e-16 | 9.92e-15 | 65 |
| GO:0032259 | Liver | HCC | methylation | 206/7958 | 364/18723 | 3.35e-08 | 7.53e-07 | 206 |
| GO:002261320 | Oral cavity | OSCC | ribonucleoprotein complex biogenesis | 333/7305 | 463/18723 | 8.28e-48 | 5.24e-44 | 333 |
| GO:004225420 | Oral cavity | OSCC | ribosome biogenesis | 230/7305 | 299/18723 | 3.22e-41 | 6.80e-38 | 230 |
| GO:004227420 | Oral cavity | OSCC | ribosomal small subunit biogenesis | 63/7305 | 73/18723 | 7.61e-17 | 6.34e-15 | 63 |
| GO:00322591 | Oral cavity | OSCC | methylation | 168/7305 | 364/18723 | 3.03e-03 | 1.31e-02 | 168 |
| GO:0022613110 | Oral cavity | LP | ribonucleoprotein complex biogenesis | 259/4623 | 463/18723 | 7.20e-48 | 2.25e-44 | 259 |
| GO:0042254110 | Oral cavity | LP | ribosome biogenesis | 173/4623 | 299/18723 | 8.97e-35 | 1.41e-31 | 173 |
| GO:0042274110 | Oral cavity | LP | ribosomal small subunit biogenesis | 48/4623 | 73/18723 | 1.42e-13 | 1.35e-11 | 48 |
| GO:0022613113 | Thyroid | PTC | ribonucleoprotein complex biogenesis | 292/5968 | 463/18723 | 3.24e-44 | 2.05e-40 | 292 |
| GO:0042254113 | Thyroid | PTC | ribosome biogenesis | 202/5968 | 299/18723 | 3.47e-37 | 5.47e-34 | 202 |
| GO:0042274113 | Thyroid | PTC | ribosomal small subunit biogenesis | 54/5968 | 73/18723 | 1.77e-13 | 9.28e-12 | 54 |
| GO:00322594 | Thyroid | PTC | methylation | 146/5968 | 364/18723 | 4.99e-04 | 3.26e-03 | 146 |
| GO:002261334 | Thyroid | ATC | ribonucleoprotein complex biogenesis | 292/6293 | 463/18723 | 3.05e-39 | 9.63e-36 | 292 |
| Page: 1 2 |
| Pathway ID | Tissue | Disease Stage | Description | Gene Ratio | Bg Ratio | pvalue | p.adjust | qvalue | Count |
| Page: 1 |
Top |
Cell-cell communication analysis |
| Identification of potential cell-cell interactions between two cell types and their ligand-receptor pairs for different disease states |
| Ligand | Receptor | LRpair | Pathway | Tissue | Disease Stage |
| Page: 1 |
Top |
Single-cell gene regulatory network inference analysis |
| Find out the significant the regulons (TFs) and the target genes of each regulon across cell types for different disease states |
| TF | Cell Type | Tissue | Disease Stage | Target Gene | RSS | Regulon Activity |
| ∗The dot plots of a searched regulon are shown for all cell subpopulations in each disease state of each tissue based on the regulon specific score inferred using pySCENIC and by calculating the average expression. |
| Page: 1 |
Top |
Somatic mutation of malignant transformation related genes |
| Annotation of somatic variants for genes involved in malignant transformation |
| Hugo Symbol | Variant Class | Variant Classification | dbSNP RS | HGVSc | HGVSp | HGVSp Short | SWISSPROT | BIOTYPE | SIFT | PolyPhen | Tumor Sample Barcode | Tissue | Histology | Sex | Age | Stage | Therapy Types | Drugs | Outcome |
| METTL17 | SNV | Missense_Mutation | rs758787257 | c.454N>A | p.Glu152Lys | p.E152K | Q9H7H0 | protein_coding | tolerated(0.17) | probably_damaging(0.981) | TCGA-AR-A0TX-01 | Breast | breast invasive carcinoma | Female | <65 | I/II | Unknown | Unknown | SD |
| METTL17 | SNV | Missense_Mutation | c.835G>A | p.Glu279Lys | p.E279K | Q9H7H0 | protein_coding | tolerated(0.17) | benign(0.044) | TCGA-BH-A18P-01 | Breast | breast invasive carcinoma | Female | <65 | I/II | Unknown | Unknown | PD | |
| METTL17 | SNV | Missense_Mutation | c.835G>C | p.Glu279Gln | p.E279Q | Q9H7H0 | protein_coding | tolerated(0.11) | benign(0.44) | TCGA-GM-A2D9-01 | Breast | breast invasive carcinoma | Female | >=65 | I/II | Hormone Therapy | arimidex | SD | |
| METTL17 | insertion | Frame_Shift_Ins | novel | c.54_55insATAAATTTCCTACAAGGAATCATTTCACAAA | p.Gly19IlefsTer31 | p.G19Ifs*31 | Q9H7H0 | protein_coding | TCGA-BH-A0AY-01 | Breast | breast invasive carcinoma | Female | <65 | I/II | Chemotherapy | SD | |||
| METTL17 | deletion | Frame_Shift_Del | novel | c.795delN | p.Ser267ProfsTer2 | p.S267Pfs*2 | Q9H7H0 | protein_coding | TCGA-EW-A2FV-01 | Breast | breast invasive carcinoma | Female | <65 | III/IV | Chemotherapy | docetaxel | SD | ||
| METTL17 | SNV | Missense_Mutation | rs758407608 | c.1055C>T | p.Ala352Val | p.A352V | Q9H7H0 | protein_coding | tolerated(0.18) | benign(0.088) | TCGA-EA-A3HU-01 | Cervix | cervical & endocervical cancer | Female | <65 | I/II | Unknown | Unknown | SD |
| METTL17 | SNV | Missense_Mutation | novel | c.778N>C | p.Asp260His | p.D260H | Q9H7H0 | protein_coding | deleterious(0) | probably_damaging(0.975) | TCGA-VS-A8EL-01 | Cervix | cervical & endocervical cancer | Female | <65 | I/II | Chemotherapy | cisplatin | CR |
| METTL17 | SNV | Missense_Mutation | c.695N>G | p.Lys232Arg | p.K232R | Q9H7H0 | protein_coding | tolerated(0.29) | benign(0.13) | TCGA-A6-2686-01 | Colorectum | colon adenocarcinoma | Female | >=65 | I/II | Unknown | Unknown | SD | |
| METTL17 | SNV | Missense_Mutation | c.1004A>G | p.His335Arg | p.H335R | Q9H7H0 | protein_coding | deleterious(0.02) | probably_damaging(0.999) | TCGA-AA-3710-01 | Colorectum | colon adenocarcinoma | Female | >=65 | I/II | Unknown | Unknown | SD | |
| METTL17 | SNV | Missense_Mutation | rs772938639 | c.1189N>T | p.Arg397Cys | p.R397C | Q9H7H0 | protein_coding | deleterious(0) | probably_damaging(1) | TCGA-AA-3984-01 | Colorectum | colon adenocarcinoma | Female | <65 | I/II | Unknown | Unknown | SD |
| Page: 1 2 3 4 5 |
Top |
Related drugs of malignant transformation related genes |
| Identification of chemicals and drugs interact with genes involved in malignant transfromation |
| (DGIdb 4.0) |
| Entrez ID | Symbol | Category | Interaction Types | Drug Claim Name | Drug Name | PMIDs |
| Page: 1 |

Copyright 2023-Present -The University of Texas Health Science Center at Houston |