| Entrez ID | Symbol | Replicates | Species | Organ | Tissue | Adj P-value | Log2FC | Malignancy |
| 55384 | MEG3 | GSM5252127_BPH283PrSF_Via | Human | Prostate | BPH | 3.28e-03 | 6.78e-01 | -0.1453 |
| 55384 | MEG3 | GSM5252128_BPH327PrGF_Via | Human | Prostate | BPH | 7.10e-26 | 1.45e+00 | -0.1688 |
| 55384 | MEG3 | GSM5252129_BPH327PrSF_Via | Human | Prostate | BPH | 1.01e-23 | 1.58e+00 | -0.1697 |
| 55384 | MEG3 | GSM5252131_BPH340PrSF_Via | Human | Prostate | BPH | 5.30e-11 | 1.14e+00 | -0.2126 |
| 55384 | MEG3 | GSM5252132_BPH389PrGF | Human | Prostate | BPH | 1.57e-08 | 7.09e-01 | -0.2247 |
| 55384 | MEG3 | GSM5252133_BPH389PrSF | Human | Prostate | BPH | 4.09e-07 | 8.62e-01 | -0.2027 |
| 55384 | MEG3 | GSM5252134_BPH511PrG_Fcol_3GEX | Human | Prostate | BPH | 1.70e-07 | 7.60e-01 | -0.1433 |
| 55384 | MEG3 | GSM5252135_BPH511PrPUr_Fcol_3GEX | Human | Prostate | BPH | 1.06e-12 | 3.11e-01 | -0.1833 |
| 55384 | MEG3 | GSM5252136_BPH556PrGA1_Fcol | Human | Prostate | BPH | 1.54e-06 | 1.36e+00 | -0.23 |
| 55384 | MEG3 | GSM5252137_BPH556PrGA2_Fcol | Human | Prostate | BPH | 2.48e-06 | 1.74e+00 | -0.23 |
| 55384 | MEG3 | 047563_1562-all-cells | Human | Prostate | BPH | 3.11e-13 | -2.83e-01 | 0.0791 |
| 55384 | MEG3 | 052095_1628-all-cells | Human | Prostate | BPH | 8.18e-05 | -2.93e-01 | 0.1032 |
| 55384 | MEG3 | Dong_P1 | Human | Prostate | Tumor | 8.05e-39 | -7.60e-01 | 0.035 |
| 55384 | MEG3 | Dong_P3 | Human | Prostate | Tumor | 1.99e-07 | -7.18e-02 | 0.0278 |
| 55384 | MEG3 | Dong_P5 | Human | Prostate | Tumor | 1.69e-48 | -8.53e-01 | 0.053 |
| 55384 | MEG3 | P7 | Human | Prostate | Tumor | 9.98e-05 | 5.13e-02 | -0.1025 |
| 55384 | MEG3 | P10 | Human | Prostate | Tumor | 3.32e-09 | 7.23e-01 | -0.0902 |
| 55384 | MEG3 | GSM5353216_PA_PB1A_Pool_1_3_S50_L002 | Human | Prostate | Tumor | 2.66e-02 | -8.72e-01 | 0.159 |
| 55384 | MEG3 | GSM5353218_PA_PB1B_Pool_1_2_S74_L003 | Human | Prostate | Tumor | 3.46e-03 | -9.21e-01 | 0.1479 |
| 55384 | MEG3 | GSM5353221_PA_PB2A_Pool_1_3_S25_L001 | Human | Prostate | Tumor | 6.33e-09 | -7.69e-01 | 0.1633 |
| Tissue | Expression Dynamics | Abbreviation |
| Endometrium | 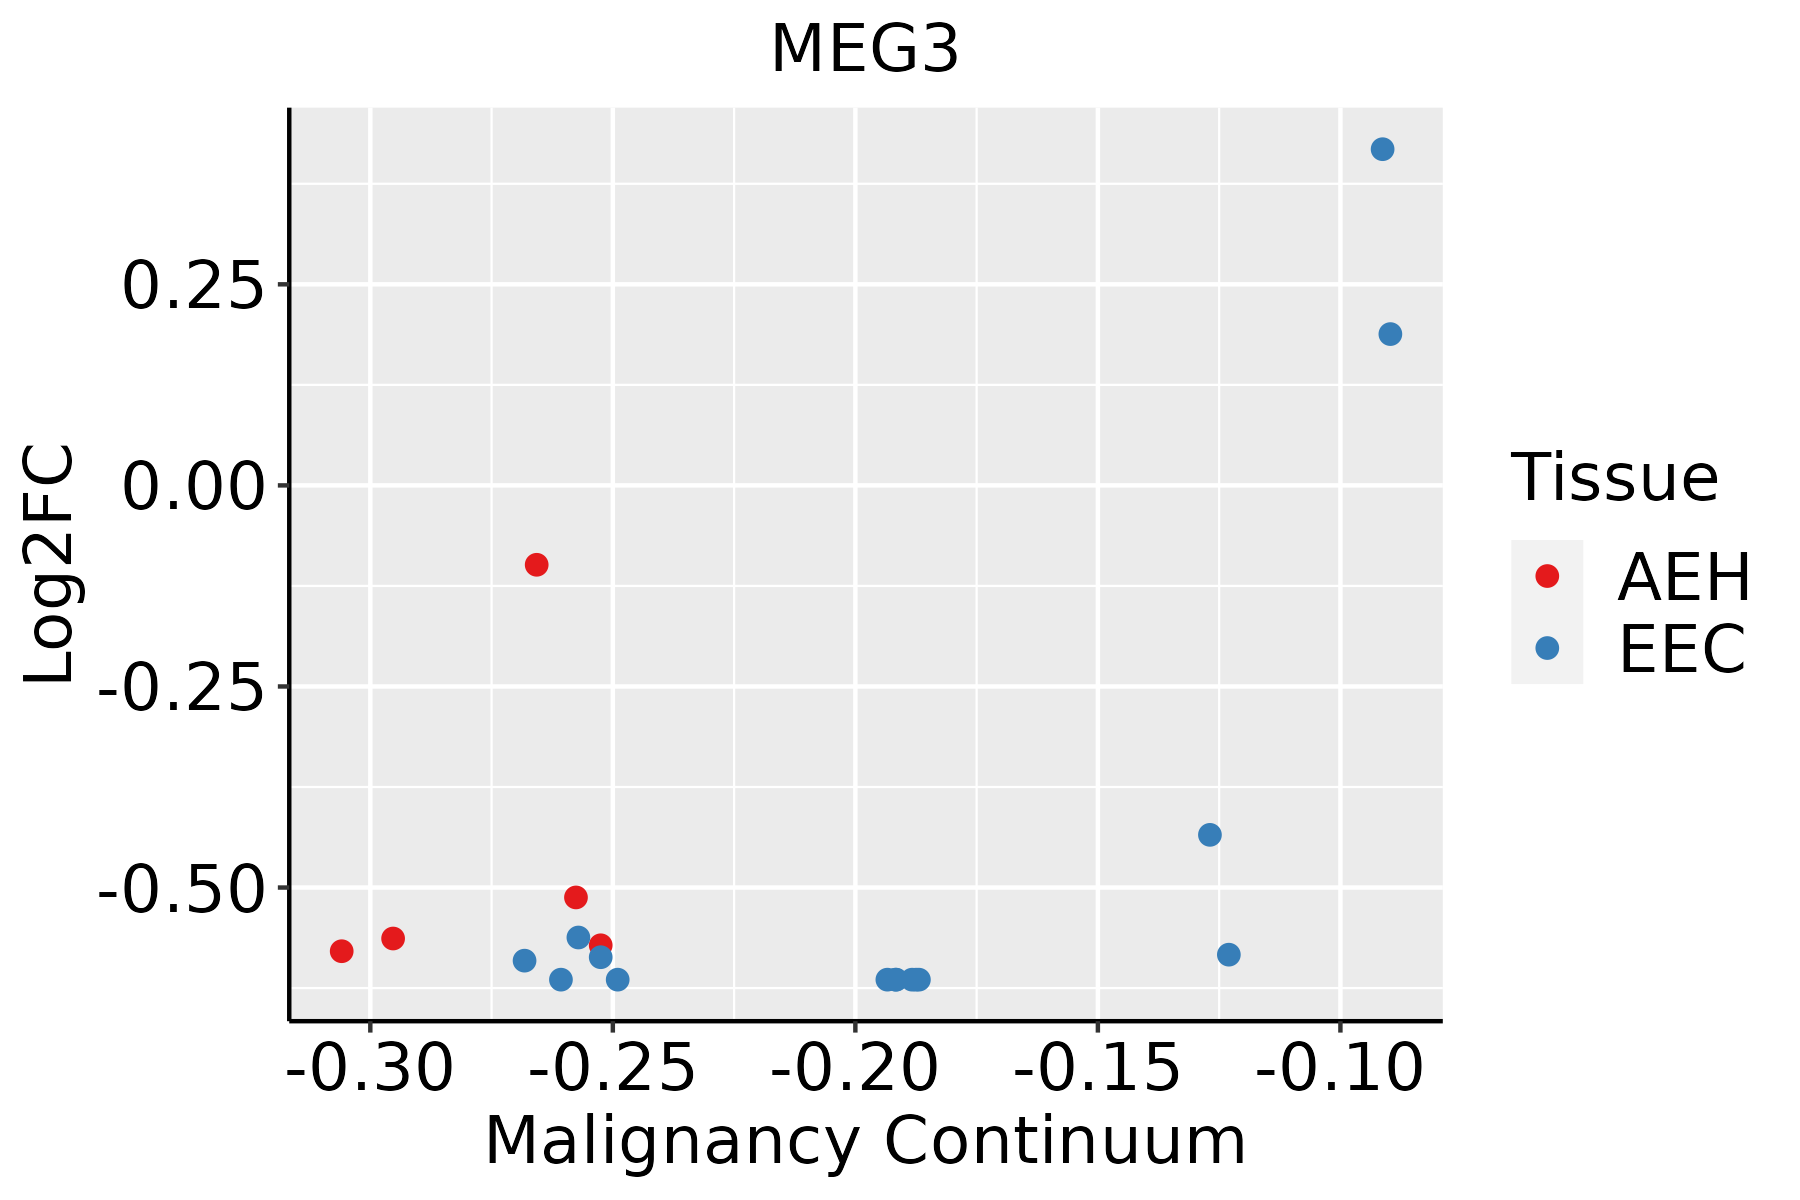 | AEH: Atypical endometrial hyperplasia |
| EEC: Endometrioid Cancer |
| Esophagus | 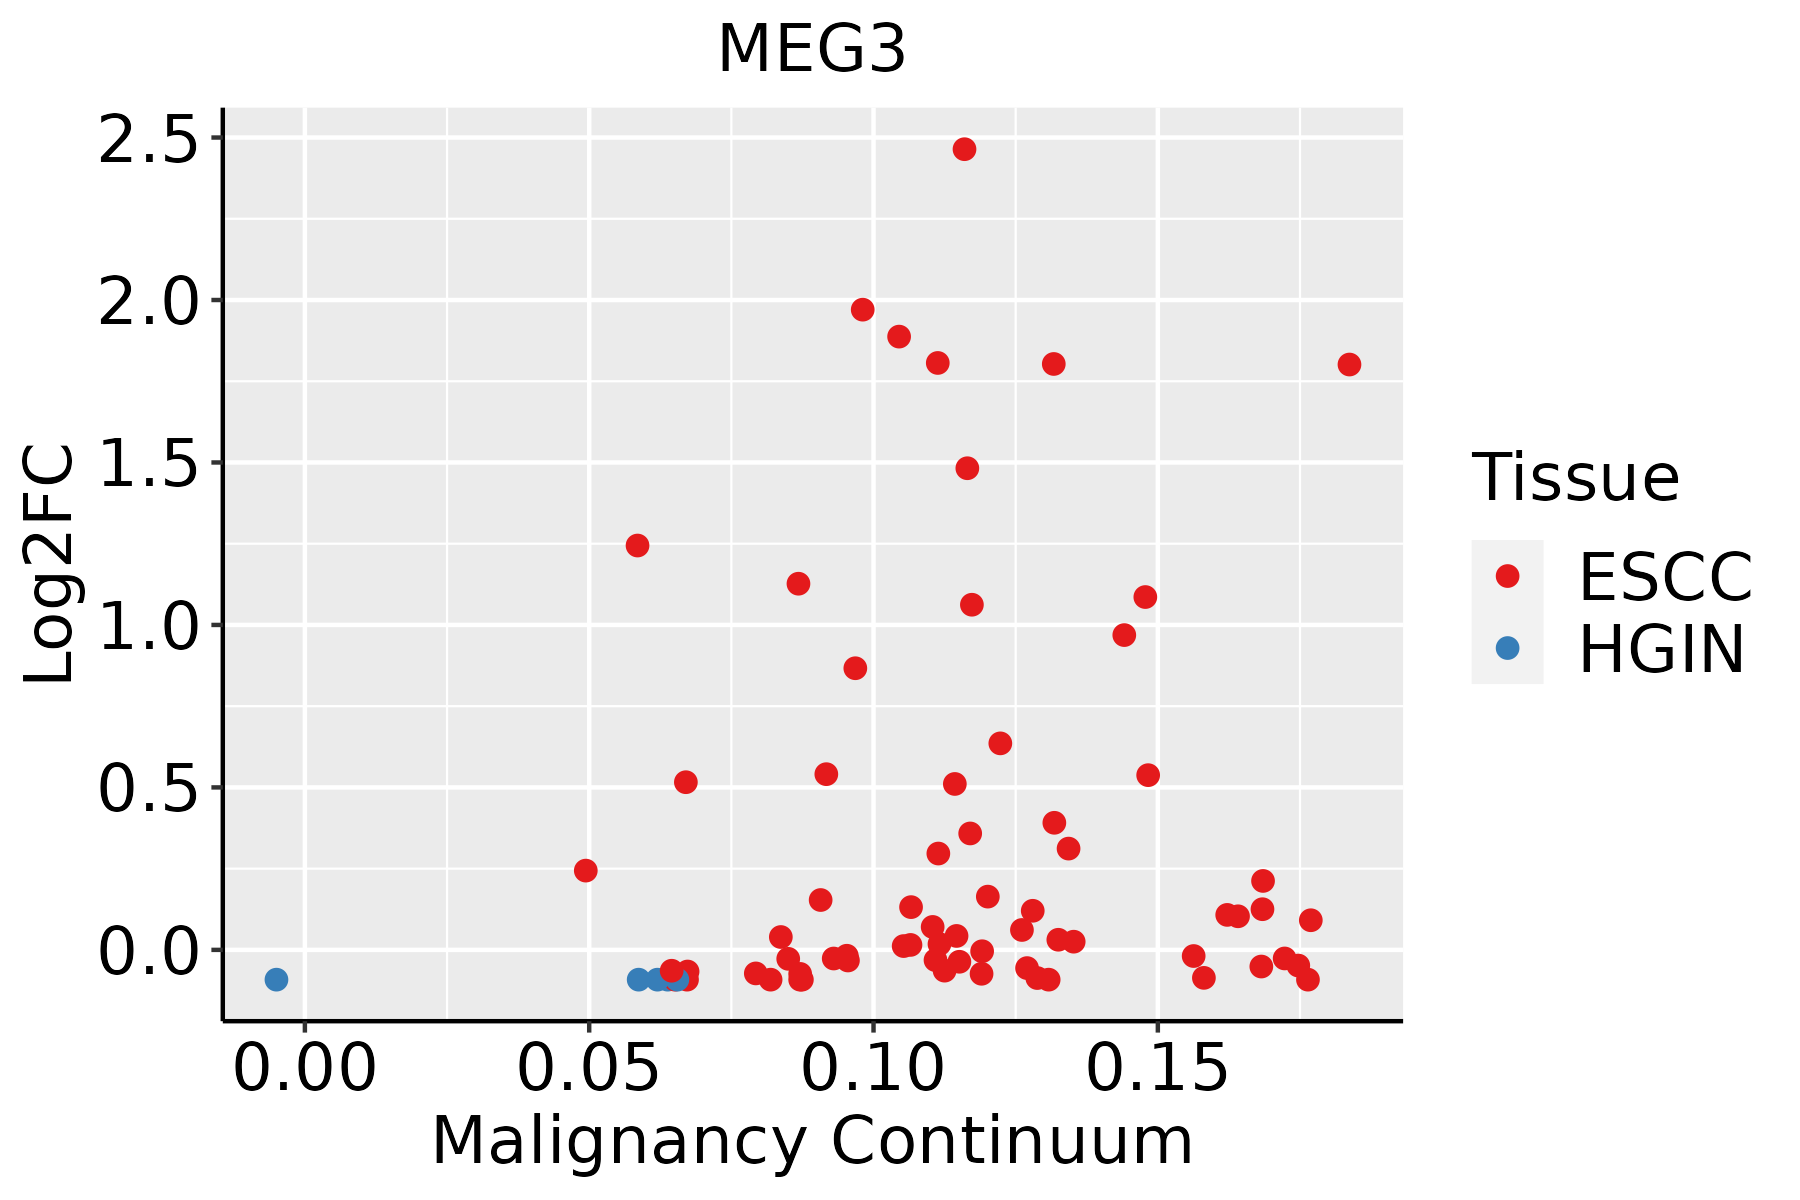 | ESCC: Esophageal squamous cell carcinoma |
| HGIN: High-grade intraepithelial neoplasias |
| LGIN: Low-grade intraepithelial neoplasias |
| Liver | 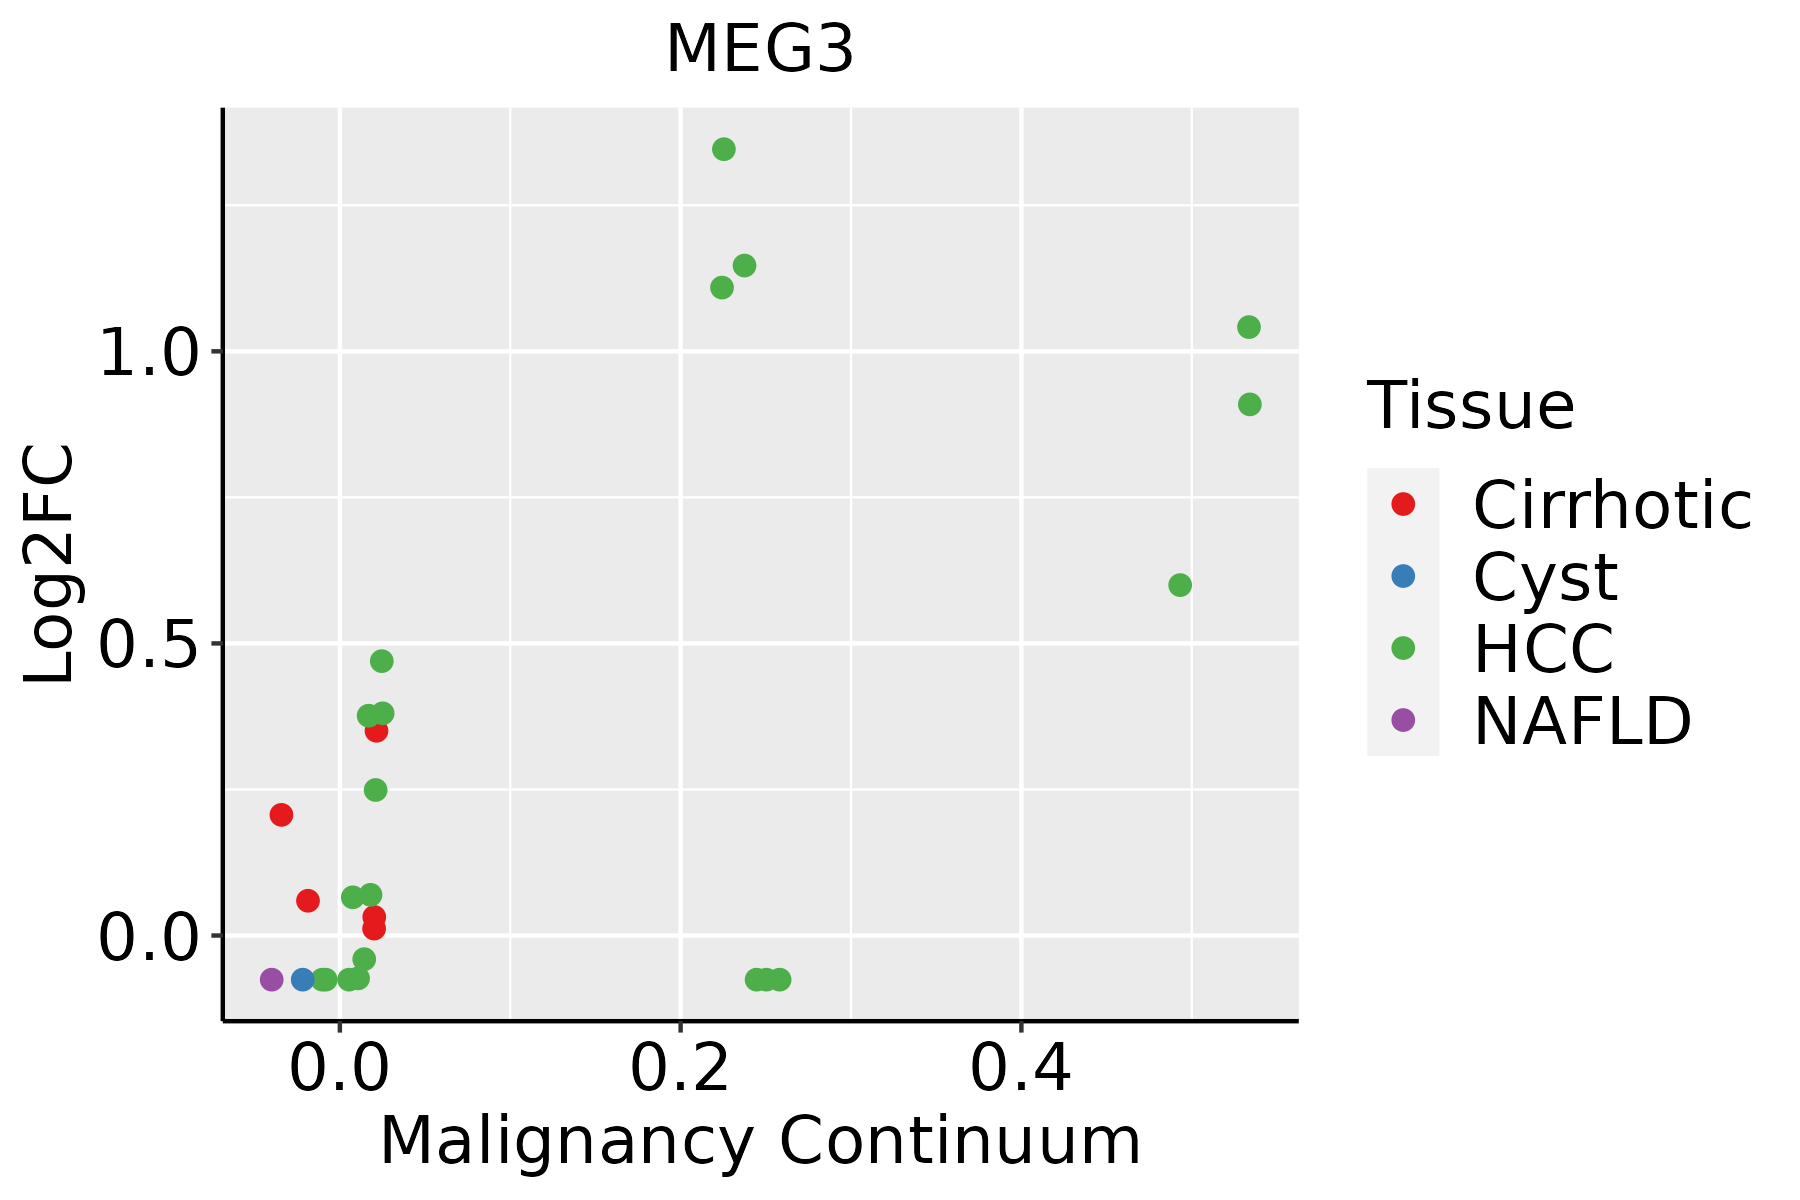 | HCC: Hepatocellular carcinoma |
| NAFLD: Non-alcoholic fatty liver disease |
| Lung | 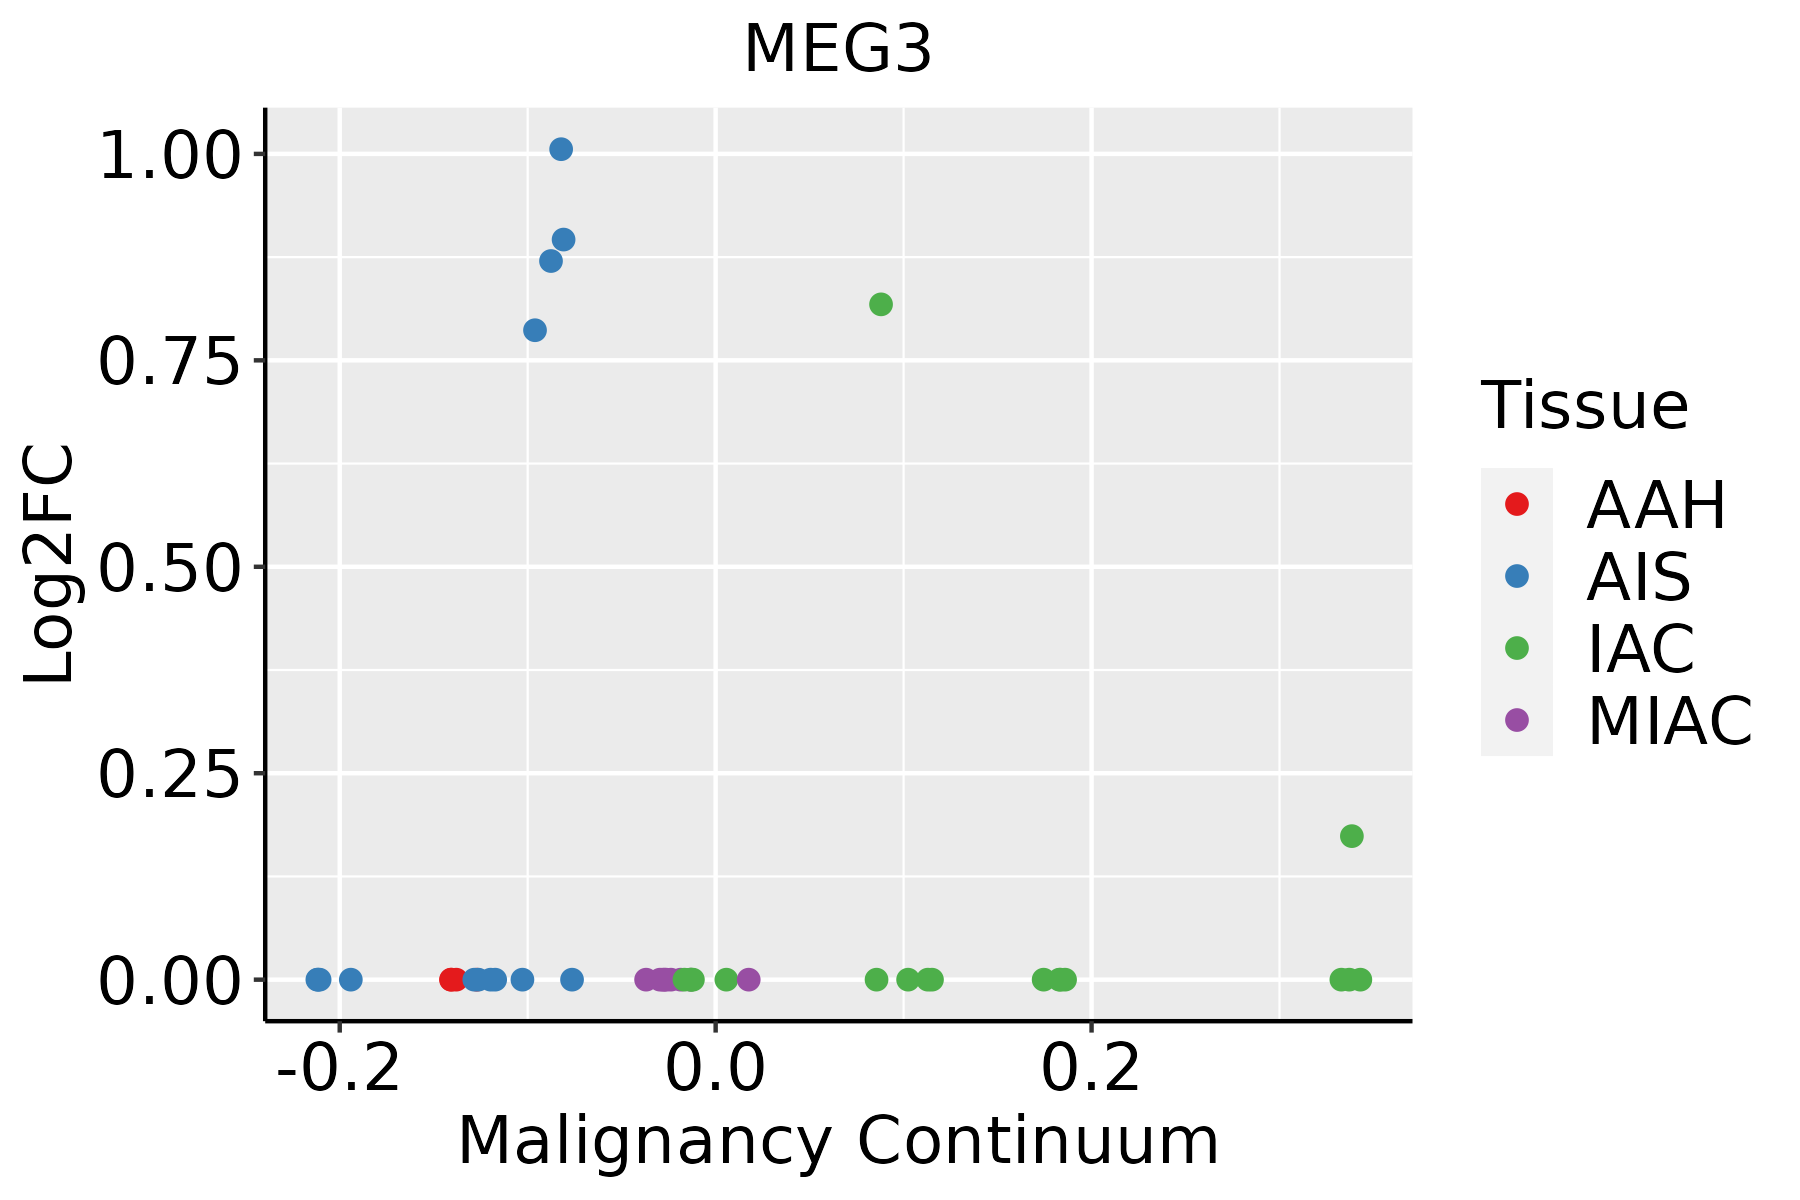 | AAH: Atypical adenomatous hyperplasia |
| AIS: Adenocarcinoma in situ |
| IAC: Invasive lung adenocarcinoma |
| MIA: Minimally invasive adenocarcinoma |
| Oral Cavity |  | EOLP: Erosive Oral lichen planus |
| LP: leukoplakia |
| NEOLP: Non-erosive oral lichen planus |
| OSCC: Oral squamous cell carcinoma |
| Prostate | 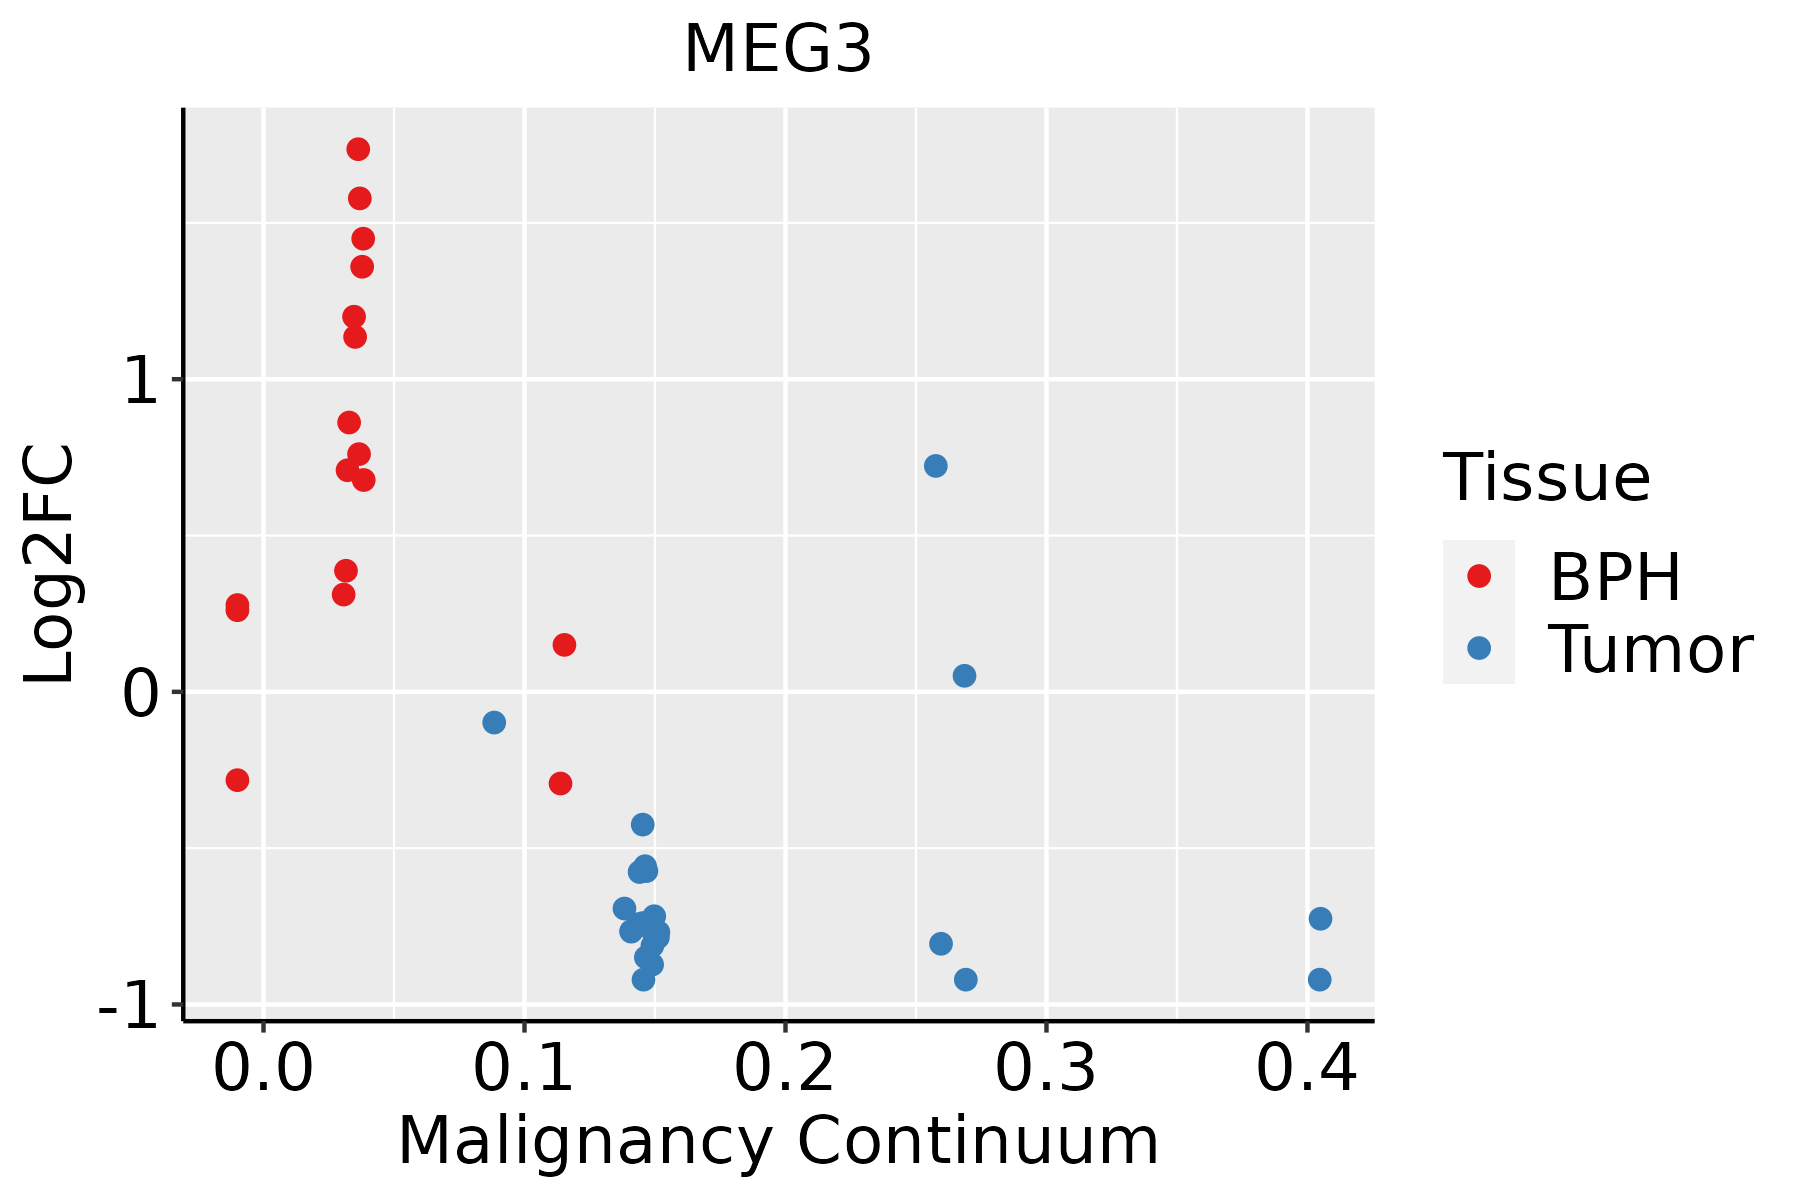 | BPH: Benign Prostatic Hyperplasia |
| Skin | 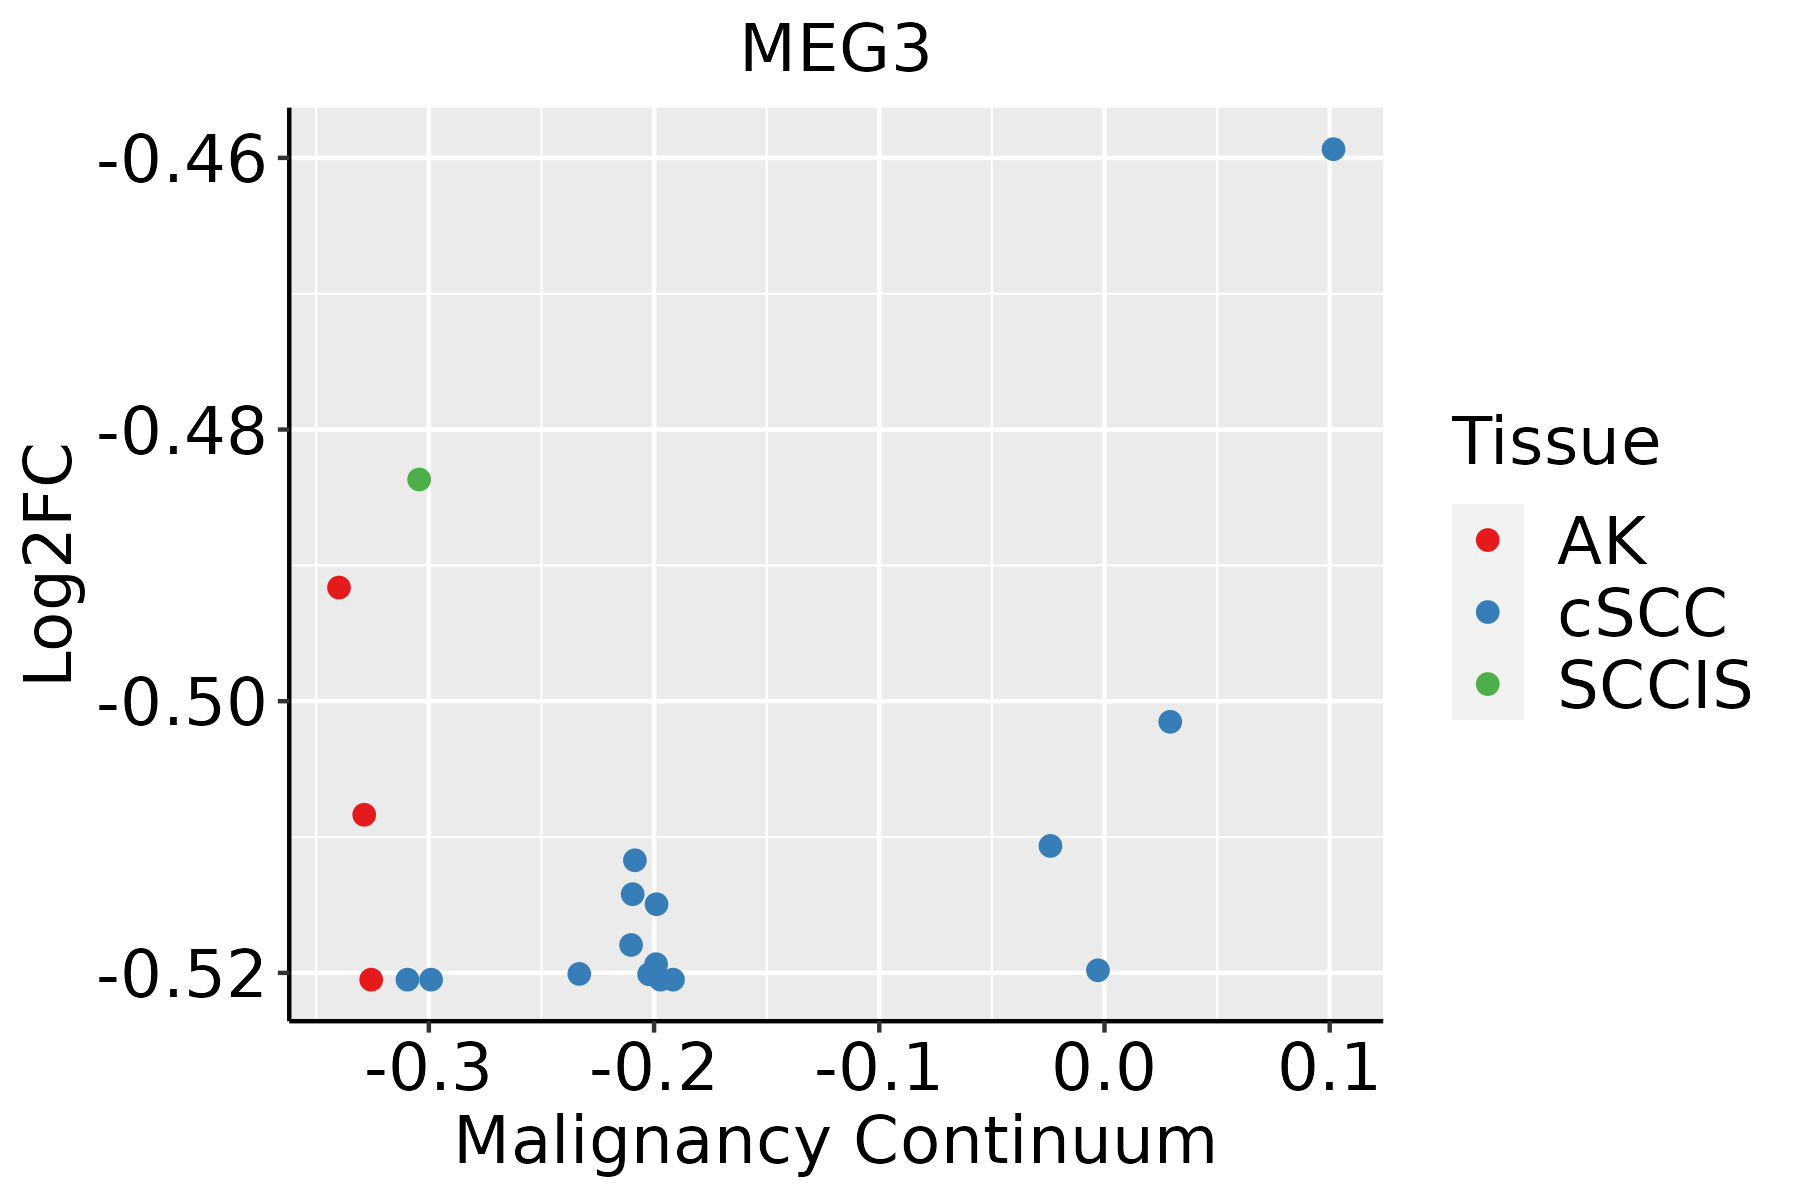 | AK: Actinic keratosis |
| cSCC: Cutaneous squamous cell carcinoma |
| SCCIS:squamous cell carcinoma in situ |
| Thyroid |  | ATC: Anaplastic thyroid cancer |
| HT: Hashimoto's thyroiditis |
| PTC: Papillary thyroid cancer |
| GO ID | Tissue | Disease Stage | Description | Gene Ratio | Bg Ratio | pvalue | p.adjust | Count |
| GO:00160499 | Endometrium | AEH | cell growth | 93/2100 | 482/18723 | 1.00e-07 | 4.99e-06 | 93 |
| GO:00015589 | Endometrium | AEH | regulation of cell growth | 75/2100 | 414/18723 | 1.79e-05 | 3.65e-04 | 75 |
| GO:00459264 | Endometrium | AEH | negative regulation of growth | 47/2100 | 249/18723 | 2.36e-04 | 2.84e-03 | 47 |
| GO:00303082 | Endometrium | AEH | negative regulation of cell growth | 36/2100 | 188/18723 | 9.15e-04 | 8.37e-03 | 36 |
| GO:001604915 | Endometrium | EEC | cell growth | 95/2168 | 482/18723 | 1.16e-07 | 5.54e-06 | 95 |
| GO:000155814 | Endometrium | EEC | regulation of cell growth | 77/2168 | 414/18723 | 1.64e-05 | 3.16e-04 | 77 |
| GO:004592611 | Endometrium | EEC | negative regulation of growth | 48/2168 | 249/18723 | 2.58e-04 | 2.98e-03 | 48 |
| GO:00303081 | Endometrium | EEC | negative regulation of cell growth | 37/2168 | 188/18723 | 8.33e-04 | 7.67e-03 | 37 |
| GO:0016049110 | Esophagus | ESCC | cell growth | 289/8552 | 482/18723 | 1.29e-10 | 3.77e-09 | 289 |
| GO:000155819 | Esophagus | ESCC | regulation of cell growth | 248/8552 | 414/18723 | 2.97e-09 | 6.45e-08 | 248 |
| GO:00459267 | Esophagus | ESCC | negative regulation of growth | 148/8552 | 249/18723 | 7.88e-06 | 7.73e-05 | 148 |
| GO:00303085 | Esophagus | ESCC | negative regulation of cell growth | 108/8552 | 188/18723 | 7.46e-04 | 3.87e-03 | 108 |
| GO:001604911 | Liver | Cirrhotic | cell growth | 160/4634 | 482/18723 | 1.50e-05 | 2.07e-04 | 160 |
| GO:000155811 | Liver | Cirrhotic | regulation of cell growth | 132/4634 | 414/18723 | 5.53e-04 | 4.36e-03 | 132 |
| GO:001604921 | Liver | HCC | cell growth | 269/7958 | 482/18723 | 1.84e-09 | 5.35e-08 | 269 |
| GO:000155821 | Liver | HCC | regulation of cell growth | 228/7958 | 414/18723 | 1.34e-07 | 2.55e-06 | 228 |
| GO:00459263 | Liver | HCC | negative regulation of growth | 129/7958 | 249/18723 | 1.81e-03 | 9.37e-03 | 129 |
| GO:0030308 | Liver | HCC | negative regulation of cell growth | 98/7958 | 188/18723 | 4.74e-03 | 2.02e-02 | 98 |
| GO:00160496 | Lung | IAC | cell growth | 89/2061 | 482/18723 | 6.10e-07 | 3.67e-05 | 89 |
| GO:00015586 | Lung | IAC | regulation of cell growth | 70/2061 | 414/18723 | 1.69e-04 | 3.01e-03 | 70 |


