
|
|||||
|
 | |
| |
| |
| |
| |
| |
|
Gene: MCM7 |
Gene summary for MCM7 |
| Gene information | Species | Human | Gene symbol | MCM7 | Gene ID | 4176 |
| Gene name | minichromosome maintenance complex component 7 | |
| Gene Alias | CDC47 | |
| Cytomap | 7q22.1 | |
| Gene Type | protein-coding | GO ID | GO:0000724 | UniProtAcc | C6EMX8 |
Top |
Malignant transformation analysis |
| Identification of the aberrant gene expression in precancerous and cancerous lesions by comparing the gene expression of stem-like cells in diseased tissues with normal stem cells |
| Entrez ID | Symbol | Replicates | Species | Organ | Tissue | Adj P-value | Log2FC | Malignancy |
| 4176 | MCM7 | P65T-E | Human | Esophagus | ESCC | 8.11e-26 | 8.29e-01 | 0.0978 |
| 4176 | MCM7 | P74T-E | Human | Esophagus | ESCC | 2.51e-35 | 1.32e+00 | 0.1479 |
| 4176 | MCM7 | P75T-E | Human | Esophagus | ESCC | 7.48e-21 | 8.08e-01 | 0.1125 |
| 4176 | MCM7 | P76T-E | Human | Esophagus | ESCC | 2.82e-67 | 2.19e+00 | 0.1207 |
| 4176 | MCM7 | P79T-E | Human | Esophagus | ESCC | 1.21e-51 | 1.44e+00 | 0.1154 |
| 4176 | MCM7 | P80T-E | Human | Esophagus | ESCC | 3.80e-39 | 1.90e+00 | 0.155 |
| 4176 | MCM7 | P82T-E | Human | Esophagus | ESCC | 1.69e-08 | 7.35e-01 | 0.1072 |
| 4176 | MCM7 | P83T-E | Human | Esophagus | ESCC | 1.47e-40 | 2.89e+00 | 0.1738 |
| 4176 | MCM7 | P84T-E | Human | Esophagus | ESCC | 2.54e-07 | 5.50e-01 | 0.0933 |
| 4176 | MCM7 | P89T-E | Human | Esophagus | ESCC | 7.86e-14 | 1.67e+00 | 0.1752 |
| 4176 | MCM7 | P91T-E | Human | Esophagus | ESCC | 6.24e-08 | 2.04e+00 | 0.1828 |
| 4176 | MCM7 | P104T-E | Human | Esophagus | ESCC | 1.42e-05 | 7.70e-01 | 0.0931 |
| 4176 | MCM7 | P107T-E | Human | Esophagus | ESCC | 8.33e-67 | 2.41e+00 | 0.171 |
| 4176 | MCM7 | P127T-E | Human | Esophagus | ESCC | 1.59e-06 | 3.64e-01 | 0.0826 |
| 4176 | MCM7 | P128T-E | Human | Esophagus | ESCC | 2.40e-42 | 1.30e+00 | 0.1241 |
| 4176 | MCM7 | P130T-E | Human | Esophagus | ESCC | 2.09e-47 | 1.39e+00 | 0.1676 |
| 4176 | MCM7 | HCC1_Meng | Human | Liver | HCC | 1.23e-61 | 2.07e-01 | 0.0246 |
| 4176 | MCM7 | HCC2_Meng | Human | Liver | HCC | 3.20e-04 | 3.73e-02 | 0.0107 |
| 4176 | MCM7 | cirrhotic2 | Human | Liver | Cirrhotic | 1.57e-04 | 1.33e-01 | 0.0201 |
| 4176 | MCM7 | HCC1 | Human | Liver | HCC | 6.76e-14 | 5.21e+00 | 0.5336 |
| Page: 1 2 3 4 5 6 7 |
| Tissue | Expression Dynamics | Abbreviation |
| Colorectum (GSE201348) |  | FAP: Familial adenomatous polyposis |
| CRC: Colorectal cancer | ||
| Colorectum (HTA11) | 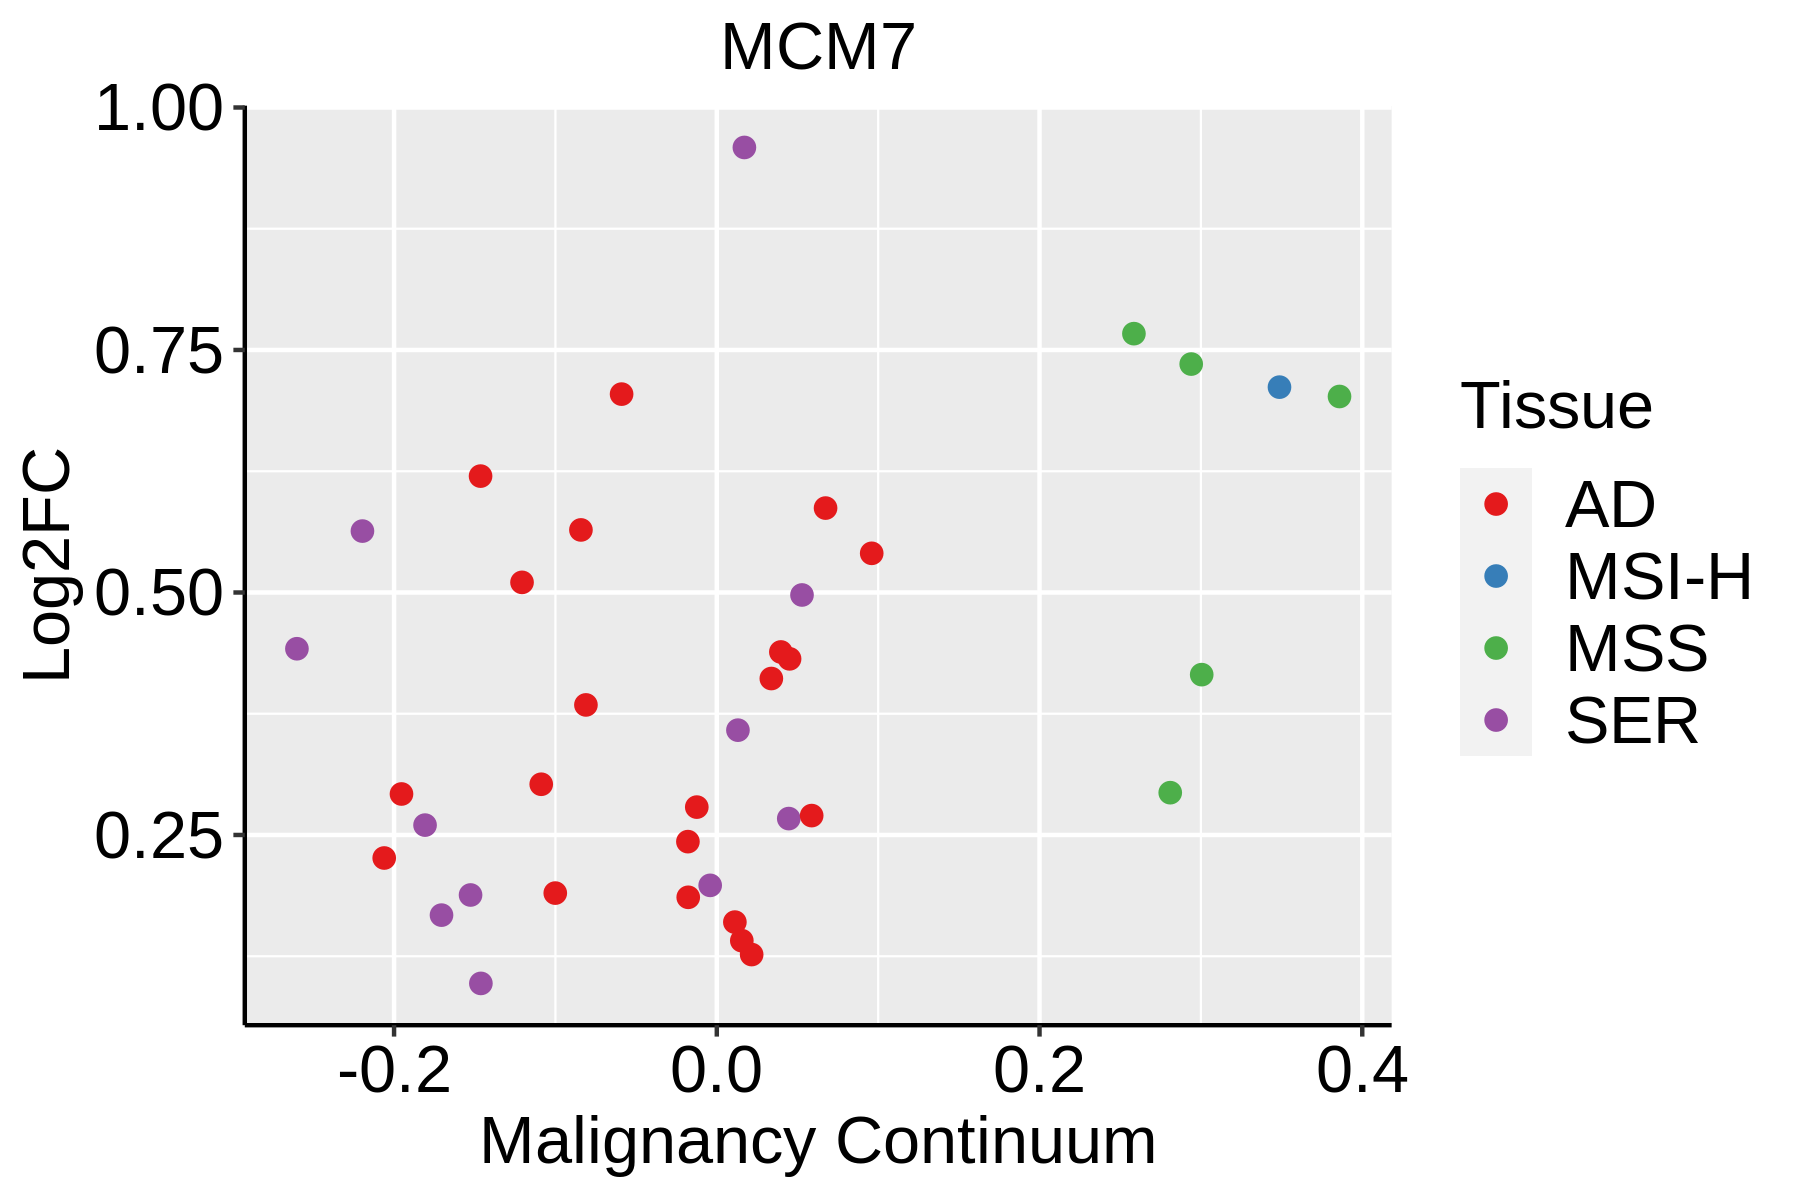 | AD: Adenomas |
| SER: Sessile serrated lesions | ||
| MSI-H: Microsatellite-high colorectal cancer | ||
| MSS: Microsatellite stable colorectal cancer | ||
| Esophagus | 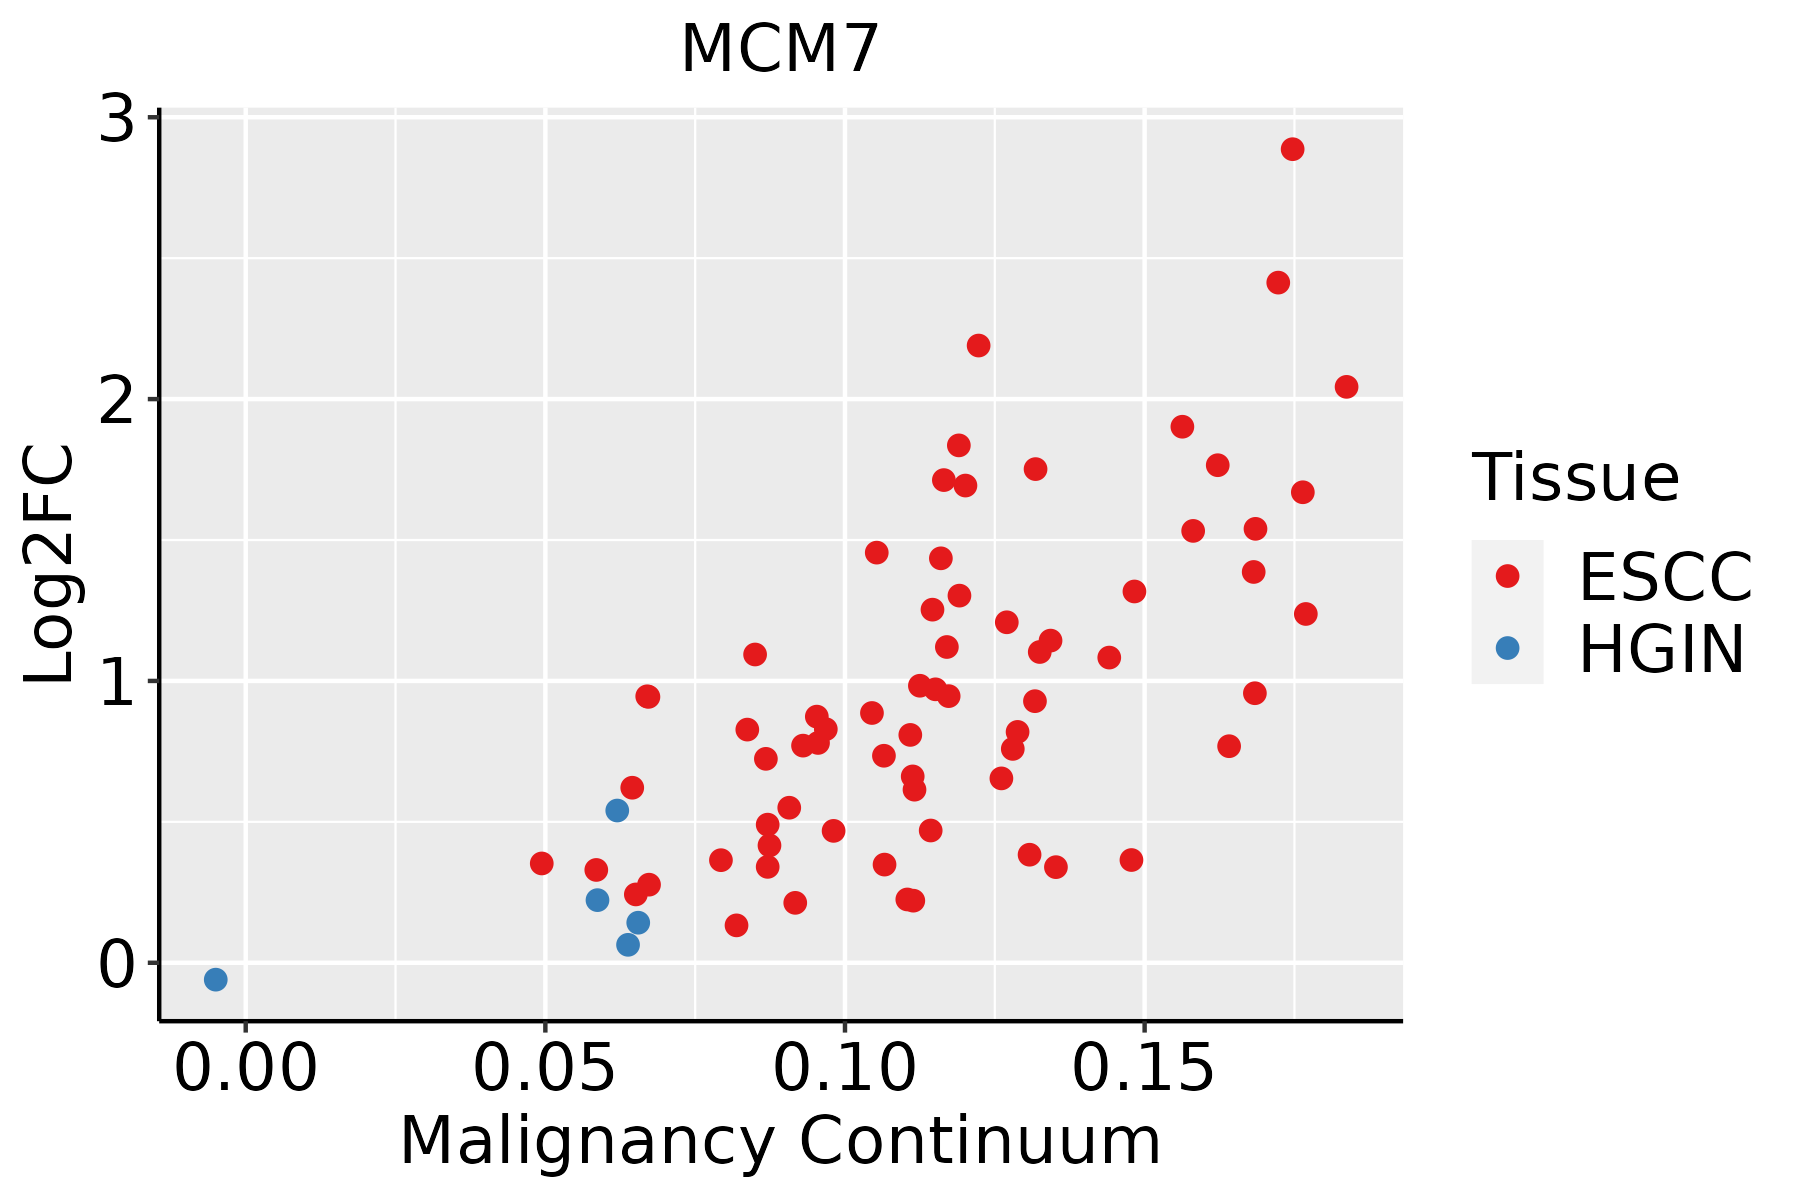 | ESCC: Esophageal squamous cell carcinoma |
| HGIN: High-grade intraepithelial neoplasias | ||
| LGIN: Low-grade intraepithelial neoplasias | ||
| Liver | 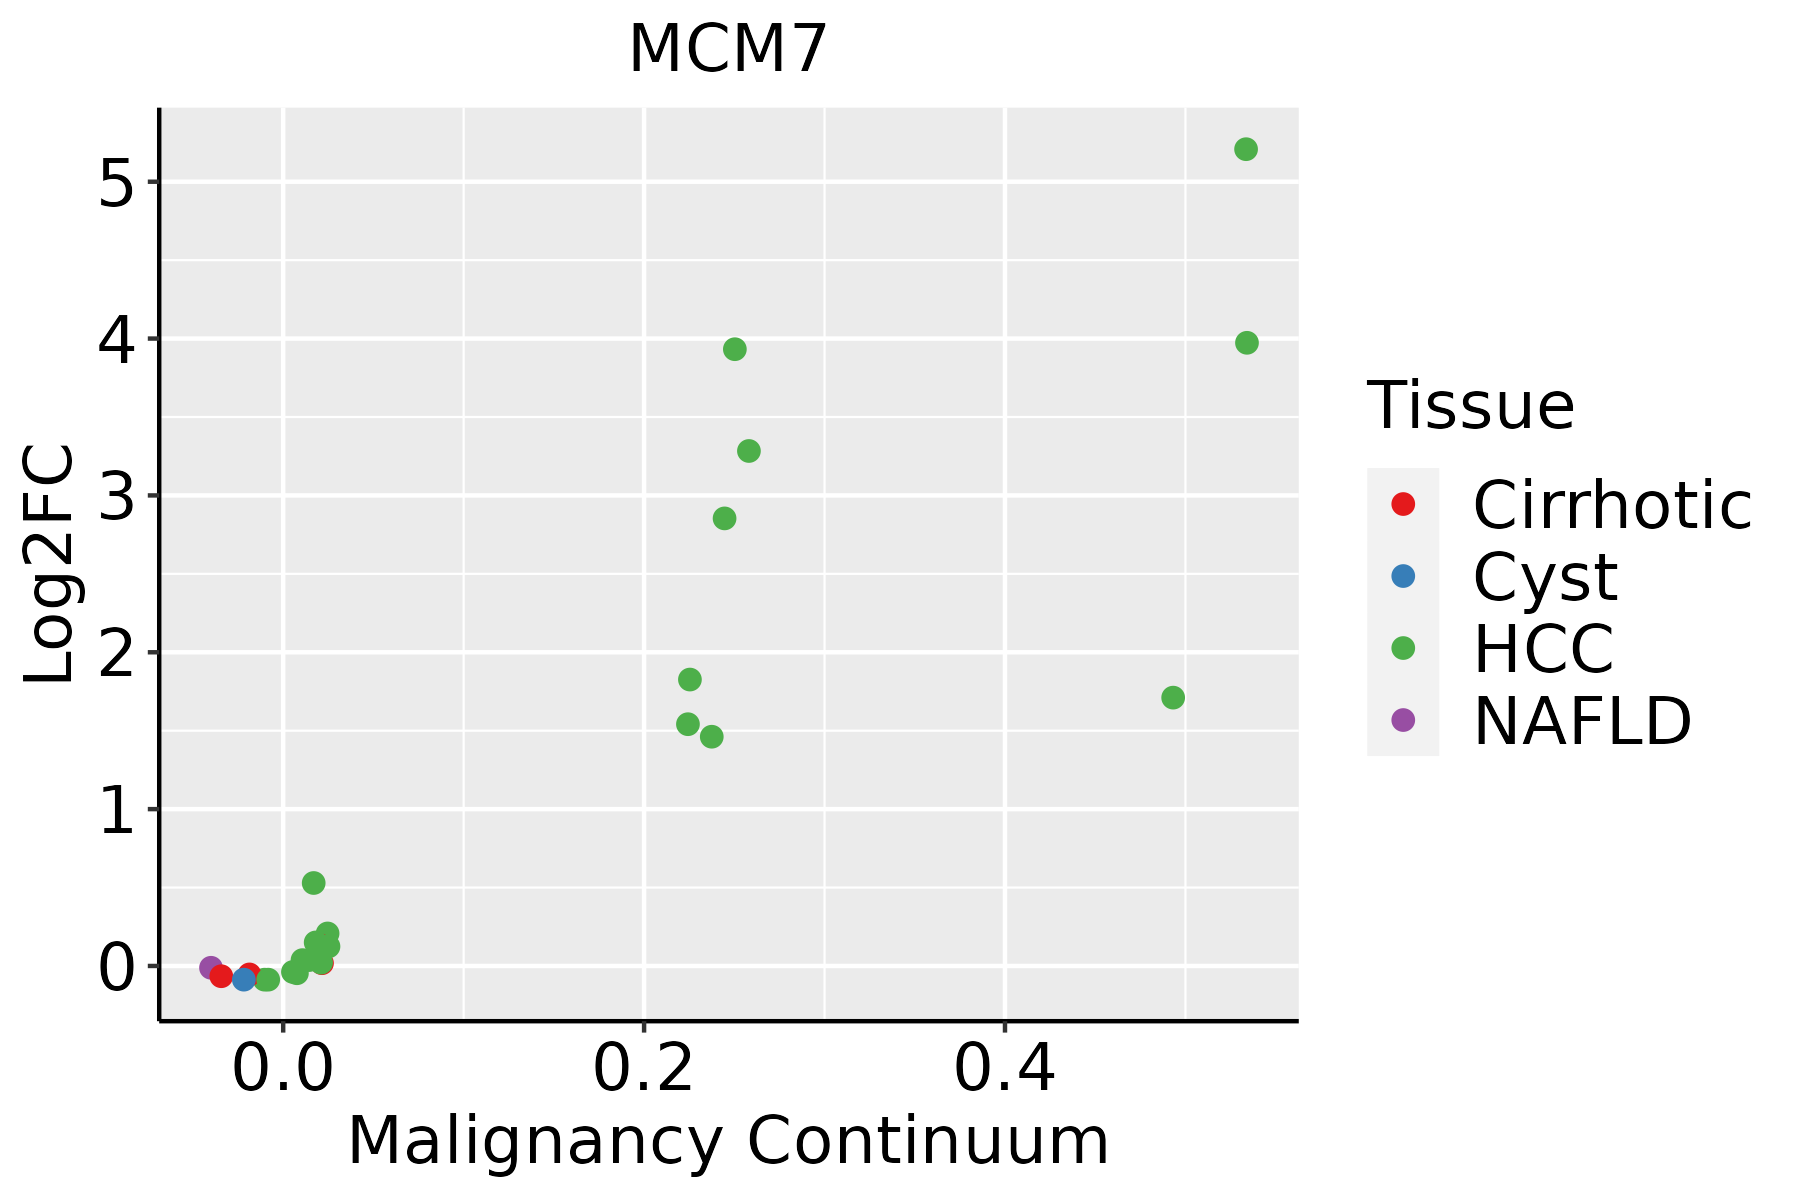 | HCC: Hepatocellular carcinoma |
| NAFLD: Non-alcoholic fatty liver disease | ||
| Oral Cavity | 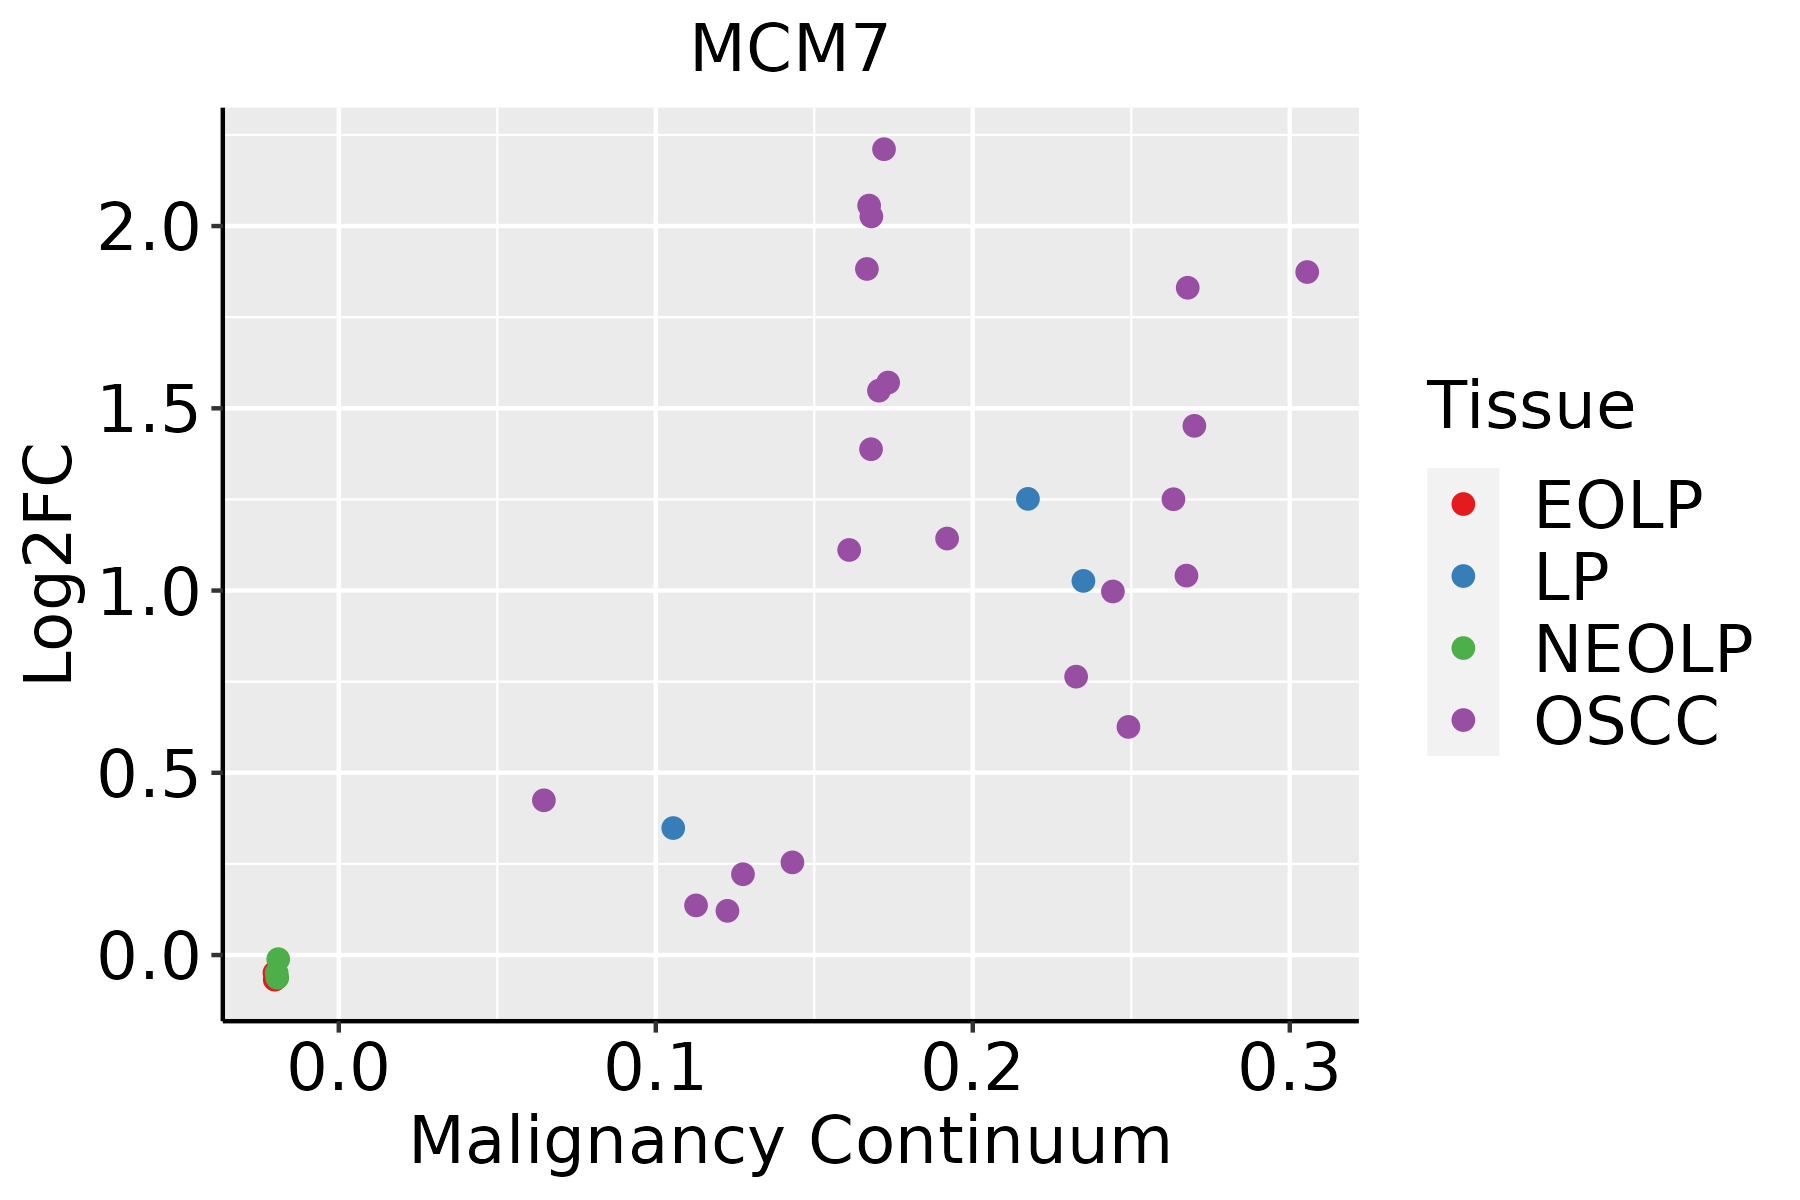 | EOLP: Erosive Oral lichen planus |
| LP: leukoplakia | ||
| NEOLP: Non-erosive oral lichen planus | ||
| OSCC: Oral squamous cell carcinoma | ||
| Prostate | 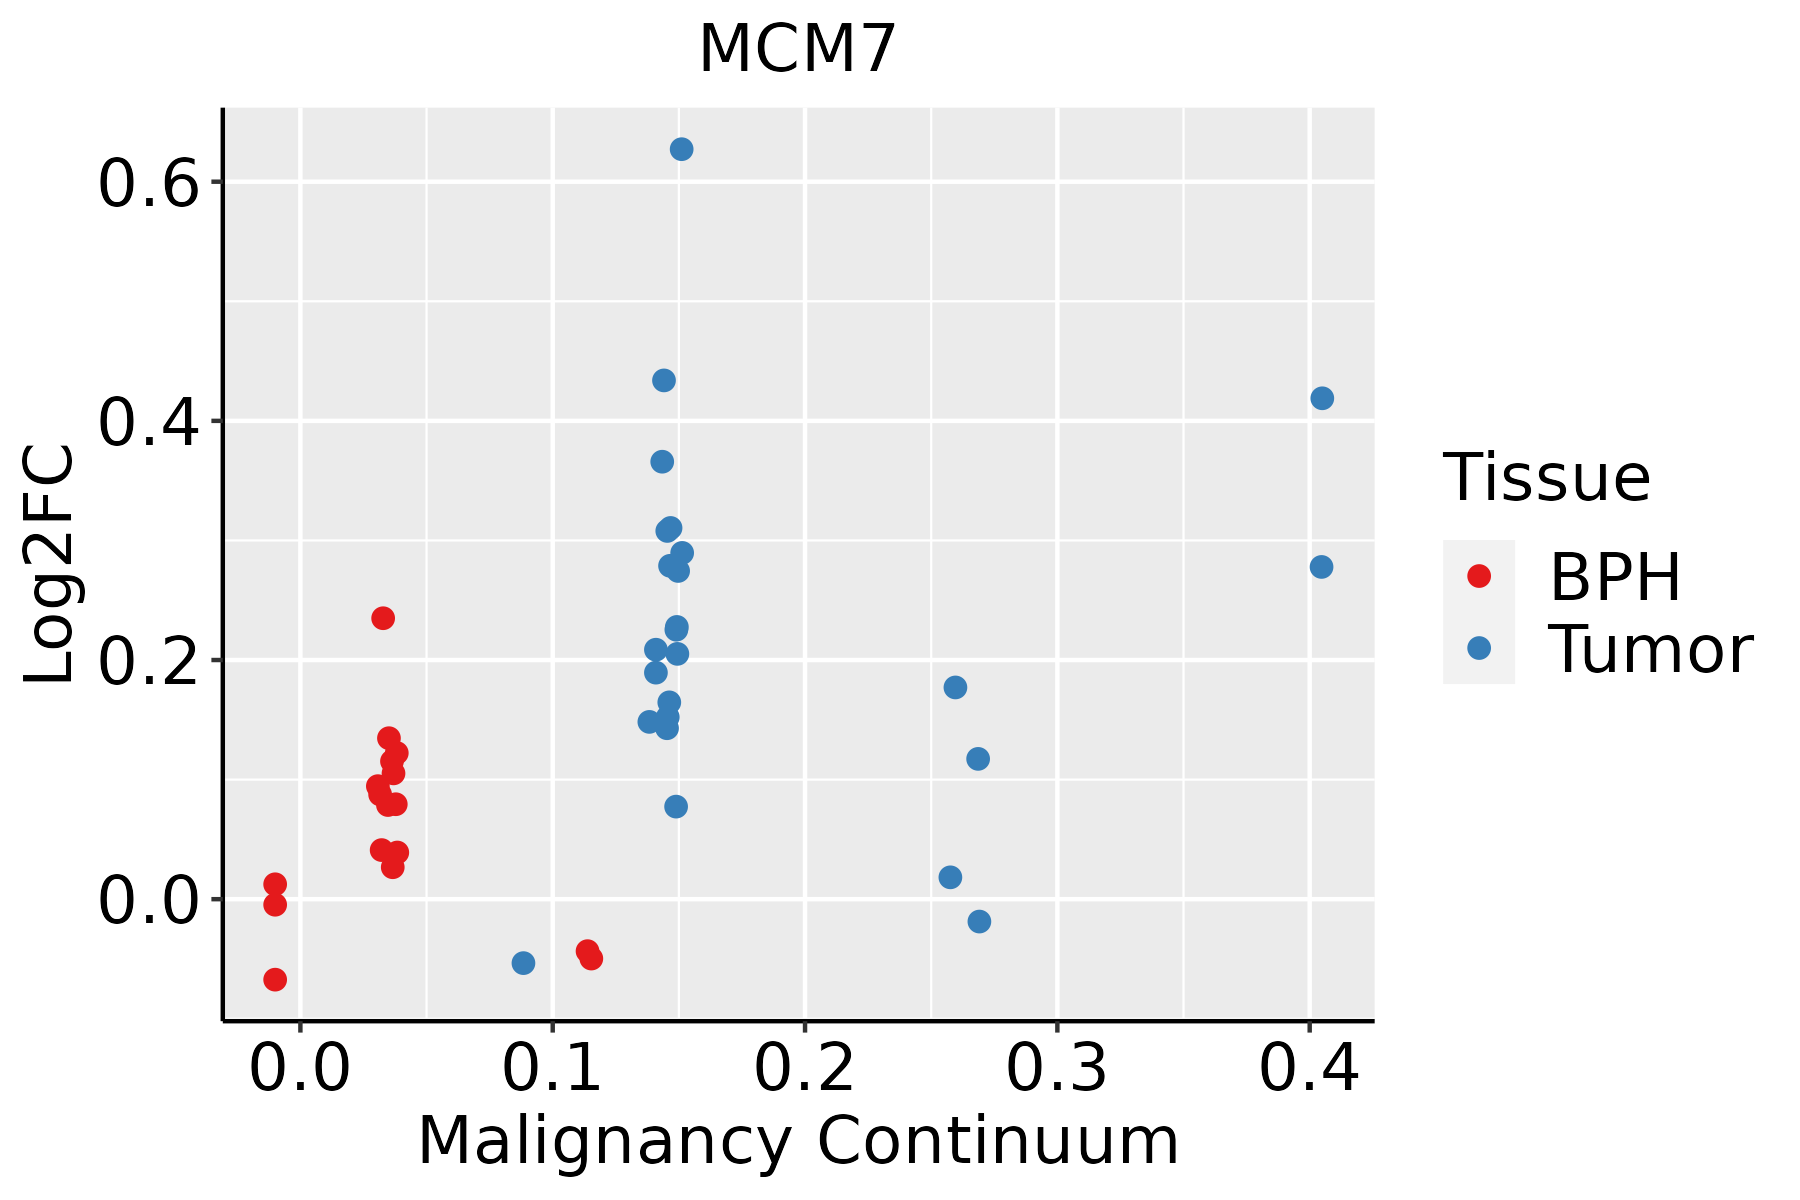 | BPH: Benign Prostatic Hyperplasia |
| Skin |  | AK: Actinic keratosis |
| cSCC: Cutaneous squamous cell carcinoma | ||
| SCCIS:squamous cell carcinoma in situ | ||
| Thyroid | 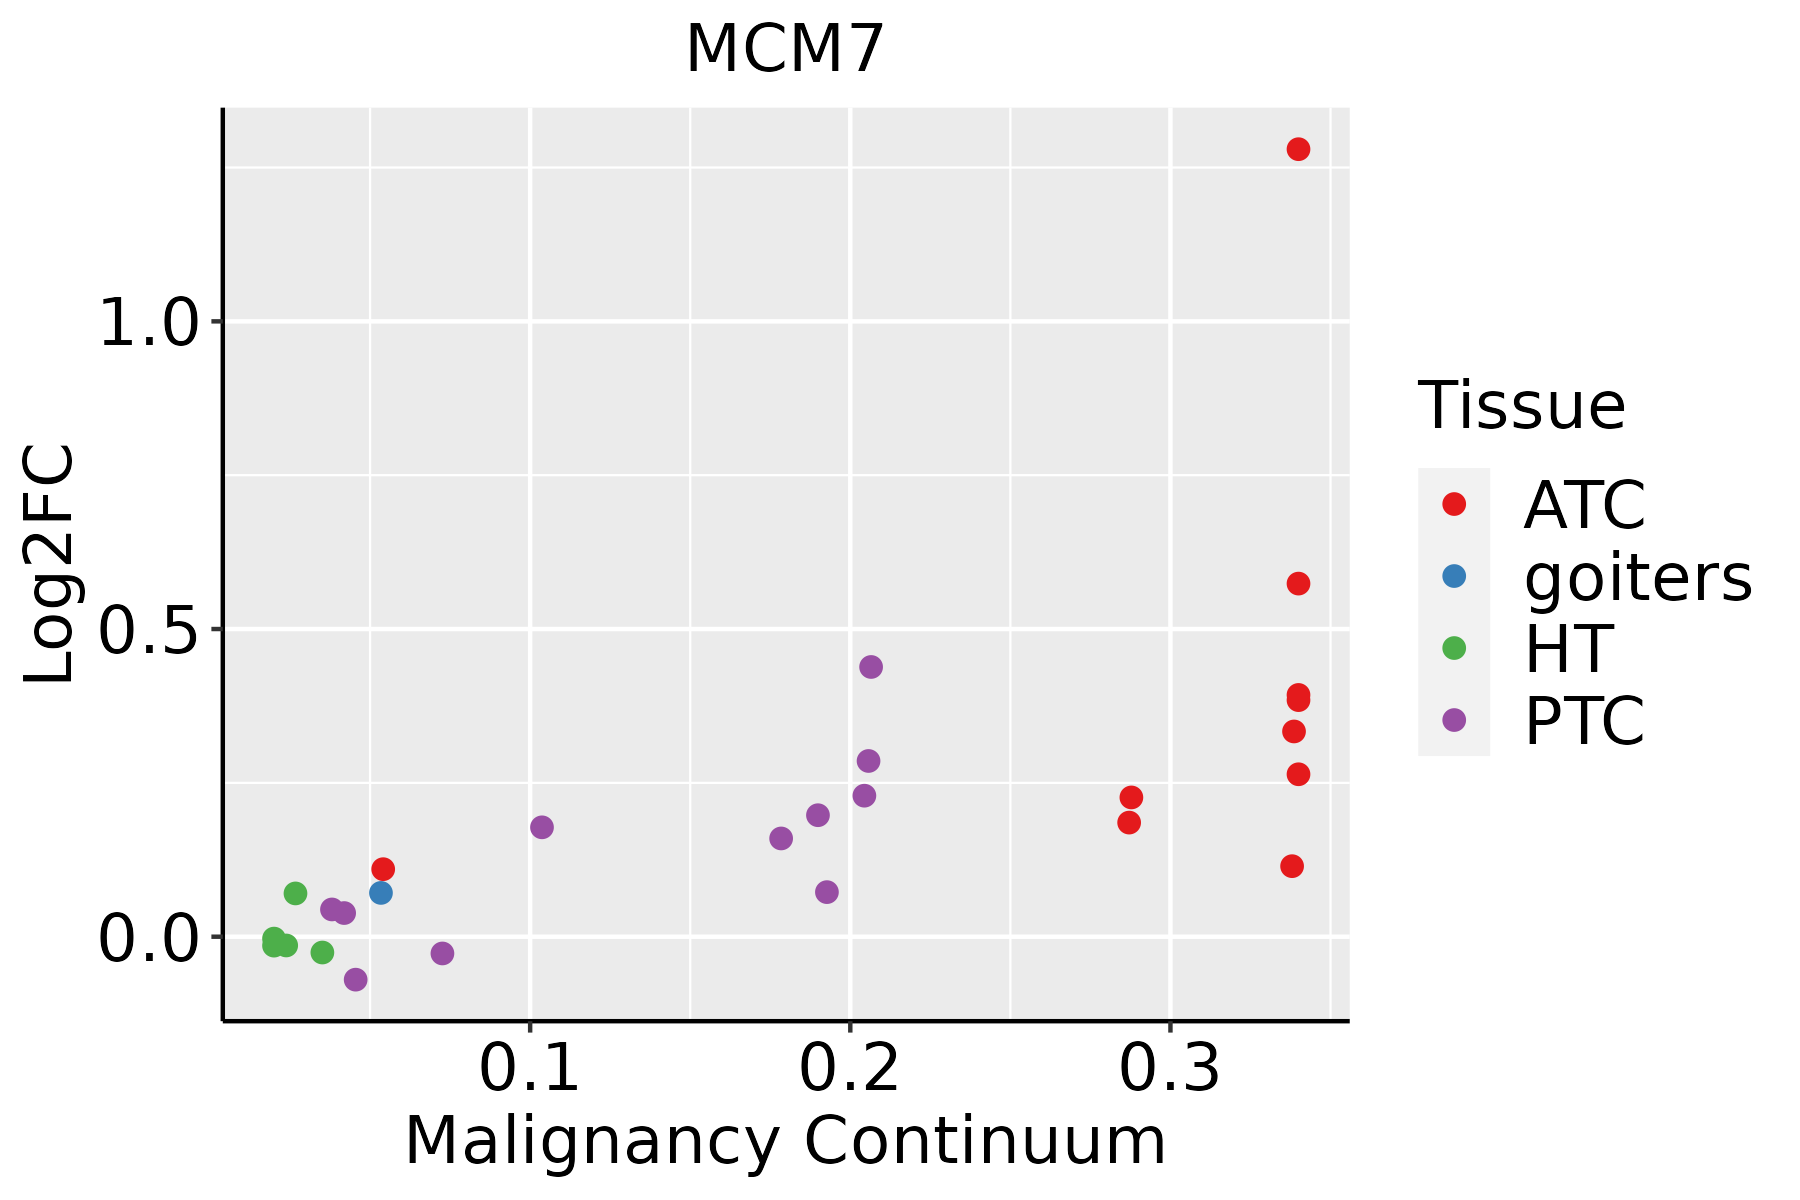 | ATC: Anaplastic thyroid cancer |
| HT: Hashimoto's thyroiditis | ||
| PTC: Papillary thyroid cancer |
| ∗log2FC in expression of this searched gene in stem-like cells from each diseased tissue sample relative to stem-like cells in normal samples in each tissue plotted against the malignancy continuum. Samples are colored based on if they are from different disease stage. |
Top |
Malignant transformation related pathway analysis |
| Find out the enriched GO biological processes and KEGG pathways involved in transition from healthy to precancer to cancer |
| Tissue | Disease Stage | Enriched GO biological Processes |
| Colorectum | AD |  |
| Colorectum | SER |  |
| Colorectum | MSS |  |
| Colorectum | MSI-H |  |
| Colorectum | FAP |  |
| ∗Top 15 enriched GO BP terms are showed in the bar plot of each disease state in each tissue. Each row represents a significant GO biological process which is colored according to the -log10(p.adjust). |
| Page: 1 2 3 4 5 6 7 8 9 |
| GO ID | Tissue | Disease Stage | Description | Gene Ratio | Bg Ratio | pvalue | p.adjust | Count |
| GO:0070849 | Colorectum | AD | response to epidermal growth factor | 23/3918 | 49/18723 | 4.18e-05 | 7.37e-04 | 23 |
| GO:0071364 | Colorectum | AD | cellular response to epidermal growth factor stimulus | 21/3918 | 45/18723 | 9.94e-05 | 1.50e-03 | 21 |
| GO:0009410 | Colorectum | AD | response to xenobiotic stimulus | 128/3918 | 462/18723 | 2.69e-04 | 3.31e-03 | 128 |
| GO:0032392 | Colorectum | AD | DNA geometric change | 31/3918 | 90/18723 | 2.02e-03 | 1.63e-02 | 31 |
| GO:00708491 | Colorectum | SER | response to epidermal growth factor | 20/2897 | 49/18723 | 1.72e-05 | 5.15e-04 | 20 |
| GO:00713641 | Colorectum | SER | cellular response to epidermal growth factor stimulus | 18/2897 | 45/18723 | 6.20e-05 | 1.44e-03 | 18 |
| GO:00708492 | Colorectum | MSS | response to epidermal growth factor | 20/3467 | 49/18723 | 2.36e-04 | 3.24e-03 | 20 |
| GO:00713642 | Colorectum | MSS | cellular response to epidermal growth factor stimulus | 18/3467 | 45/18723 | 6.38e-04 | 6.99e-03 | 18 |
| GO:00323921 | Colorectum | MSS | DNA geometric change | 29/3467 | 90/18723 | 1.26e-03 | 1.20e-02 | 29 |
| GO:00094101 | Colorectum | MSS | response to xenobiotic stimulus | 110/3467 | 462/18723 | 2.36e-03 | 1.92e-02 | 110 |
| GO:0006302 | Colorectum | MSS | double-strand break repair | 64/3467 | 251/18723 | 3.58e-03 | 2.65e-02 | 64 |
| GO:0032508 | Colorectum | MSS | DNA duplex unwinding | 25/3467 | 84/18723 | 8.27e-03 | 4.99e-02 | 25 |
| GO:00323926 | Esophagus | HGIN | DNA geometric change | 25/2587 | 90/18723 | 3.77e-04 | 5.85e-03 | 25 |
| GO:007084918 | Esophagus | HGIN | response to epidermal growth factor | 16/2587 | 49/18723 | 6.14e-04 | 8.56e-03 | 16 |
| GO:007136418 | Esophagus | HGIN | cellular response to epidermal growth factor stimulus | 15/2587 | 45/18723 | 7.05e-04 | 9.52e-03 | 15 |
| GO:00325084 | Esophagus | HGIN | DNA duplex unwinding | 22/2587 | 84/18723 | 1.91e-03 | 2.03e-02 | 22 |
| GO:00062604 | Esophagus | ESCC | DNA replication | 181/8552 | 260/18723 | 3.55e-15 | 2.05e-13 | 181 |
| GO:00062612 | Esophagus | ESCC | DNA-dependent DNA replication | 100/8552 | 151/18723 | 2.61e-07 | 3.94e-06 | 100 |
| GO:00063024 | Esophagus | ESCC | double-strand break repair | 152/8552 | 251/18723 | 1.33e-06 | 1.62e-05 | 152 |
| GO:007084919 | Esophagus | ESCC | response to epidermal growth factor | 38/8552 | 49/18723 | 5.24e-06 | 5.49e-05 | 38 |
| Page: 1 2 3 4 5 |
| Pathway ID | Tissue | Disease Stage | Description | Gene Ratio | Bg Ratio | pvalue | p.adjust | qvalue | Count |
| hsa041109 | Esophagus | HGIN | Cell cycle | 38/1383 | 157/8465 | 6.70e-03 | 4.37e-02 | 3.47e-02 | 38 |
| hsa0411016 | Esophagus | HGIN | Cell cycle | 38/1383 | 157/8465 | 6.70e-03 | 4.37e-02 | 3.47e-02 | 38 |
| hsa0411023 | Esophagus | ESCC | Cell cycle | 126/4205 | 157/8465 | 1.34e-15 | 5.60e-14 | 2.87e-14 | 126 |
| hsa030304 | Esophagus | ESCC | DNA replication | 32/4205 | 36/8465 | 7.71e-07 | 5.06e-06 | 2.59e-06 | 32 |
| hsa0411033 | Esophagus | ESCC | Cell cycle | 126/4205 | 157/8465 | 1.34e-15 | 5.60e-14 | 2.87e-14 | 126 |
| hsa0303011 | Esophagus | ESCC | DNA replication | 32/4205 | 36/8465 | 7.71e-07 | 5.06e-06 | 2.59e-06 | 32 |
| hsa041104 | Liver | Cirrhotic | Cell cycle | 61/2530 | 157/8465 | 9.53e-03 | 3.21e-02 | 1.98e-02 | 61 |
| hsa0411011 | Liver | Cirrhotic | Cell cycle | 61/2530 | 157/8465 | 9.53e-03 | 3.21e-02 | 1.98e-02 | 61 |
| hsa041102 | Liver | HCC | Cell cycle | 106/4020 | 157/8465 | 2.54e-07 | 3.04e-06 | 1.69e-06 | 106 |
| hsa041103 | Liver | HCC | Cell cycle | 106/4020 | 157/8465 | 2.54e-07 | 3.04e-06 | 1.69e-06 | 106 |
| hsa041108 | Oral cavity | OSCC | Cell cycle | 118/3704 | 157/8465 | 7.15e-16 | 2.66e-14 | 1.35e-14 | 118 |
| hsa03030 | Oral cavity | OSCC | DNA replication | 31/3704 | 36/8465 | 1.70e-07 | 1.19e-06 | 6.03e-07 | 31 |
| hsa0411015 | Oral cavity | OSCC | Cell cycle | 118/3704 | 157/8465 | 7.15e-16 | 2.66e-14 | 1.35e-14 | 118 |
| hsa030301 | Oral cavity | OSCC | DNA replication | 31/3704 | 36/8465 | 1.70e-07 | 1.19e-06 | 6.03e-07 | 31 |
| hsa030302 | Oral cavity | LP | DNA replication | 23/2418 | 36/8465 | 1.08e-05 | 7.79e-05 | 5.02e-05 | 23 |
| hsa0411022 | Oral cavity | LP | Cell cycle | 70/2418 | 157/8465 | 1.17e-05 | 8.27e-05 | 5.33e-05 | 70 |
| hsa030303 | Oral cavity | LP | DNA replication | 23/2418 | 36/8465 | 1.08e-05 | 7.79e-05 | 5.02e-05 | 23 |
| hsa0411032 | Oral cavity | LP | Cell cycle | 70/2418 | 157/8465 | 1.17e-05 | 8.27e-05 | 5.33e-05 | 70 |
| hsa0411021 | Prostate | Tumor | Cell cycle | 51/1791 | 157/8465 | 5.67e-04 | 2.89e-03 | 1.79e-03 | 51 |
| hsa0411031 | Prostate | Tumor | Cell cycle | 51/1791 | 157/8465 | 5.67e-04 | 2.89e-03 | 1.79e-03 | 51 |
| Page: 1 |
Top |
Cell-cell communication analysis |
| Identification of potential cell-cell interactions between two cell types and their ligand-receptor pairs for different disease states |
| Ligand | Receptor | LRpair | Pathway | Tissue | Disease Stage |
| Page: 1 |
Top |
Single-cell gene regulatory network inference analysis |
| Find out the significant the regulons (TFs) and the target genes of each regulon across cell types for different disease states |
| TF | Cell Type | Tissue | Disease Stage | Target Gene | RSS | Regulon Activity |
| ∗The dot plots of a searched regulon are shown for all cell subpopulations in each disease state of each tissue based on the regulon specific score inferred using pySCENIC and by calculating the average expression. |
| Page: 1 |
Top |
Somatic mutation of malignant transformation related genes |
| Annotation of somatic variants for genes involved in malignant transformation |
| Hugo Symbol | Variant Class | Variant Classification | dbSNP RS | HGVSc | HGVSp | HGVSp Short | SWISSPROT | BIOTYPE | SIFT | PolyPhen | Tumor Sample Barcode | Tissue | Histology | Sex | Age | Stage | Therapy Types | Drugs | Outcome |
| MCM7 | SNV | Missense_Mutation | c.1175N>T | p.Ser392Leu | p.S392L | P33993 | protein_coding | deleterious(0) | possibly_damaging(0.732) | TCGA-AC-A23H-01 | Breast | breast invasive carcinoma | Female | >=65 | I/II | Unknown | Unknown | PD | |
| MCM7 | SNV | Missense_Mutation | novel | c.365C>G | p.Pro122Arg | p.P122R | P33993 | protein_coding | tolerated(0.06) | benign(0.015) | TCGA-AC-A5XU-01 | Breast | breast invasive carcinoma | Female | >=65 | I/II | Hormone Therapy | letrozole | SD |
| MCM7 | SNV | Missense_Mutation | c.1869N>A | p.Asp623Glu | p.D623E | P33993 | protein_coding | tolerated(0.36) | benign(0.052) | TCGA-AN-A0AK-01 | Breast | breast invasive carcinoma | Female | >=65 | I/II | Unknown | Unknown | SD | |
| MCM7 | SNV | Missense_Mutation | c.382N>A | p.Ala128Thr | p.A128T | P33993 | protein_coding | deleterious(0.01) | benign(0.001) | TCGA-C8-A1HL-01 | Breast | breast invasive carcinoma | Female | <65 | III/IV | Unknown | Unknown | SD | |
| MCM7 | SNV | Missense_Mutation | rs775586840 | c.1594N>T | p.Arg532Trp | p.R532W | P33993 | protein_coding | deleterious(0) | probably_damaging(0.981) | TCGA-D8-A1X9-01 | Breast | breast invasive carcinoma | Female | >=65 | I/II | Chemotherapy | adriamycin+cyclophosphamide | SD |
| MCM7 | SNV | Missense_Mutation | rs374121810 | c.214N>T | p.Arg72Cys | p.R72C | P33993 | protein_coding | deleterious(0) | probably_damaging(1) | TCGA-D8-A1Y1-01 | Breast | breast invasive carcinoma | Female | >=65 | III/IV | Hormone Therapy | tamoxiphen | PD |
| MCM7 | SNV | Missense_Mutation | rs755514827 | c.491N>A | p.Arg164His | p.R164H | P33993 | protein_coding | deleterious(0) | probably_damaging(0.964) | TCGA-E9-A1N3-01 | Breast | breast invasive carcinoma | Female | >=65 | III/IV | Chemotherapy | 5-fluorouracil | CR |
| MCM7 | SNV | Missense_Mutation | novel | c.418N>C | p.Gly140Arg | p.G140R | P33993 | protein_coding | deleterious(0.04) | benign(0.027) | TCGA-OL-A66I-01 | Breast | breast invasive carcinoma | Female | <65 | I/II | Chemotherapy | adriamycin | CR |
| MCM7 | insertion | Frame_Shift_Ins | novel | c.970_971insCTGGAGGAGC | p.Leu324ProfsTer28 | p.L324Pfs*28 | P33993 | protein_coding | TCGA-A7-A4SC-01 | Breast | breast invasive carcinoma | Female | <65 | I/II | Hormone Therapy | tamoxiphen | SD | ||
| MCM7 | insertion | Frame_Shift_Ins | novel | c.1055_1056insTCCTGGCTCAG | p.Lys352AsnfsTer11 | p.K352Nfs*11 | P33993 | protein_coding | TCGA-AN-A0FX-01 | Breast | breast invasive carcinoma | Female | <65 | I/II | Unknown | Unknown | SD |
| Page: 1 2 3 4 5 6 7 8 |
Top |
Related drugs of malignant transformation related genes |
| Identification of chemicals and drugs interact with genes involved in malignant transfromation |
| (DGIdb 4.0) |
| Entrez ID | Symbol | Category | Interaction Types | Drug Claim Name | Drug Name | PMIDs |
| Page: 1 |

Copyright 2023-Present -The University of Texas Health Science Center at Houston |