
|
|||||
|
 | |
| |
| |
| |
| |
| |
|
Gene: MCM2 |
Gene summary for MCM2 |
| Gene information | Species | Human | Gene symbol | MCM2 | Gene ID | 4171 |
| Gene name | minichromosome maintenance complex component 2 | |
| Gene Alias | BM28 | |
| Cytomap | 3q21.3 | |
| Gene Type | protein-coding | GO ID | GO:0000278 | UniProtAcc | P49736 |
Top |
Malignant transformation analysis |
| Identification of the aberrant gene expression in precancerous and cancerous lesions by comparing the gene expression of stem-like cells in diseased tissues with normal stem cells |
| Entrez ID | Symbol | Replicates | Species | Organ | Tissue | Adj P-value | Log2FC | Malignancy |
| 4171 | MCM2 | HCC2 | Human | Liver | HCC | 2.91e-02 | 8.45e-01 | 0.5341 |
| 4171 | MCM2 | S014 | Human | Liver | HCC | 1.17e-24 | 7.67e-01 | 0.2254 |
| 4171 | MCM2 | S015 | Human | Liver | HCC | 5.03e-21 | 6.41e-01 | 0.2375 |
| 4171 | MCM2 | S016 | Human | Liver | HCC | 1.09e-17 | 6.15e-01 | 0.2243 |
| 4171 | MCM2 | S027 | Human | Liver | HCC | 4.46e-04 | 3.19e-01 | 0.2446 |
| 4171 | MCM2 | S028 | Human | Liver | HCC | 7.94e-11 | 4.38e-01 | 0.2503 |
| 4171 | MCM2 | S029 | Human | Liver | HCC | 3.29e-05 | 1.73e-01 | 0.2581 |
| 4171 | MCM2 | C04 | Human | Oral cavity | OSCC | 1.01e-09 | 6.47e-01 | 0.2633 |
| 4171 | MCM2 | C21 | Human | Oral cavity | OSCC | 1.93e-23 | 1.01e+00 | 0.2678 |
| 4171 | MCM2 | C30 | Human | Oral cavity | OSCC | 9.41e-23 | 1.48e+00 | 0.3055 |
| 4171 | MCM2 | C38 | Human | Oral cavity | OSCC | 3.21e-07 | 9.98e-01 | 0.172 |
| 4171 | MCM2 | C43 | Human | Oral cavity | OSCC | 8.73e-47 | 8.43e-01 | 0.1704 |
| 4171 | MCM2 | C46 | Human | Oral cavity | OSCC | 4.74e-42 | 8.74e-01 | 0.1673 |
| 4171 | MCM2 | C51 | Human | Oral cavity | OSCC | 2.56e-07 | 5.04e-01 | 0.2674 |
| 4171 | MCM2 | C57 | Human | Oral cavity | OSCC | 8.78e-22 | 9.23e-01 | 0.1679 |
| 4171 | MCM2 | C06 | Human | Oral cavity | OSCC | 1.10e-03 | 1.40e+00 | 0.2699 |
| 4171 | MCM2 | C08 | Human | Oral cavity | OSCC | 4.21e-14 | 4.62e-01 | 0.1919 |
| 4171 | MCM2 | LN22 | Human | Oral cavity | OSCC | 1.10e-14 | 1.25e+00 | 0.1733 |
| 4171 | MCM2 | LN38 | Human | Oral cavity | OSCC | 1.34e-02 | 1.11e+00 | 0.168 |
| 4171 | MCM2 | LN46 | Human | Oral cavity | OSCC | 4.47e-21 | 7.59e-01 | 0.1666 |
| Page: 1 2 3 4 5 |
| Tissue | Expression Dynamics | Abbreviation |
| Colorectum (GSE201348) |  | FAP: Familial adenomatous polyposis |
| CRC: Colorectal cancer | ||
| Colorectum (HTA11) |  | AD: Adenomas |
| SER: Sessile serrated lesions | ||
| MSI-H: Microsatellite-high colorectal cancer | ||
| MSS: Microsatellite stable colorectal cancer | ||
| Esophagus |  | ESCC: Esophageal squamous cell carcinoma |
| HGIN: High-grade intraepithelial neoplasias | ||
| LGIN: Low-grade intraepithelial neoplasias | ||
| Liver | 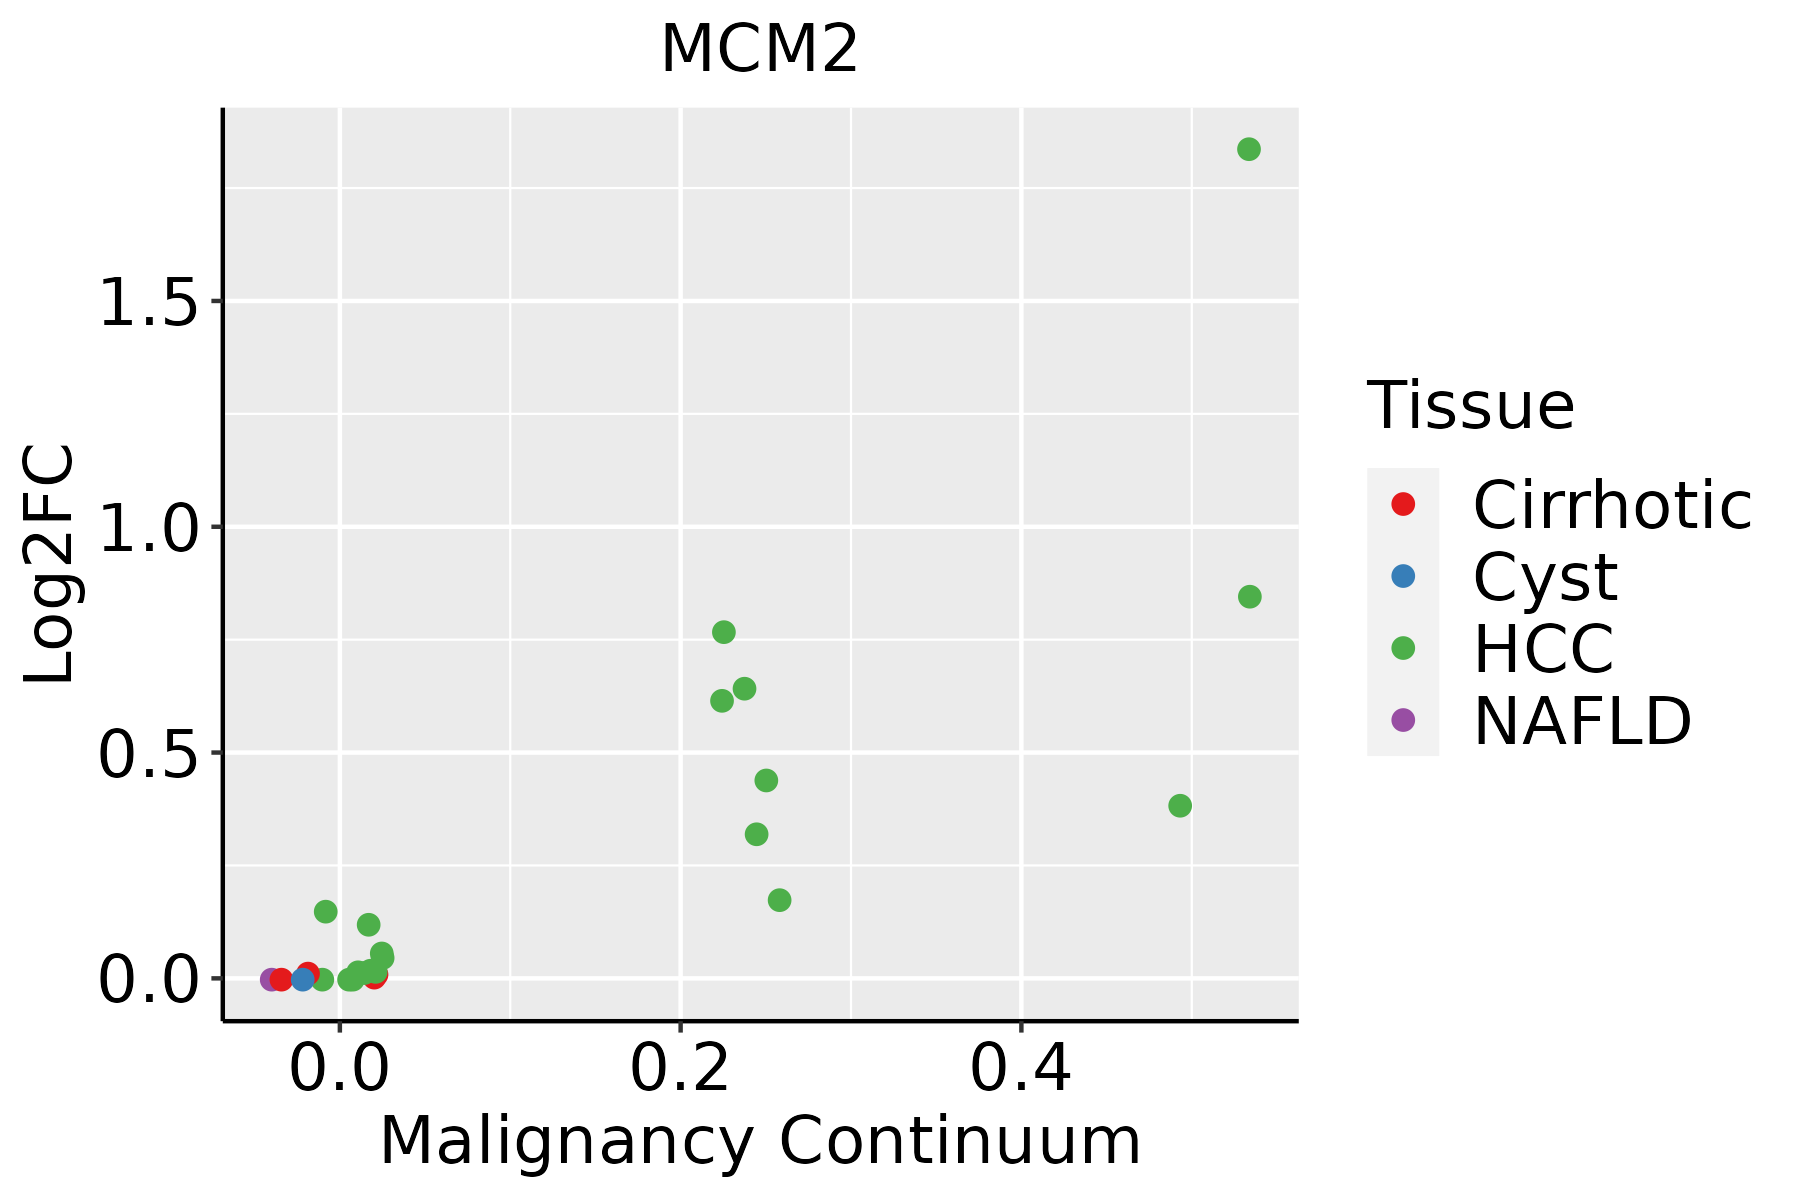 | HCC: Hepatocellular carcinoma |
| NAFLD: Non-alcoholic fatty liver disease | ||
| Oral Cavity | 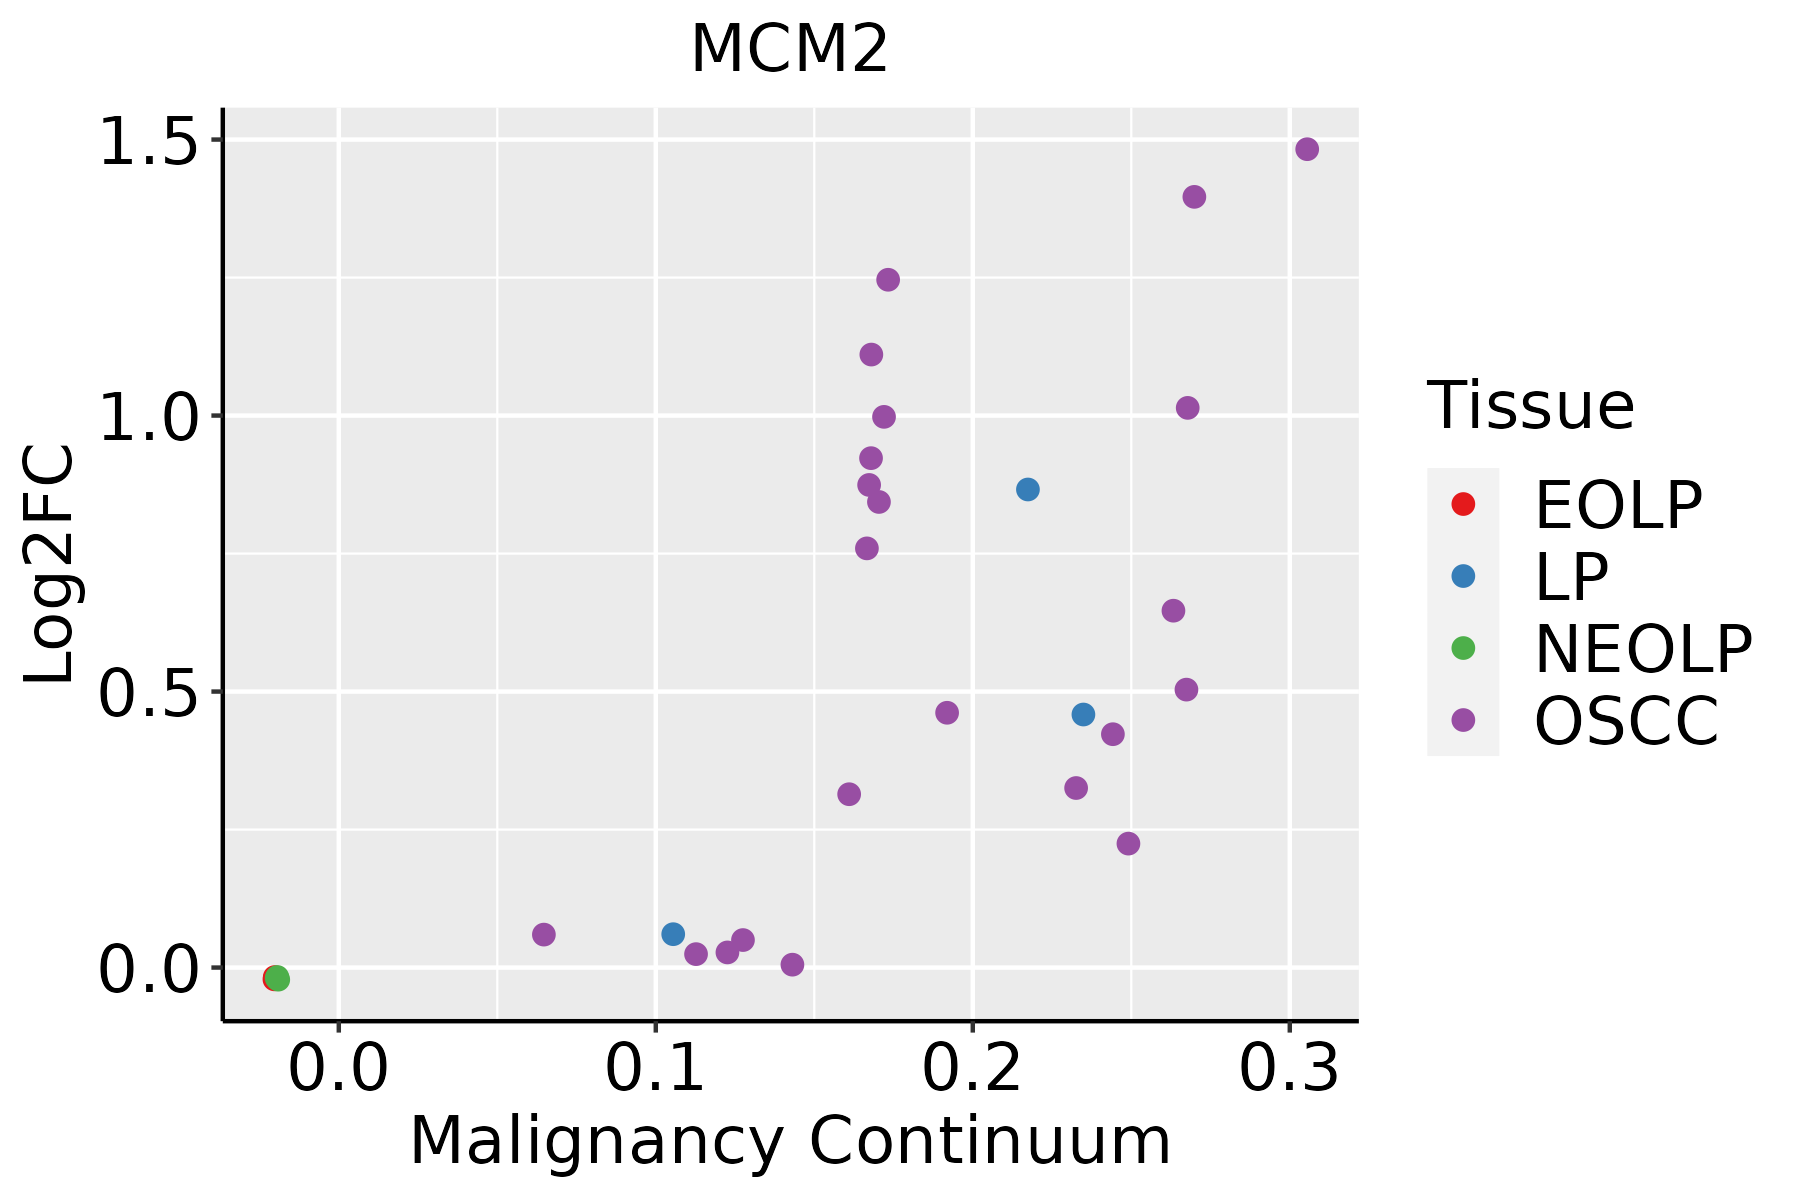 | EOLP: Erosive Oral lichen planus |
| LP: leukoplakia | ||
| NEOLP: Non-erosive oral lichen planus | ||
| OSCC: Oral squamous cell carcinoma |
| ∗log2FC in expression of this searched gene in stem-like cells from each diseased tissue sample relative to stem-like cells in normal samples in each tissue plotted against the malignancy continuum. Samples are colored based on if they are from different disease stage. |
Top |
Malignant transformation related pathway analysis |
| Find out the enriched GO biological processes and KEGG pathways involved in transition from healthy to precancer to cancer |
| Tissue | Disease Stage | Enriched GO biological Processes |
| Colorectum | AD |  |
| Colorectum | SER |  |
| Colorectum | MSS |  |
| Colorectum | MSI-H |  |
| Colorectum | FAP |  |
| ∗Top 15 enriched GO BP terms are showed in the bar plot of each disease state in each tissue. Each row represents a significant GO biological process which is colored according to the -log10(p.adjust). |
| Page: 1 2 3 4 5 6 7 8 9 |
| GO ID | Tissue | Disease Stage | Description | Gene Ratio | Bg Ratio | pvalue | p.adjust | Count |
| GO:0010639 | Colorectum | AD | negative regulation of organelle organization | 114/3918 | 348/18723 | 1.41e-07 | 6.49e-06 | 114 |
| GO:0006325 | Colorectum | AD | chromatin organization | 119/3918 | 409/18723 | 4.85e-05 | 8.33e-04 | 119 |
| GO:0033044 | Colorectum | AD | regulation of chromosome organization | 60/3918 | 187/18723 | 2.25e-04 | 2.94e-03 | 60 |
| GO:0032392 | Colorectum | AD | DNA geometric change | 31/3918 | 90/18723 | 2.02e-03 | 1.63e-02 | 31 |
| GO:0006338 | Colorectum | AD | chromatin remodeling | 70/3918 | 255/18723 | 7.44e-03 | 4.53e-02 | 70 |
| GO:00106391 | Colorectum | SER | negative regulation of organelle organization | 90/2897 | 348/18723 | 3.14e-07 | 1.69e-05 | 90 |
| GO:00063251 | Colorectum | SER | chromatin organization | 89/2897 | 409/18723 | 4.15e-04 | 6.17e-03 | 89 |
| GO:00106392 | Colorectum | MSS | negative regulation of organelle organization | 102/3467 | 348/18723 | 5.36e-07 | 2.05e-05 | 102 |
| GO:00063252 | Colorectum | MSS | chromatin organization | 107/3467 | 409/18723 | 7.22e-05 | 1.21e-03 | 107 |
| GO:00330441 | Colorectum | MSS | regulation of chromosome organization | 55/3467 | 187/18723 | 1.86e-04 | 2.63e-03 | 55 |
| GO:00323921 | Colorectum | MSS | DNA geometric change | 29/3467 | 90/18723 | 1.26e-03 | 1.20e-02 | 29 |
| GO:0006302 | Colorectum | MSS | double-strand break repair | 64/3467 | 251/18723 | 3.58e-03 | 2.65e-02 | 64 |
| GO:0032508 | Colorectum | MSS | DNA duplex unwinding | 25/3467 | 84/18723 | 8.27e-03 | 4.99e-02 | 25 |
| GO:003304416 | Esophagus | ESCC | regulation of chromosome organization | 145/8552 | 187/18723 | 3.80e-19 | 4.31e-17 | 145 |
| GO:00062604 | Esophagus | ESCC | DNA replication | 181/8552 | 260/18723 | 3.55e-15 | 2.05e-13 | 181 |
| GO:0010639110 | Esophagus | ESCC | negative regulation of organelle organization | 215/8552 | 348/18723 | 8.20e-10 | 2.01e-08 | 215 |
| GO:000632517 | Esophagus | ESCC | chromatin organization | 240/8552 | 409/18723 | 6.52e-08 | 1.14e-06 | 240 |
| GO:00062612 | Esophagus | ESCC | DNA-dependent DNA replication | 100/8552 | 151/18723 | 2.61e-07 | 3.94e-06 | 100 |
| GO:00063024 | Esophagus | ESCC | double-strand break repair | 152/8552 | 251/18723 | 1.33e-06 | 1.62e-05 | 152 |
| GO:20012513 | Esophagus | ESCC | negative regulation of chromosome organization | 60/8552 | 86/18723 | 5.20e-06 | 5.45e-05 | 60 |
| Page: 1 2 3 4 |
| Pathway ID | Tissue | Disease Stage | Description | Gene Ratio | Bg Ratio | pvalue | p.adjust | qvalue | Count |
| hsa0411023 | Esophagus | ESCC | Cell cycle | 126/4205 | 157/8465 | 1.34e-15 | 5.60e-14 | 2.87e-14 | 126 |
| hsa030304 | Esophagus | ESCC | DNA replication | 32/4205 | 36/8465 | 7.71e-07 | 5.06e-06 | 2.59e-06 | 32 |
| hsa0411033 | Esophagus | ESCC | Cell cycle | 126/4205 | 157/8465 | 1.34e-15 | 5.60e-14 | 2.87e-14 | 126 |
| hsa0303011 | Esophagus | ESCC | DNA replication | 32/4205 | 36/8465 | 7.71e-07 | 5.06e-06 | 2.59e-06 | 32 |
| hsa041102 | Liver | HCC | Cell cycle | 106/4020 | 157/8465 | 2.54e-07 | 3.04e-06 | 1.69e-06 | 106 |
| hsa041103 | Liver | HCC | Cell cycle | 106/4020 | 157/8465 | 2.54e-07 | 3.04e-06 | 1.69e-06 | 106 |
| hsa041108 | Oral cavity | OSCC | Cell cycle | 118/3704 | 157/8465 | 7.15e-16 | 2.66e-14 | 1.35e-14 | 118 |
| hsa03030 | Oral cavity | OSCC | DNA replication | 31/3704 | 36/8465 | 1.70e-07 | 1.19e-06 | 6.03e-07 | 31 |
| hsa0411015 | Oral cavity | OSCC | Cell cycle | 118/3704 | 157/8465 | 7.15e-16 | 2.66e-14 | 1.35e-14 | 118 |
| hsa030301 | Oral cavity | OSCC | DNA replication | 31/3704 | 36/8465 | 1.70e-07 | 1.19e-06 | 6.03e-07 | 31 |
| hsa030302 | Oral cavity | LP | DNA replication | 23/2418 | 36/8465 | 1.08e-05 | 7.79e-05 | 5.02e-05 | 23 |
| hsa0411022 | Oral cavity | LP | Cell cycle | 70/2418 | 157/8465 | 1.17e-05 | 8.27e-05 | 5.33e-05 | 70 |
| hsa030303 | Oral cavity | LP | DNA replication | 23/2418 | 36/8465 | 1.08e-05 | 7.79e-05 | 5.02e-05 | 23 |
| hsa0411032 | Oral cavity | LP | Cell cycle | 70/2418 | 157/8465 | 1.17e-05 | 8.27e-05 | 5.33e-05 | 70 |
| Page: 1 |
Top |
Cell-cell communication analysis |
| Identification of potential cell-cell interactions between two cell types and their ligand-receptor pairs for different disease states |
| Ligand | Receptor | LRpair | Pathway | Tissue | Disease Stage |
| Page: 1 |
Top |
Single-cell gene regulatory network inference analysis |
| Find out the significant the regulons (TFs) and the target genes of each regulon across cell types for different disease states |
| TF | Cell Type | Tissue | Disease Stage | Target Gene | RSS | Regulon Activity |
| ∗The dot plots of a searched regulon are shown for all cell subpopulations in each disease state of each tissue based on the regulon specific score inferred using pySCENIC and by calculating the average expression. |
| Page: 1 |
Top |
Somatic mutation of malignant transformation related genes |
| Annotation of somatic variants for genes involved in malignant transformation |
| Hugo Symbol | Variant Class | Variant Classification | dbSNP RS | HGVSc | HGVSp | HGVSp Short | SWISSPROT | BIOTYPE | SIFT | PolyPhen | Tumor Sample Barcode | Tissue | Histology | Sex | Age | Stage | Therapy Types | Drugs | Outcome |
| MCM2 | SNV | Missense_Mutation | novel | c.1265N>G | p.Tyr422Cys | p.Y422C | P49736 | protein_coding | deleterious(0) | probably_damaging(0.968) | TCGA-A8-A07R-01 | Breast | breast invasive carcinoma | Female | >=65 | III/IV | Ancillary | zoledronic | SD |
| MCM2 | SNV | Missense_Mutation | rs756423886 | c.550N>A | p.Glu184Lys | p.E184K | P49736 | protein_coding | deleterious(0.02) | probably_damaging(0.974) | TCGA-BH-A0HF-01 | Breast | breast invasive carcinoma | Female | >=65 | I/II | Hormone Therapy | arimidex | SD |
| MCM2 | insertion | Frame_Shift_Ins | novel | c.189_190insTCAGCAAAATGGCCCTGGTGTGACC | p.Glu64SerfsTer36 | p.E64Sfs*36 | P49736 | protein_coding | TCGA-A8-A07B-01 | Breast | breast invasive carcinoma | Female | >=65 | I/II | Unknown | Unknown | SD | ||
| MCM2 | insertion | Frame_Shift_Ins | novel | c.1143_1144insGGGCCCCTGGACCATA | p.Pro382GlyfsTer47 | p.P382Gfs*47 | P49736 | protein_coding | TCGA-A8-A07J-01 | Breast | breast invasive carcinoma | Female | <65 | I/II | Chemotherapy | 5-fluorouracil | CR | ||
| MCM2 | insertion | Frame_Shift_Ins | novel | c.181_182insATTTAATAGCAGAATTGATCAA | p.Gly61AspfsTer38 | p.G61Dfs*38 | P49736 | protein_coding | TCGA-AN-A0FX-01 | Breast | breast invasive carcinoma | Female | <65 | I/II | Unknown | Unknown | SD | ||
| MCM2 | SNV | Missense_Mutation | rs759341862 | c.653G>A | p.Arg218His | p.R218H | P49736 | protein_coding | deleterious(0) | possibly_damaging(0.587) | TCGA-2W-A8YY-01 | Cervix | cervical & endocervical cancer | Female | <65 | I/II | Chemotherapy | cisplatin | CR |
| MCM2 | SNV | Missense_Mutation | rs771959565 | c.1144C>T | p.Pro382Ser | p.P382S | P49736 | protein_coding | deleterious(0) | possibly_damaging(0.897) | TCGA-2W-A8YY-01 | Cervix | cervical & endocervical cancer | Female | <65 | I/II | Chemotherapy | cisplatin | CR |
| MCM2 | SNV | Missense_Mutation | rs781253937 | c.1652N>T | p.Ala551Val | p.A551V | P49736 | protein_coding | deleterious(0) | probably_damaging(0.994) | TCGA-EA-A410-01 | Cervix | cervical & endocervical cancer | Female | <65 | I/II | Unknown | Unknown | SD |
| MCM2 | SNV | Missense_Mutation | rs200231306 | c.455N>A | p.Arg152His | p.R152H | P49736 | protein_coding | tolerated(0.13) | probably_damaging(0.985) | TCGA-EK-A2GZ-01 | Cervix | cervical & endocervical cancer | Female | <65 | III/IV | Unknown | Unknown | SD |
| MCM2 | SNV | Missense_Mutation | novel | c.227G>T | p.Gly76Val | p.G76V | P49736 | protein_coding | deleterious(0.02) | benign(0.172) | TCGA-ZX-AA5X-01 | Cervix | cervical & endocervical cancer | Female | <65 | III/IV | Unknown | Unknown | SD |
| Page: 1 2 3 4 5 6 7 8 9 |
Top |
Related drugs of malignant transformation related genes |
| Identification of chemicals and drugs interact with genes involved in malignant transfromation |
| (DGIdb 4.0) |
| Entrez ID | Symbol | Category | Interaction Types | Drug Claim Name | Drug Name | PMIDs |
| Page: 1 |

Copyright 2023-Present -The University of Texas Health Science Center at Houston |