
|
|||||
|
 | |
| |
| |
| |
| |
| |
|
Gene: MACROD1 |
Gene summary for MACROD1 |
| Gene information | Species | Human | Gene symbol | MACROD1 | Gene ID | 28992 |
| Gene name | mono-ADP ribosylhydrolase 1 | |
| Gene Alias | LRP16 | |
| Cytomap | 11q13.1 | |
| Gene Type | protein-coding | GO ID | GO:0006139 | UniProtAcc | Q9BQ69 |
Top |
Malignant transformation analysis |
| Identification of the aberrant gene expression in precancerous and cancerous lesions by comparing the gene expression of stem-like cells in diseased tissues with normal stem cells |
| Entrez ID | Symbol | Replicates | Species | Organ | Tissue | Adj P-value | Log2FC | Malignancy |
| 28992 | MACROD1 | S43 | Human | Liver | Cirrhotic | 6.13e-06 | -1.73e-01 | -0.0187 |
| 28992 | MACROD1 | HCC1_Meng | Human | Liver | HCC | 2.01e-19 | -1.43e-01 | 0.0246 |
| 28992 | MACROD1 | HCC2_Meng | Human | Liver | HCC | 1.49e-19 | 5.09e-02 | 0.0107 |
| 28992 | MACROD1 | HCC5 | Human | Liver | HCC | 2.05e-02 | 2.39e-01 | 0.4932 |
| 28992 | MACROD1 | S014 | Human | Liver | HCC | 3.09e-07 | 4.35e-01 | 0.2254 |
| 28992 | MACROD1 | S016 | Human | Liver | HCC | 3.89e-05 | 3.65e-01 | 0.2243 |
| 28992 | MACROD1 | S027 | Human | Liver | HCC | 9.63e-04 | 5.45e-01 | 0.2446 |
| 28992 | MACROD1 | S028 | Human | Liver | HCC | 1.08e-08 | 6.41e-01 | 0.2503 |
| 28992 | MACROD1 | S029 | Human | Liver | HCC | 7.89e-11 | 7.46e-01 | 0.2581 |
| 28992 | MACROD1 | C04 | Human | Oral cavity | OSCC | 1.38e-11 | 7.03e-01 | 0.2633 |
| 28992 | MACROD1 | C21 | Human | Oral cavity | OSCC | 1.12e-52 | 1.68e+00 | 0.2678 |
| 28992 | MACROD1 | C30 | Human | Oral cavity | OSCC | 5.61e-13 | 5.56e-01 | 0.3055 |
| 28992 | MACROD1 | C43 | Human | Oral cavity | OSCC | 4.58e-28 | 6.50e-01 | 0.1704 |
| 28992 | MACROD1 | C46 | Human | Oral cavity | OSCC | 1.71e-37 | 9.15e-01 | 0.1673 |
| 28992 | MACROD1 | C51 | Human | Oral cavity | OSCC | 4.44e-03 | 3.27e-01 | 0.2674 |
| 28992 | MACROD1 | C57 | Human | Oral cavity | OSCC | 1.25e-04 | 4.26e-01 | 0.1679 |
| 28992 | MACROD1 | C07 | Human | Oral cavity | OSCC | 5.55e-05 | 6.85e-01 | 0.2491 |
| 28992 | MACROD1 | C08 | Human | Oral cavity | OSCC | 1.09e-06 | 3.11e-01 | 0.1919 |
| 28992 | MACROD1 | C09 | Human | Oral cavity | OSCC | 2.19e-07 | 2.58e-01 | 0.1431 |
| 28992 | MACROD1 | LN22 | Human | Oral cavity | OSCC | 4.27e-06 | 6.05e-01 | 0.1733 |
| Page: 1 2 3 4 5 |
| Tissue | Expression Dynamics | Abbreviation |
| Esophagus | 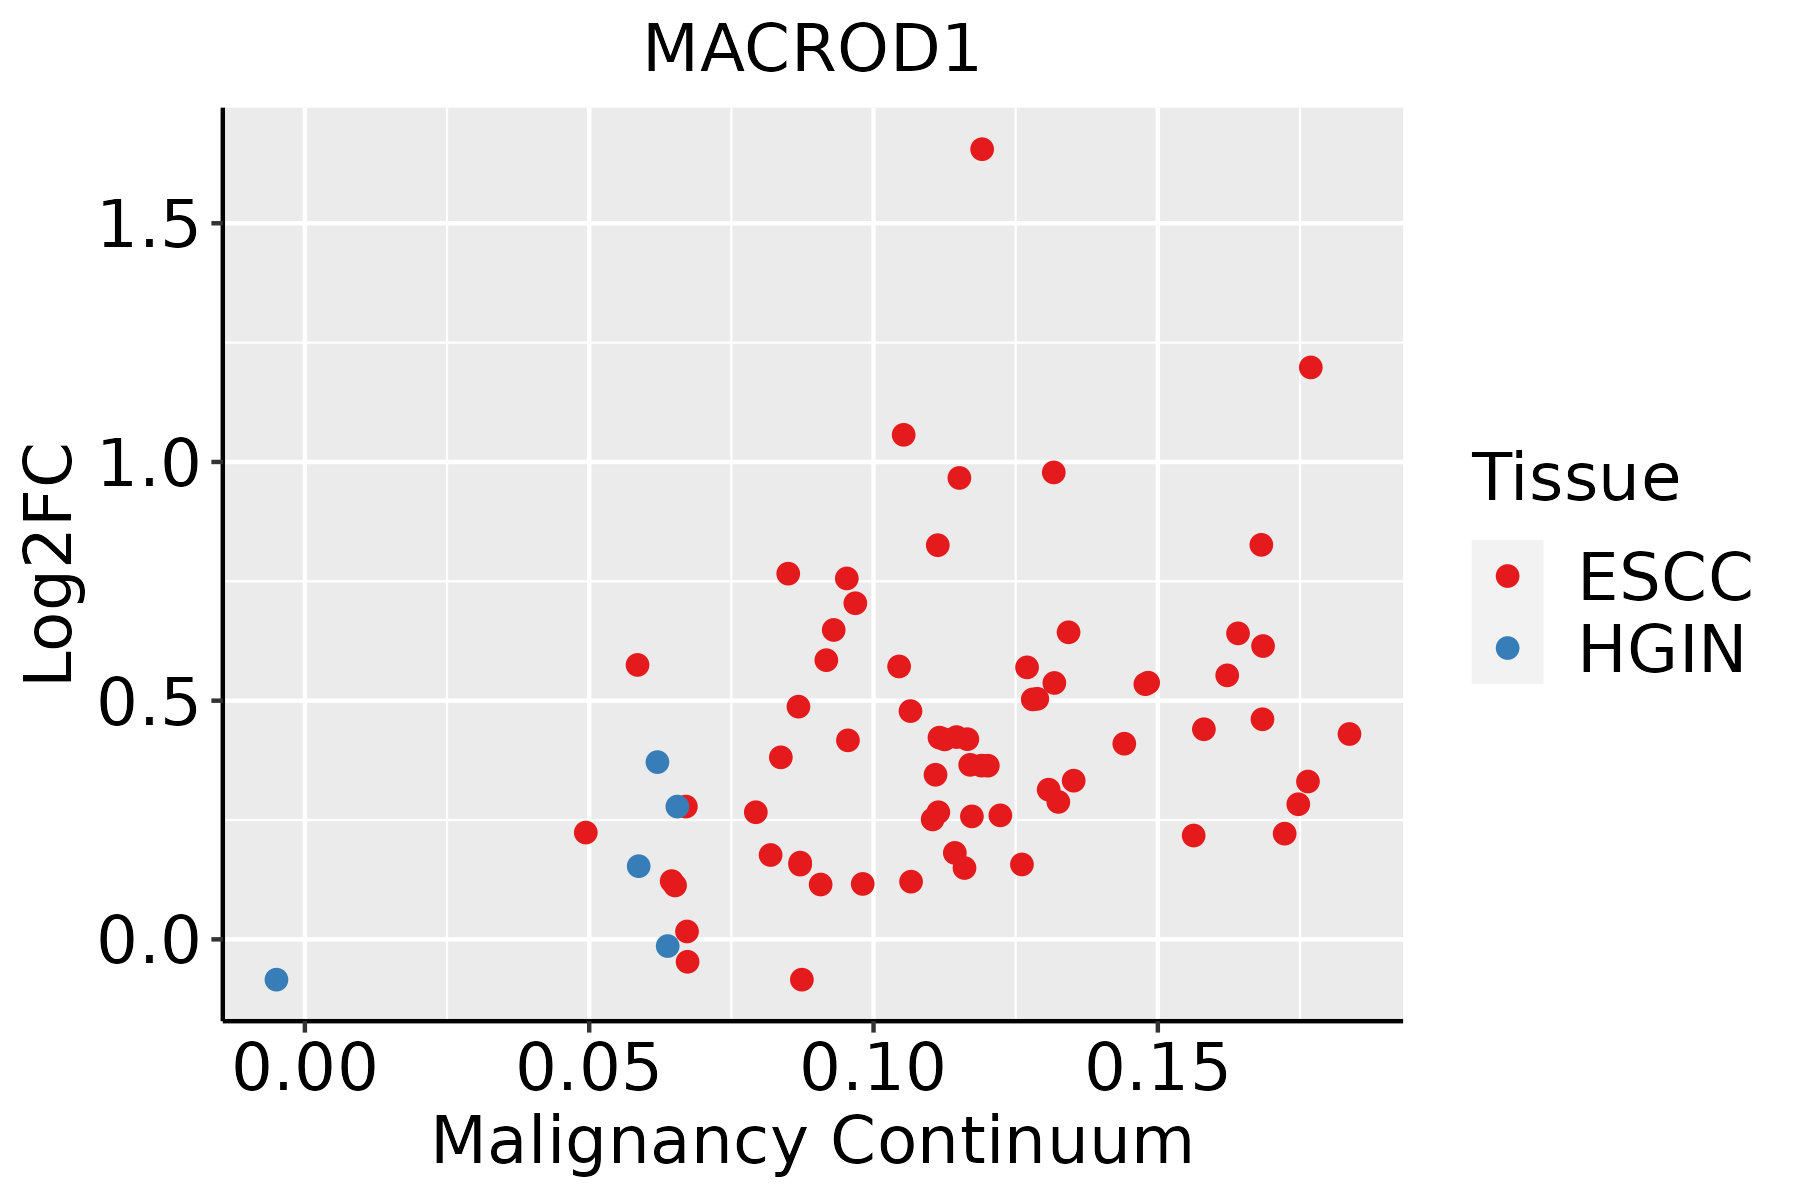 | ESCC: Esophageal squamous cell carcinoma |
| HGIN: High-grade intraepithelial neoplasias | ||
| LGIN: Low-grade intraepithelial neoplasias | ||
| Liver | 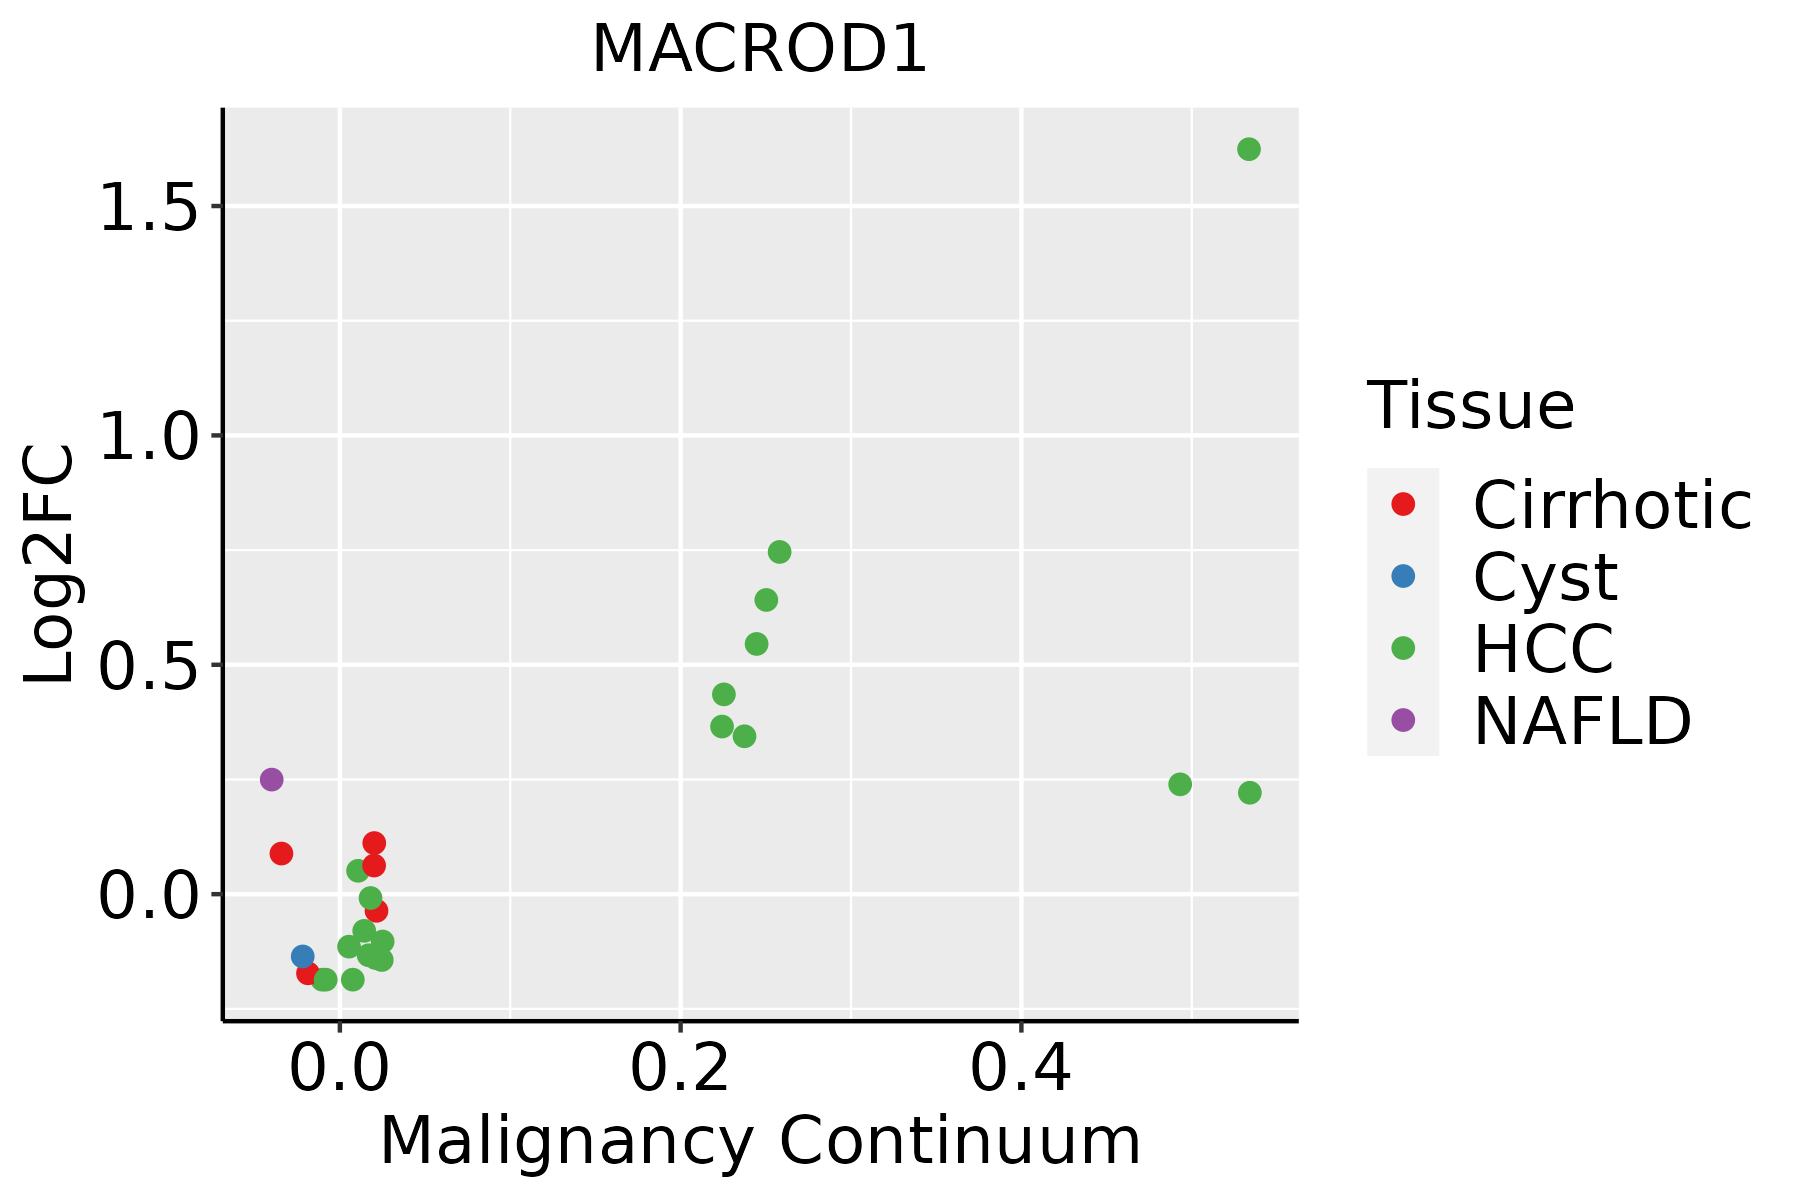 | HCC: Hepatocellular carcinoma |
| NAFLD: Non-alcoholic fatty liver disease | ||
| Oral Cavity |  | EOLP: Erosive Oral lichen planus |
| LP: leukoplakia | ||
| NEOLP: Non-erosive oral lichen planus | ||
| OSCC: Oral squamous cell carcinoma | ||
| Thyroid |  | ATC: Anaplastic thyroid cancer |
| HT: Hashimoto's thyroiditis | ||
| PTC: Papillary thyroid cancer |
| ∗log2FC in expression of this searched gene in stem-like cells from each diseased tissue sample relative to stem-like cells in normal samples in each tissue plotted against the malignancy continuum. Samples are colored based on if they are from different disease stage. |
Top |
Malignant transformation related pathway analysis |
| Find out the enriched GO biological processes and KEGG pathways involved in transition from healthy to precancer to cancer |
| Tissue | Disease Stage | Enriched GO biological Processes |
| Colorectum | AD |  |
| Colorectum | SER |  |
| Colorectum | MSS |  |
| Colorectum | MSI-H |  |
| Colorectum | FAP |  |
| ∗Top 15 enriched GO BP terms are showed in the bar plot of each disease state in each tissue. Each row represents a significant GO biological process which is colored according to the -log10(p.adjust). |
| Page: 1 2 3 4 5 6 7 8 9 |
| GO ID | Tissue | Disease Stage | Description | Gene Ratio | Bg Ratio | pvalue | p.adjust | Count |
| GO:0072521111 | Esophagus | ESCC | purine-containing compound metabolic process | 238/8552 | 416/18723 | 1.20e-06 | 1.49e-05 | 238 |
| GO:19016574 | Esophagus | ESCC | glycosyl compound metabolic process | 57/8552 | 88/18723 | 2.32e-04 | 1.44e-03 | 57 |
| GO:00091163 | Esophagus | ESCC | nucleoside metabolic process | 39/8552 | 62/18723 | 4.68e-03 | 1.82e-02 | 39 |
| GO:007252112 | Liver | Cirrhotic | purine-containing compound metabolic process | 156/4634 | 416/18723 | 3.74e-09 | 1.52e-07 | 156 |
| GO:19016572 | Liver | Cirrhotic | glycosyl compound metabolic process | 37/4634 | 88/18723 | 2.70e-04 | 2.40e-03 | 37 |
| GO:0042278 | Liver | Cirrhotic | purine nucleoside metabolic process | 13/4634 | 26/18723 | 4.72e-03 | 2.48e-02 | 13 |
| GO:0009116 | Liver | Cirrhotic | nucleoside metabolic process | 25/4634 | 62/18723 | 4.90e-03 | 2.56e-02 | 25 |
| GO:007252122 | Liver | HCC | purine-containing compound metabolic process | 250/7958 | 416/18723 | 2.26e-13 | 1.24e-11 | 250 |
| GO:19016571 | Liver | HCC | glycosyl compound metabolic process | 55/7958 | 88/18723 | 1.20e-04 | 1.01e-03 | 55 |
| GO:00091161 | Liver | HCC | nucleoside metabolic process | 37/7958 | 62/18723 | 4.73e-03 | 2.02e-02 | 37 |
| GO:19016573 | Oral cavity | OSCC | glycosyl compound metabolic process | 52/7305 | 88/18723 | 1.06e-04 | 7.84e-04 | 52 |
| GO:007252120 | Oral cavity | OSCC | purine-containing compound metabolic process | 199/7305 | 416/18723 | 1.34e-04 | 9.53e-04 | 199 |
| GO:00091162 | Oral cavity | OSCC | nucleoside metabolic process | 37/7305 | 62/18723 | 7.79e-04 | 4.23e-03 | 37 |
| GO:190165711 | Oral cavity | LP | glycosyl compound metabolic process | 43/4623 | 88/18723 | 7.80e-07 | 2.05e-05 | 43 |
| GO:000911611 | Oral cavity | LP | nucleoside metabolic process | 31/4623 | 62/18723 | 1.46e-05 | 2.57e-04 | 31 |
| GO:0072521110 | Oral cavity | LP | purine-containing compound metabolic process | 130/4623 | 416/18723 | 1.30e-03 | 1.05e-02 | 130 |
| GO:00422781 | Oral cavity | LP | purine nucleoside metabolic process | 14/4623 | 26/18723 | 1.33e-03 | 1.07e-02 | 14 |
| GO:007252127 | Thyroid | PTC | purine-containing compound metabolic process | 182/5968 | 416/18723 | 1.92e-07 | 3.51e-06 | 182 |
| GO:007252128 | Thyroid | ATC | purine-containing compound metabolic process | 189/6293 | 416/18723 | 2.83e-07 | 4.29e-06 | 189 |
| Page: 1 |
| Pathway ID | Tissue | Disease Stage | Description | Gene Ratio | Bg Ratio | pvalue | p.adjust | qvalue | Count |
| Page: 1 |
Top |
Cell-cell communication analysis |
| Identification of potential cell-cell interactions between two cell types and their ligand-receptor pairs for different disease states |
| Ligand | Receptor | LRpair | Pathway | Tissue | Disease Stage |
| Page: 1 |
Top |
Single-cell gene regulatory network inference analysis |
| Find out the significant the regulons (TFs) and the target genes of each regulon across cell types for different disease states |
| TF | Cell Type | Tissue | Disease Stage | Target Gene | RSS | Regulon Activity |
| ∗The dot plots of a searched regulon are shown for all cell subpopulations in each disease state of each tissue based on the regulon specific score inferred using pySCENIC and by calculating the average expression. |
| Page: 1 |
Top |
Somatic mutation of malignant transformation related genes |
| Annotation of somatic variants for genes involved in malignant transformation |
| Hugo Symbol | Variant Class | Variant Classification | dbSNP RS | HGVSc | HGVSp | HGVSp Short | SWISSPROT | BIOTYPE | SIFT | PolyPhen | Tumor Sample Barcode | Tissue | Histology | Sex | Age | Stage | Therapy Types | Drugs | Outcome |
| MACROD1 | SNV | Missense_Mutation | c.649C>G | p.Arg217Gly | p.R217G | Q9BQ69 | protein_coding | tolerated(0.38) | benign(0.106) | TCGA-AC-A23H-01 | Breast | breast invasive carcinoma | Female | >=65 | I/II | Unknown | Unknown | PD | |
| MACROD1 | SNV | Missense_Mutation | c.571G>A | p.Ala191Thr | p.A191T | Q9BQ69 | protein_coding | deleterious(0) | probably_damaging(1) | TCGA-CK-4951-01 | Colorectum | colon adenocarcinoma | Female | >=65 | I/II | Unknown | Unknown | PD | |
| MACROD1 | SNV | Missense_Mutation | c.571G>A | p.Ala191Thr | p.A191T | Q9BQ69 | protein_coding | deleterious(0) | probably_damaging(1) | TCGA-F4-6460-01 | Colorectum | colon adenocarcinoma | Female | <65 | III/IV | Chemotherapy | capecitabine | PD | |
| MACROD1 | SNV | Missense_Mutation | c.866N>C | p.Glu289Ala | p.E289A | Q9BQ69 | protein_coding | deleterious(0.01) | benign(0.007) | TCGA-G4-6588-01 | Colorectum | colon adenocarcinoma | Female | <65 | I/II | Unknown | Unknown | SD | |
| MACROD1 | SNV | Missense_Mutation | rs142560390 | c.395N>T | p.Ala132Val | p.A132V | Q9BQ69 | protein_coding | tolerated(0.27) | benign(0.007) | TCGA-AX-A1CE-01 | Endometrium | uterine corpus endometrioid carcinoma | Female | <65 | I/II | Unspecific | Paclitaxel | SD |
| MACROD1 | SNV | Missense_Mutation | c.470N>C | p.Leu157Pro | p.L157P | Q9BQ69 | protein_coding | deleterious(0) | benign(0.324) | TCGA-BC-A10U-01 | Liver | liver hepatocellular carcinoma | Male | >=65 | I/II | Unknown | Unknown | PD | |
| MACROD1 | SNV | Missense_Mutation | c.517N>T | p.Ala173Ser | p.A173S | Q9BQ69 | protein_coding | deleterious(0) | probably_damaging(0.99) | TCGA-L9-A7SV-01 | Lung | lung adenocarcinoma | Male | >=65 | I/II | Chemotherapy | cisplatin | CR | |
| MACROD1 | SNV | Missense_Mutation | c.390N>C | p.Glu130Asp | p.E130D | Q9BQ69 | protein_coding | tolerated(0.15) | benign(0) | TCGA-37-3783-01 | Lung | lung squamous cell carcinoma | Male | <65 | III/IV | Unknown | Unknown | SD | |
| MACROD1 | SNV | Missense_Mutation | novel | c.742C>G | p.Leu248Val | p.L248V | Q9BQ69 | protein_coding | tolerated(0.54) | benign(0.031) | TCGA-85-8666-01 | Lung | lung squamous cell carcinoma | Male | >=65 | I/II | Unknown | Unknown | SD |
| Page: 1 |
Top |
Related drugs of malignant transformation related genes |
| Identification of chemicals and drugs interact with genes involved in malignant transfromation |
| (DGIdb 4.0) |
| Entrez ID | Symbol | Category | Interaction Types | Drug Claim Name | Drug Name | PMIDs |
| Page: 1 |

Copyright 2023-Present -The University of Texas Health Science Center at Houston |