
|
|||||
|
 | |
| |
| |
| |
| |
| |
|
Gene: LYRM4 |
Gene summary for LYRM4 |
| Gene information | Species | Human | Gene symbol | LYRM4 | Gene ID | 57128 |
| Gene name | LYR motif containing 4 | |
| Gene Alias | C6orf149 | |
| Cytomap | 6p25.1 | |
| Gene Type | protein-coding | GO ID | GO:0006790 | UniProtAcc | F5H189 |
Top |
Malignant transformation analysis |
| Identification of the aberrant gene expression in precancerous and cancerous lesions by comparing the gene expression of stem-like cells in diseased tissues with normal stem cells |
| Entrez ID | Symbol | Replicates | Species | Organ | Tissue | Adj P-value | Log2FC | Malignancy |
| 57128 | LYRM4 | P130T-E | Human | Esophagus | ESCC | 1.83e-98 | 2.01e+00 | 0.1676 |
| 57128 | LYRM4 | HCC1_Meng | Human | Liver | HCC | 5.96e-74 | 2.14e-01 | 0.0246 |
| 57128 | LYRM4 | HCC2_Meng | Human | Liver | HCC | 9.41e-05 | -1.35e-01 | 0.0107 |
| 57128 | LYRM4 | cirrhotic1 | Human | Liver | Cirrhotic | 4.15e-03 | 8.67e-02 | 0.0202 |
| 57128 | LYRM4 | cirrhotic2 | Human | Liver | Cirrhotic | 2.59e-06 | 1.87e-01 | 0.0201 |
| 57128 | LYRM4 | cirrhotic3 | Human | Liver | Cirrhotic | 4.69e-05 | 1.01e-01 | 0.0215 |
| 57128 | LYRM4 | HCC1 | Human | Liver | HCC | 6.80e-10 | 4.14e+00 | 0.5336 |
| 57128 | LYRM4 | HCC2 | Human | Liver | HCC | 9.65e-03 | 3.00e+00 | 0.5341 |
| 57128 | LYRM4 | Pt13.a | Human | Liver | HCC | 2.87e-10 | 4.26e-01 | 0.021 |
| 57128 | LYRM4 | Pt13.b | Human | Liver | HCC | 3.91e-35 | 5.20e-01 | 0.0251 |
| 57128 | LYRM4 | Pt14.a | Human | Liver | HCC | 9.19e-03 | 2.20e-01 | 0.0169 |
| 57128 | LYRM4 | S014 | Human | Liver | HCC | 4.39e-23 | 1.06e+00 | 0.2254 |
| 57128 | LYRM4 | S015 | Human | Liver | HCC | 3.96e-20 | 1.19e+00 | 0.2375 |
| 57128 | LYRM4 | S016 | Human | Liver | HCC | 1.20e-27 | 1.07e+00 | 0.2243 |
| 57128 | LYRM4 | S028 | Human | Liver | HCC | 2.13e-06 | 4.90e-01 | 0.2503 |
| 57128 | LYRM4 | S029 | Human | Liver | HCC | 2.47e-09 | 6.03e-01 | 0.2581 |
| 57128 | LYRM4 | C04 | Human | Oral cavity | OSCC | 6.43e-42 | 1.91e+00 | 0.2633 |
| 57128 | LYRM4 | C21 | Human | Oral cavity | OSCC | 8.39e-42 | 1.48e+00 | 0.2678 |
| 57128 | LYRM4 | C30 | Human | Oral cavity | OSCC | 3.35e-46 | 2.25e+00 | 0.3055 |
| 57128 | LYRM4 | C38 | Human | Oral cavity | OSCC | 3.97e-04 | 7.03e-01 | 0.172 |
| Page: 1 2 3 4 5 6 |
| Tissue | Expression Dynamics | Abbreviation |
| Esophagus | 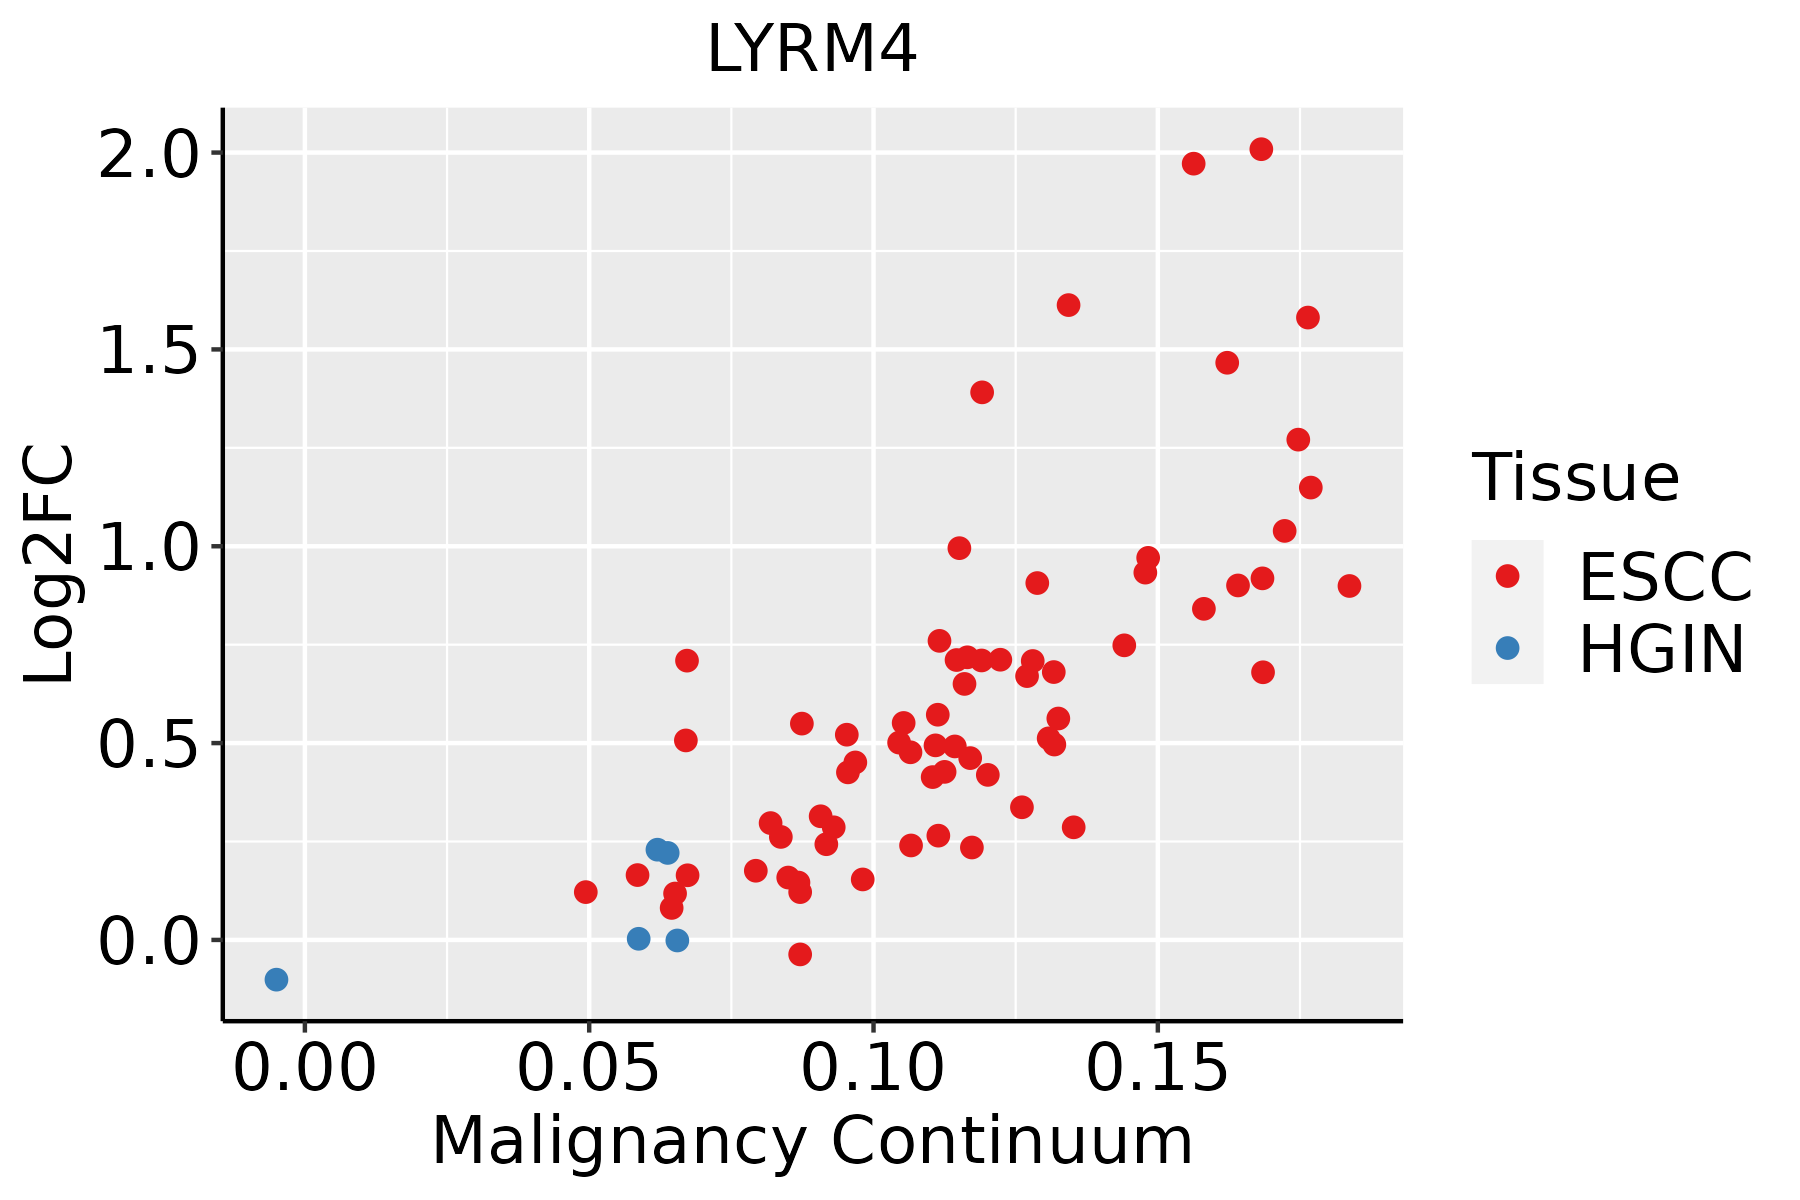 | ESCC: Esophageal squamous cell carcinoma |
| HGIN: High-grade intraepithelial neoplasias | ||
| LGIN: Low-grade intraepithelial neoplasias | ||
| Liver | 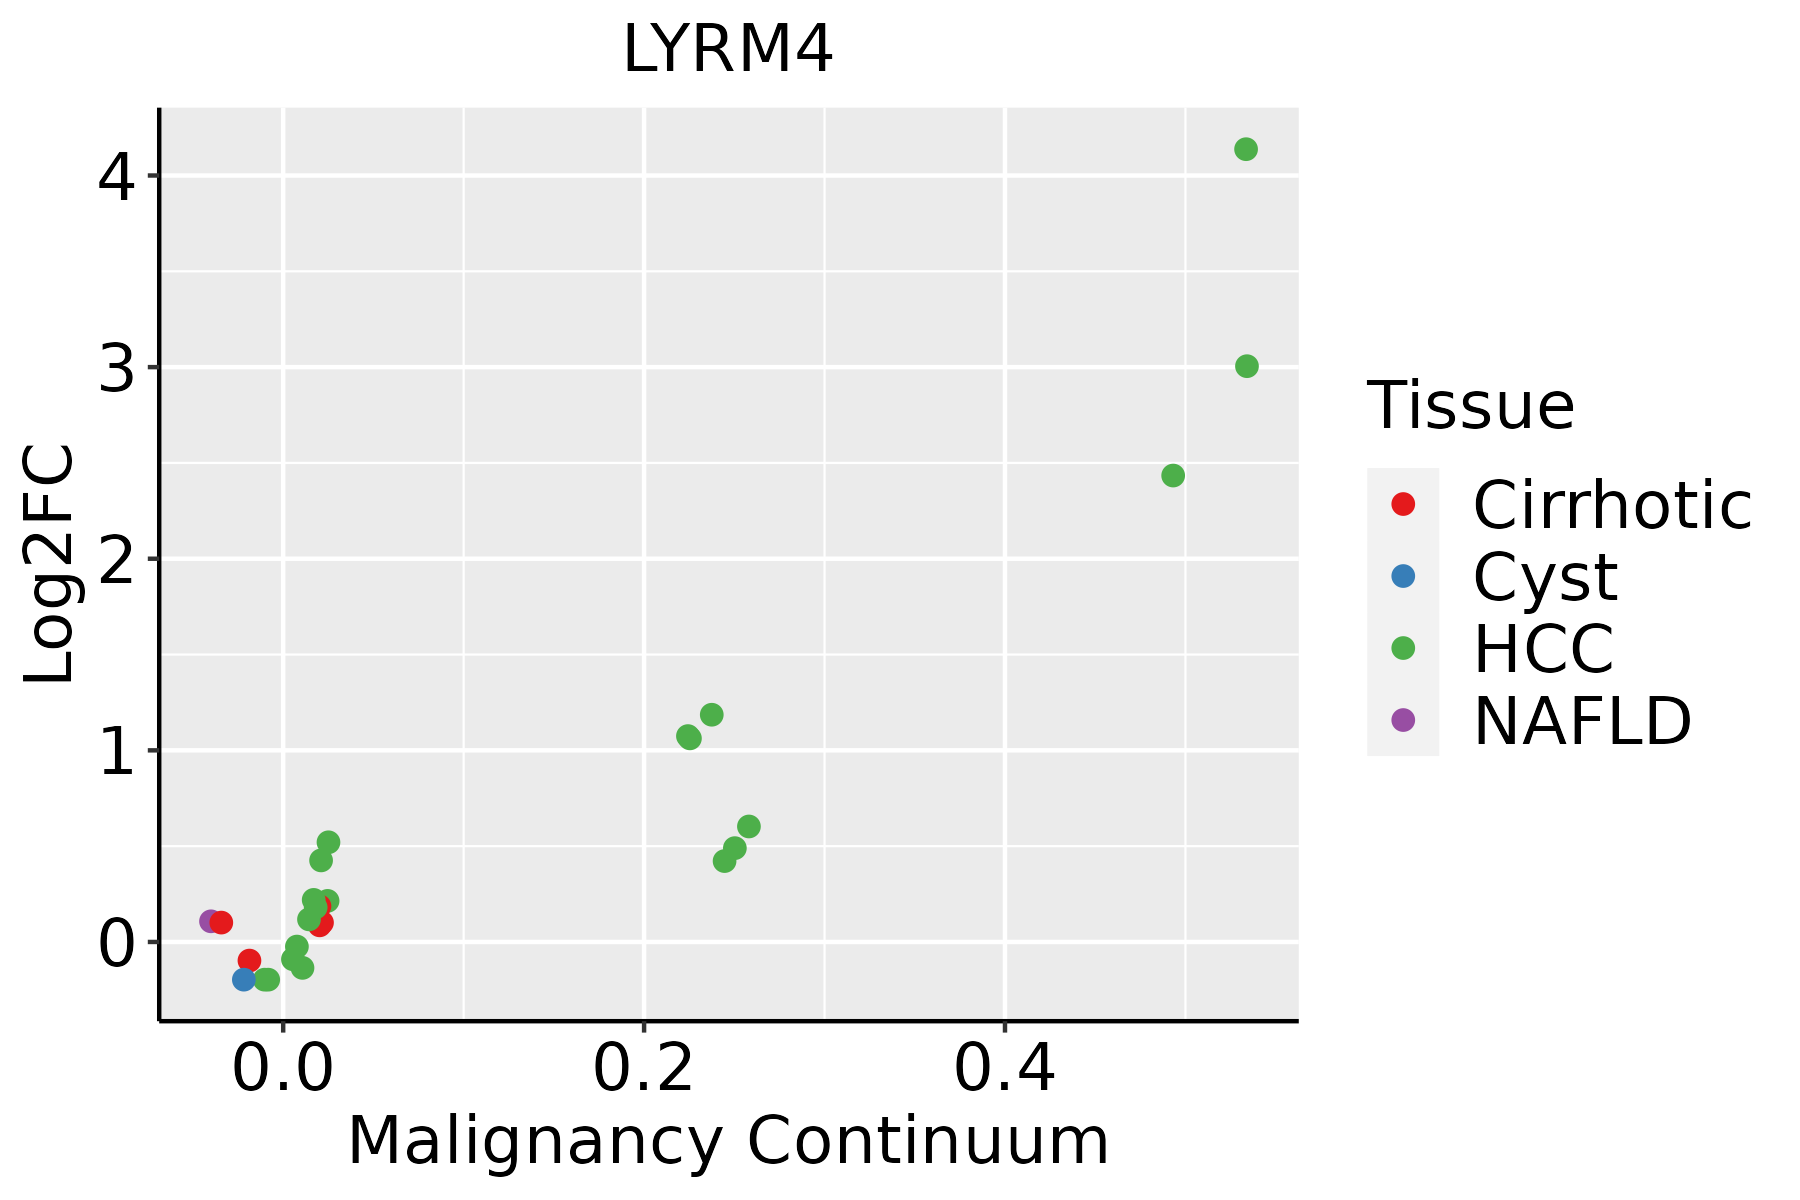 | HCC: Hepatocellular carcinoma |
| NAFLD: Non-alcoholic fatty liver disease | ||
| Oral Cavity | 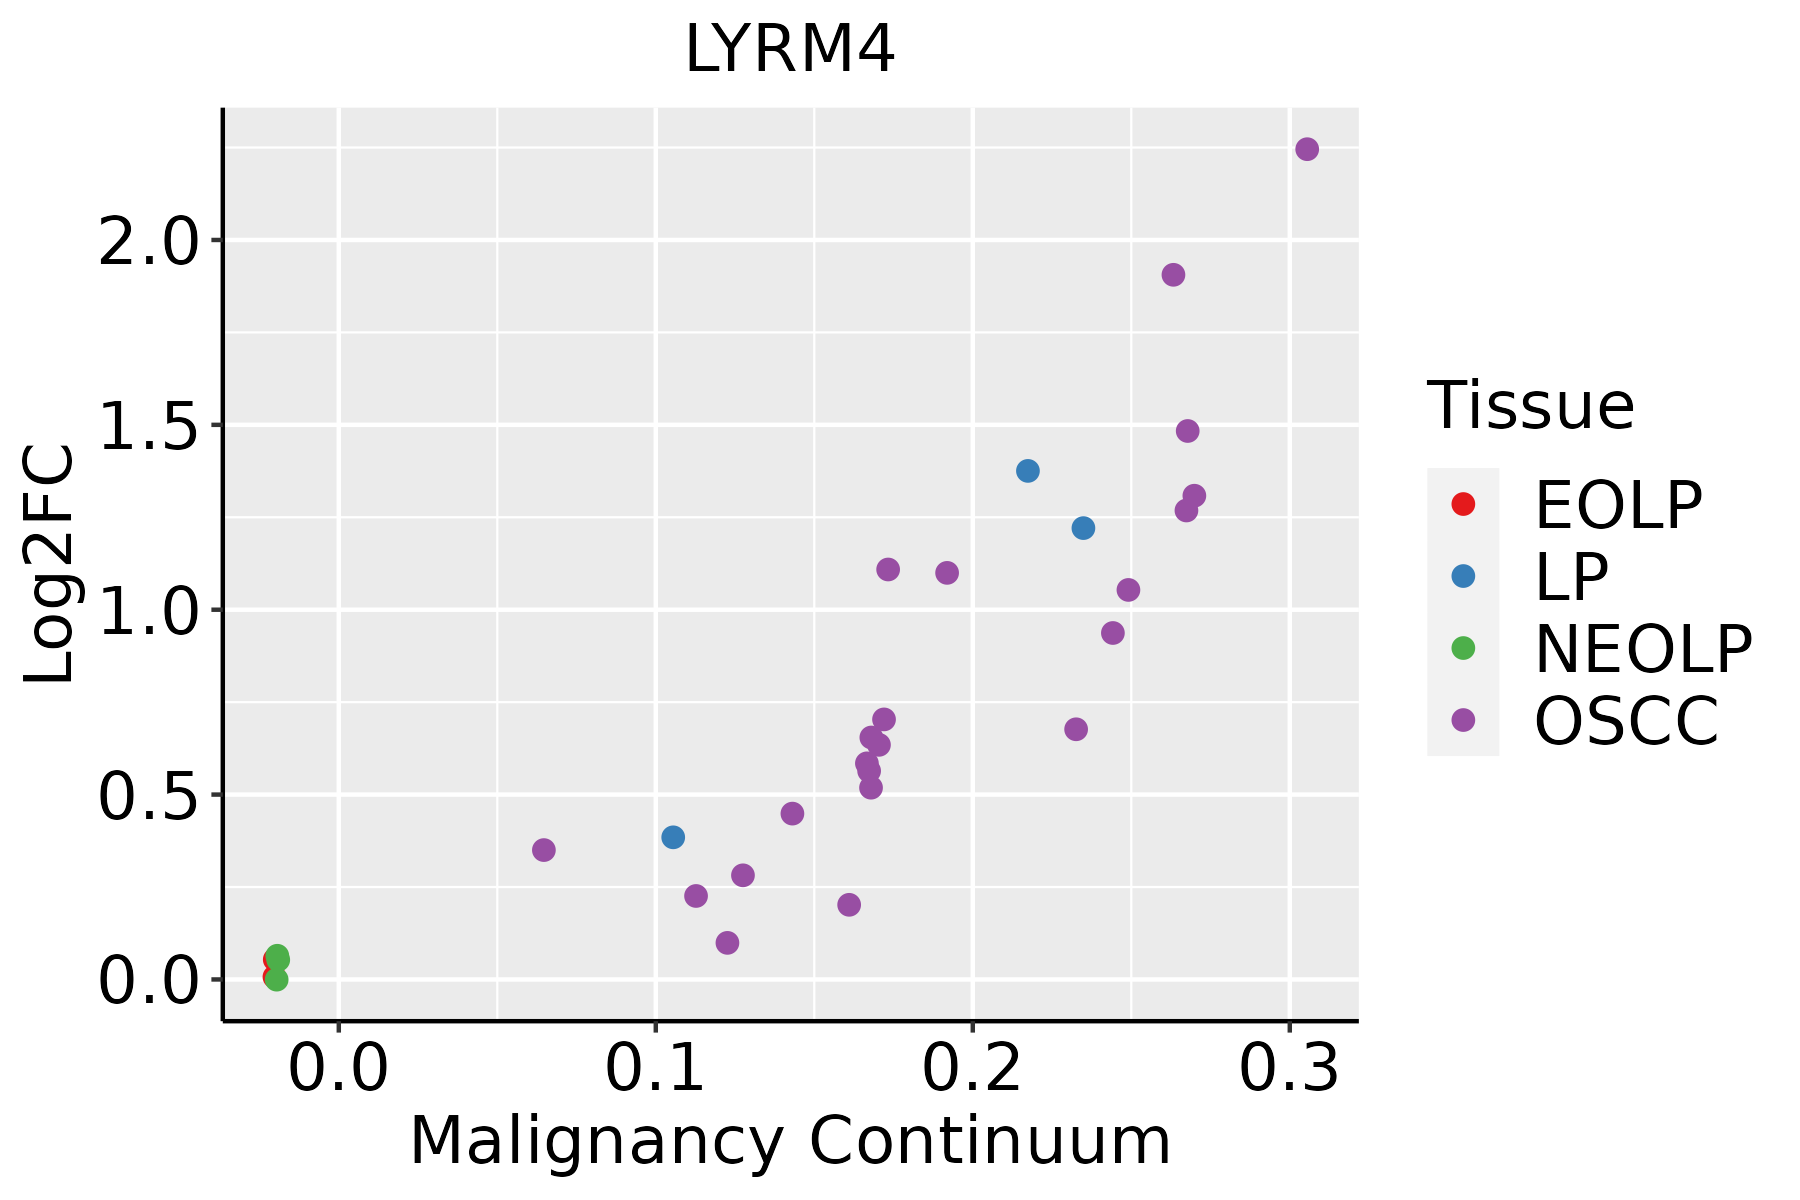 | EOLP: Erosive Oral lichen planus |
| LP: leukoplakia | ||
| NEOLP: Non-erosive oral lichen planus | ||
| OSCC: Oral squamous cell carcinoma | ||
| Skin | 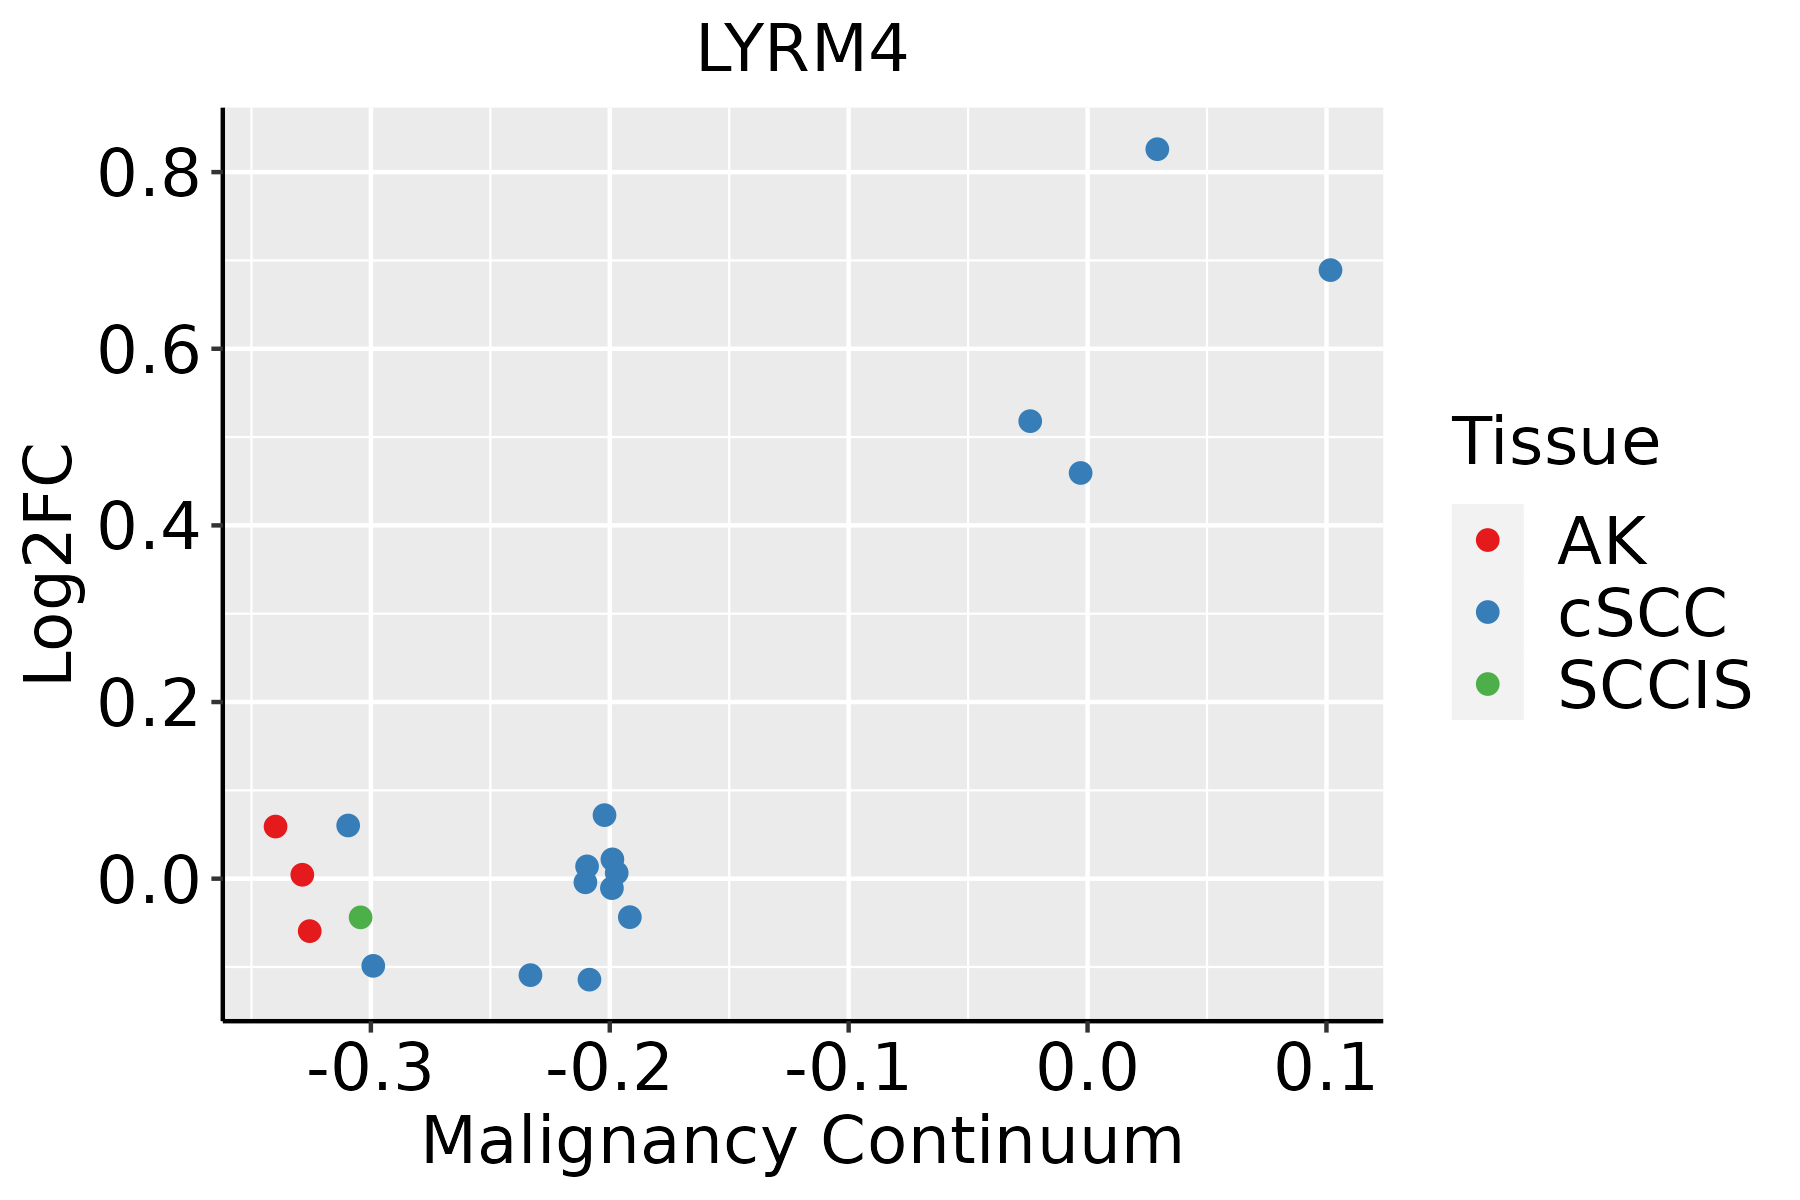 | AK: Actinic keratosis |
| cSCC: Cutaneous squamous cell carcinoma | ||
| SCCIS:squamous cell carcinoma in situ | ||
| Thyroid | 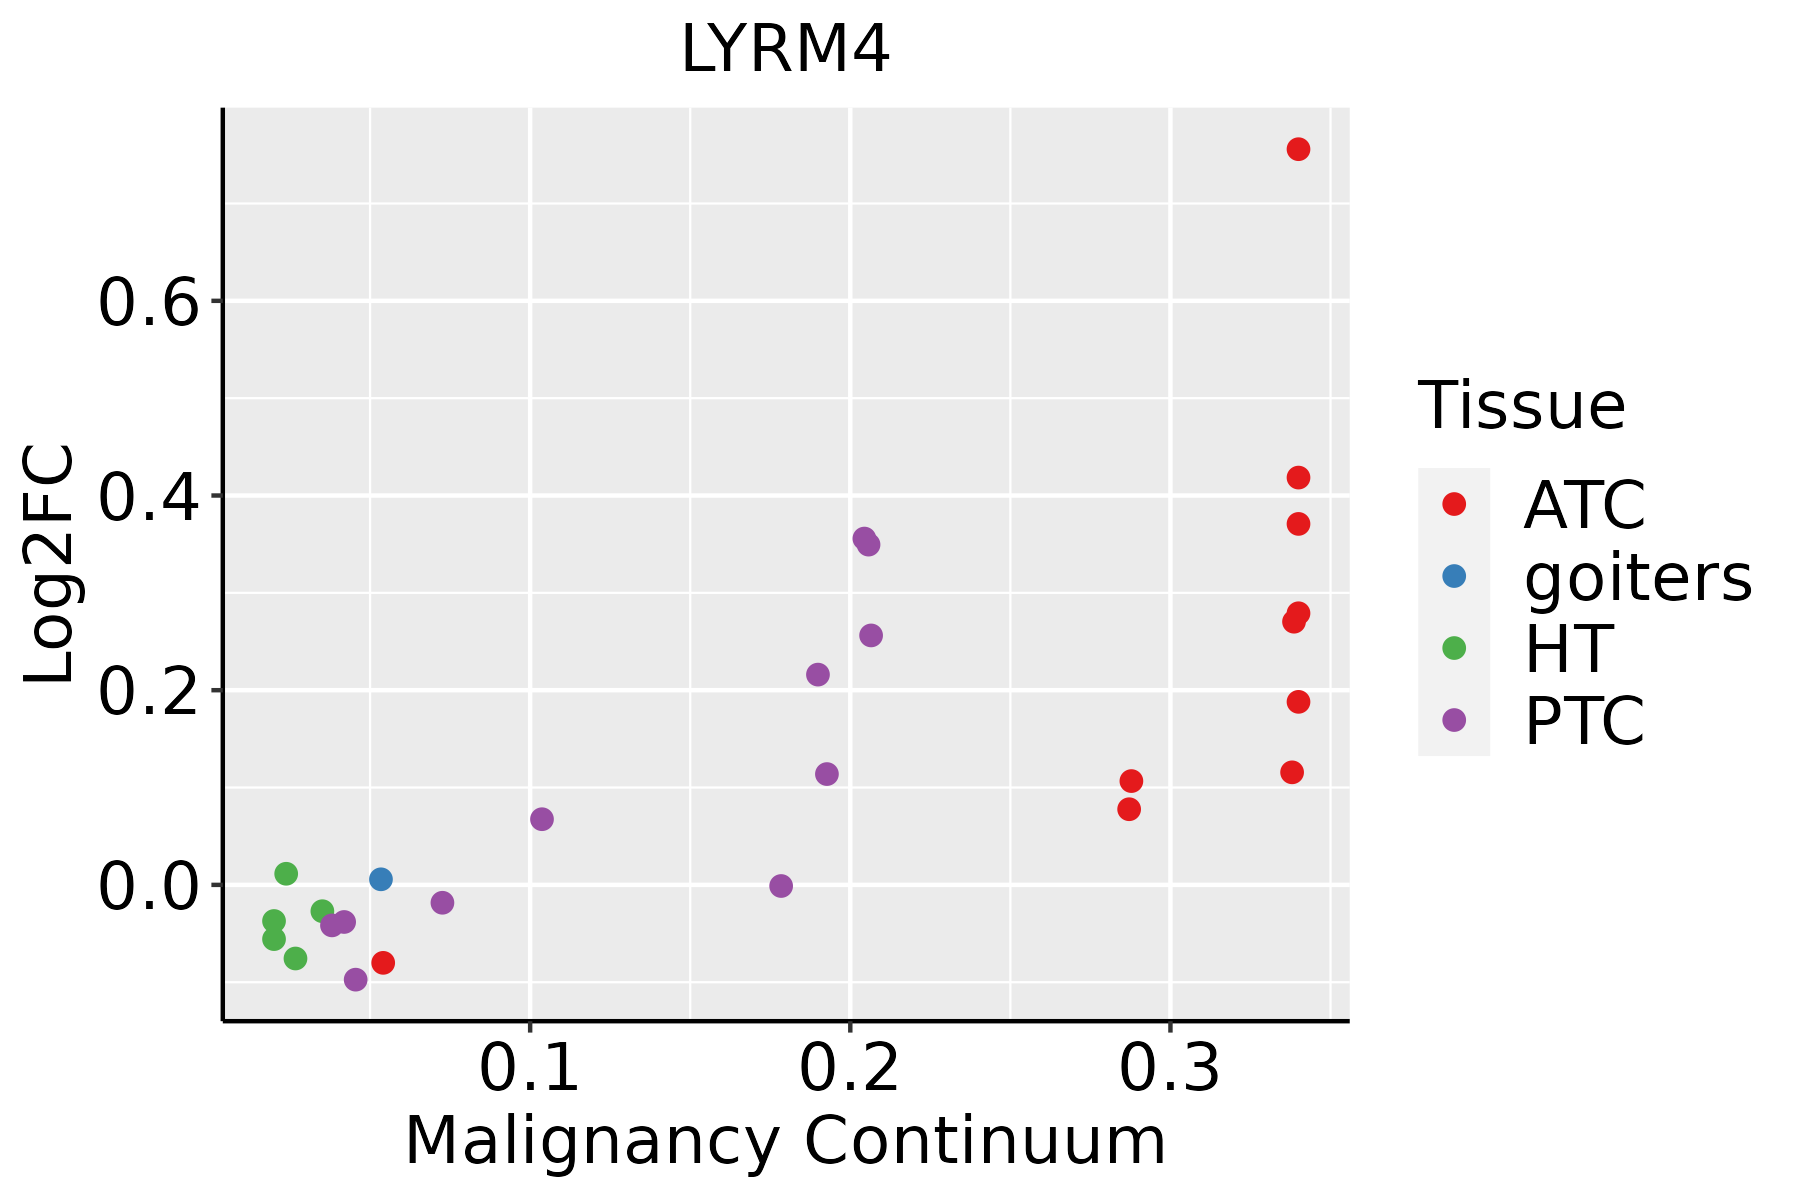 | ATC: Anaplastic thyroid cancer |
| HT: Hashimoto's thyroiditis | ||
| PTC: Papillary thyroid cancer |
| ∗log2FC in expression of this searched gene in stem-like cells from each diseased tissue sample relative to stem-like cells in normal samples in each tissue plotted against the malignancy continuum. Samples are colored based on if they are from different disease stage. |
Top |
Malignant transformation related pathway analysis |
| Find out the enriched GO biological processes and KEGG pathways involved in transition from healthy to precancer to cancer |
| Tissue | Disease Stage | Enriched GO biological Processes |
| Colorectum | AD |  |
| Colorectum | SER |  |
| Colorectum | MSS |  |
| Colorectum | MSI-H |  |
| Colorectum | FAP |  |
| ∗Top 15 enriched GO BP terms are showed in the bar plot of each disease state in each tissue. Each row represents a significant GO biological process which is colored according to the -log10(p.adjust). |
| Page: 1 2 3 4 5 6 7 8 9 |
| GO ID | Tissue | Disease Stage | Description | Gene Ratio | Bg Ratio | pvalue | p.adjust | Count |
| GO:00067906 | Esophagus | ESCC | sulfur compound metabolic process | 201/8552 | 339/18723 | 2.64e-07 | 3.94e-06 | 201 |
| GO:001622611 | Esophagus | ESCC | iron-sulfur cluster assembly | 21/8552 | 26/18723 | 2.69e-04 | 1.63e-03 | 21 |
| GO:003116311 | Esophagus | ESCC | metallo-sulfur cluster assembly | 21/8552 | 26/18723 | 2.69e-04 | 1.63e-03 | 21 |
| GO:000679011 | Liver | Cirrhotic | sulfur compound metabolic process | 129/4634 | 339/18723 | 3.06e-08 | 1.04e-06 | 129 |
| GO:000679021 | Liver | HCC | sulfur compound metabolic process | 212/7958 | 339/18723 | 5.60e-14 | 3.39e-12 | 212 |
| GO:0016226 | Liver | HCC | iron-sulfur cluster assembly | 18/7958 | 26/18723 | 5.37e-03 | 2.24e-02 | 18 |
| GO:0031163 | Liver | HCC | metallo-sulfur cluster assembly | 18/7958 | 26/18723 | 5.37e-03 | 2.24e-02 | 18 |
| GO:00067905 | Oral cavity | OSCC | sulfur compound metabolic process | 168/7305 | 339/18723 | 4.50e-05 | 3.84e-04 | 168 |
| GO:00162262 | Oral cavity | OSCC | iron-sulfur cluster assembly | 19/7305 | 26/18723 | 4.46e-04 | 2.70e-03 | 19 |
| GO:00311632 | Oral cavity | OSCC | metallo-sulfur cluster assembly | 19/7305 | 26/18723 | 4.46e-04 | 2.70e-03 | 19 |
| GO:00162261 | Oral cavity | LP | iron-sulfur cluster assembly | 15/4623 | 26/18723 | 3.34e-04 | 3.34e-03 | 15 |
| GO:00311631 | Oral cavity | LP | metallo-sulfur cluster assembly | 15/4623 | 26/18723 | 3.34e-04 | 3.34e-03 | 15 |
| GO:000679012 | Oral cavity | LP | sulfur compound metabolic process | 106/4623 | 339/18723 | 3.36e-03 | 2.25e-02 | 106 |
| GO:00162264 | Skin | cSCC | iron-sulfur cluster assembly | 14/4864 | 26/18723 | 2.26e-03 | 1.32e-02 | 14 |
| GO:00311634 | Skin | cSCC | metallo-sulfur cluster assembly | 14/4864 | 26/18723 | 2.26e-03 | 1.32e-02 | 14 |
| Page: 1 |
| Pathway ID | Tissue | Disease Stage | Description | Gene Ratio | Bg Ratio | pvalue | p.adjust | qvalue | Count |
| Page: 1 |
Top |
Cell-cell communication analysis |
| Identification of potential cell-cell interactions between two cell types and their ligand-receptor pairs for different disease states |
| Ligand | Receptor | LRpair | Pathway | Tissue | Disease Stage |
| Page: 1 |
Top |
Single-cell gene regulatory network inference analysis |
| Find out the significant the regulons (TFs) and the target genes of each regulon across cell types for different disease states |
| TF | Cell Type | Tissue | Disease Stage | Target Gene | RSS | Regulon Activity |
| ∗The dot plots of a searched regulon are shown for all cell subpopulations in each disease state of each tissue based on the regulon specific score inferred using pySCENIC and by calculating the average expression. |
| Page: 1 |
Top |
Somatic mutation of malignant transformation related genes |
| Annotation of somatic variants for genes involved in malignant transformation |
| Hugo Symbol | Variant Class | Variant Classification | dbSNP RS | HGVSc | HGVSp | HGVSp Short | SWISSPROT | BIOTYPE | SIFT | PolyPhen | Tumor Sample Barcode | Tissue | Histology | Sex | Age | Stage | Therapy Types | Drugs | Outcome |
| LYRM4 | SNV | Missense_Mutation | c.239N>G | p.Lys80Arg | p.K80R | Q9HD34 | protein_coding | tolerated(0.22) | benign(0.141) | TCGA-E9-A1RH-01 | Breast | breast invasive carcinoma | Female | <65 | I/II | Chemotherapy | 5-fluorouracil | SD | |
| LYRM4 | deletion | Frame_Shift_Del | novel | c.134delN | p.Asn45MetfsTer2 | p.N45Mfs*2 | protein_coding | TCGA-D8-A27V-01 | Breast | breast invasive carcinoma | Female | <65 | I/II | Hormone Therapy | tamoxiphen | SD | |||
| LYRM4 | SNV | Missense_Mutation | c.199N>T | p.Arg67Cys | p.R67C | protein_coding | deleterious(0.04) | probably_damaging(0.976) | TCGA-AP-A056-01 | Endometrium | uterine corpus endometrioid carcinoma | Female | <65 | I/II | Unknown | Unknown | SD | ||
| LYRM4 | SNV | Missense_Mutation | c.95C>A | p.Ala32Asp | p.A32D | protein_coding | deleterious(0) | probably_damaging(0.995) | TCGA-B5-A11E-01 | Endometrium | uterine corpus endometrioid carcinoma | Female | <65 | I/II | Unknown | Unknown | SD | ||
| LYRM4 | SNV | Missense_Mutation | novel | c.141G>T | p.Lys47Asn | p.K47N | protein_coding | tolerated(0.18) | benign(0.331) | TCGA-B5-A1MX-01 | Endometrium | uterine corpus endometrioid carcinoma | Female | <65 | I/II | Hormone Therapy | megace | SD | |
| LYRM4 | SNV | Missense_Mutation | c.151N>C | p.Glu51Gln | p.E51Q | protein_coding | tolerated(0.26) | benign(0.145) | TCGA-BK-A0C9-01 | Endometrium | uterine corpus endometrioid carcinoma | Female | <65 | I/II | Unknown | Unknown | SD | ||
| LYRM4 | SNV | Missense_Mutation | novel | c.48N>A | p.Met16Ile | p.M16I | protein_coding | deleterious_low_confidence(0.04) | benign(0.384) | TCGA-EY-A215-01 | Endometrium | uterine corpus endometrioid carcinoma | Female | <65 | I/II | Unknown | Unknown | SD | |
| LYRM4 | SNV | Missense_Mutation | novel | c.232N>G | p.Thr78Ala | p.T78A | Q9HD34 | protein_coding | tolerated(0.56) | benign(0.007) | TCGA-DD-AAW2-01 | Liver | liver hepatocellular carcinoma | Male | >=65 | I/II | Unknown | Unknown | PD |
| LYRM4 | SNV | Missense_Mutation | c.236N>T | p.Asp79Val | p.D79V | Q9HD34 | protein_coding | tolerated(0.06) | benign(0.198) | TCGA-73-4668-01 | Lung | lung adenocarcinoma | Female | >=65 | I/II | Chemotherapy | pemetrexed | PD | |
| LYRM4 | SNV | Missense_Mutation | c.87N>T | p.Arg29Ser | p.R29S | protein_coding | deleterious(0) | probably_damaging(0.999) | TCGA-86-8358-01 | Lung | lung adenocarcinoma | Male | <65 | I/II | Unknown | Unknown | SD |
| Page: 1 2 |
Top |
Related drugs of malignant transformation related genes |
| Identification of chemicals and drugs interact with genes involved in malignant transfromation |
| (DGIdb 4.0) |
| Entrez ID | Symbol | Category | Interaction Types | Drug Claim Name | Drug Name | PMIDs |
| Page: 1 |

Copyright 2023-Present -The University of Texas Health Science Center at Houston |