
|
|||||
|
 | |
| |
| |
| |
| |
| |
|
Gene: LTBR |
Gene summary for LTBR |
| Gene information | Species | Human | Gene symbol | LTBR | Gene ID | 4055 |
| Gene name | lymphotoxin beta receptor | |
| Gene Alias | D12S370 | |
| Cytomap | 12p13.31 | |
| Gene Type | protein-coding | GO ID | GO:0000165 | UniProtAcc | P36941 |
Top |
Malignant transformation analysis |
| Identification of the aberrant gene expression in precancerous and cancerous lesions by comparing the gene expression of stem-like cells in diseased tissues with normal stem cells |
| Entrez ID | Symbol | Replicates | Species | Organ | Tissue | Adj P-value | Log2FC | Malignancy |
| 4055 | LTBR | P47T-E | Human | Esophagus | ESCC | 2.46e-64 | 1.30e+00 | 0.1067 |
| 4055 | LTBR | P48T-E | Human | Esophagus | ESCC | 1.36e-48 | 1.00e+00 | 0.0959 |
| 4055 | LTBR | P49T-E | Human | Esophagus | ESCC | 3.32e-24 | 2.31e+00 | 0.1768 |
| 4055 | LTBR | P52T-E | Human | Esophagus | ESCC | 2.38e-96 | 2.16e+00 | 0.1555 |
| 4055 | LTBR | P54T-E | Human | Esophagus | ESCC | 1.54e-76 | 2.02e+00 | 0.0975 |
| 4055 | LTBR | P56T-E | Human | Esophagus | ESCC | 1.30e-09 | 1.70e+00 | 0.1613 |
| 4055 | LTBR | P57T-E | Human | Esophagus | ESCC | 7.36e-53 | 1.15e+00 | 0.0926 |
| 4055 | LTBR | P61T-E | Human | Esophagus | ESCC | 1.49e-51 | 1.37e+00 | 0.099 |
| 4055 | LTBR | P62T-E | Human | Esophagus | ESCC | 2.98e-108 | 2.07e+00 | 0.1302 |
| 4055 | LTBR | P65T-E | Human | Esophagus | ESCC | 2.51e-43 | 9.73e-01 | 0.0978 |
| 4055 | LTBR | P74T-E | Human | Esophagus | ESCC | 6.50e-61 | 1.96e+00 | 0.1479 |
| 4055 | LTBR | P75T-E | Human | Esophagus | ESCC | 5.19e-58 | 1.33e+00 | 0.1125 |
| 4055 | LTBR | P76T-E | Human | Esophagus | ESCC | 3.47e-75 | 1.76e+00 | 0.1207 |
| 4055 | LTBR | P79T-E | Human | Esophagus | ESCC | 1.12e-63 | 1.32e+00 | 0.1154 |
| 4055 | LTBR | P80T-E | Human | Esophagus | ESCC | 2.04e-67 | 2.57e+00 | 0.155 |
| 4055 | LTBR | P82T-E | Human | Esophagus | ESCC | 1.43e-39 | 2.20e+00 | 0.1072 |
| 4055 | LTBR | P83T-E | Human | Esophagus | ESCC | 5.70e-82 | 3.20e+00 | 0.1738 |
| 4055 | LTBR | P84T-E | Human | Esophagus | ESCC | 1.24e-28 | 2.14e+00 | 0.0933 |
| 4055 | LTBR | P89T-E | Human | Esophagus | ESCC | 3.89e-30 | 2.48e+00 | 0.1752 |
| 4055 | LTBR | P91T-E | Human | Esophagus | ESCC | 1.06e-17 | 2.37e+00 | 0.1828 |
| Page: 1 2 3 4 5 6 7 8 |
| Tissue | Expression Dynamics | Abbreviation |
| Colorectum (GSE201348) | 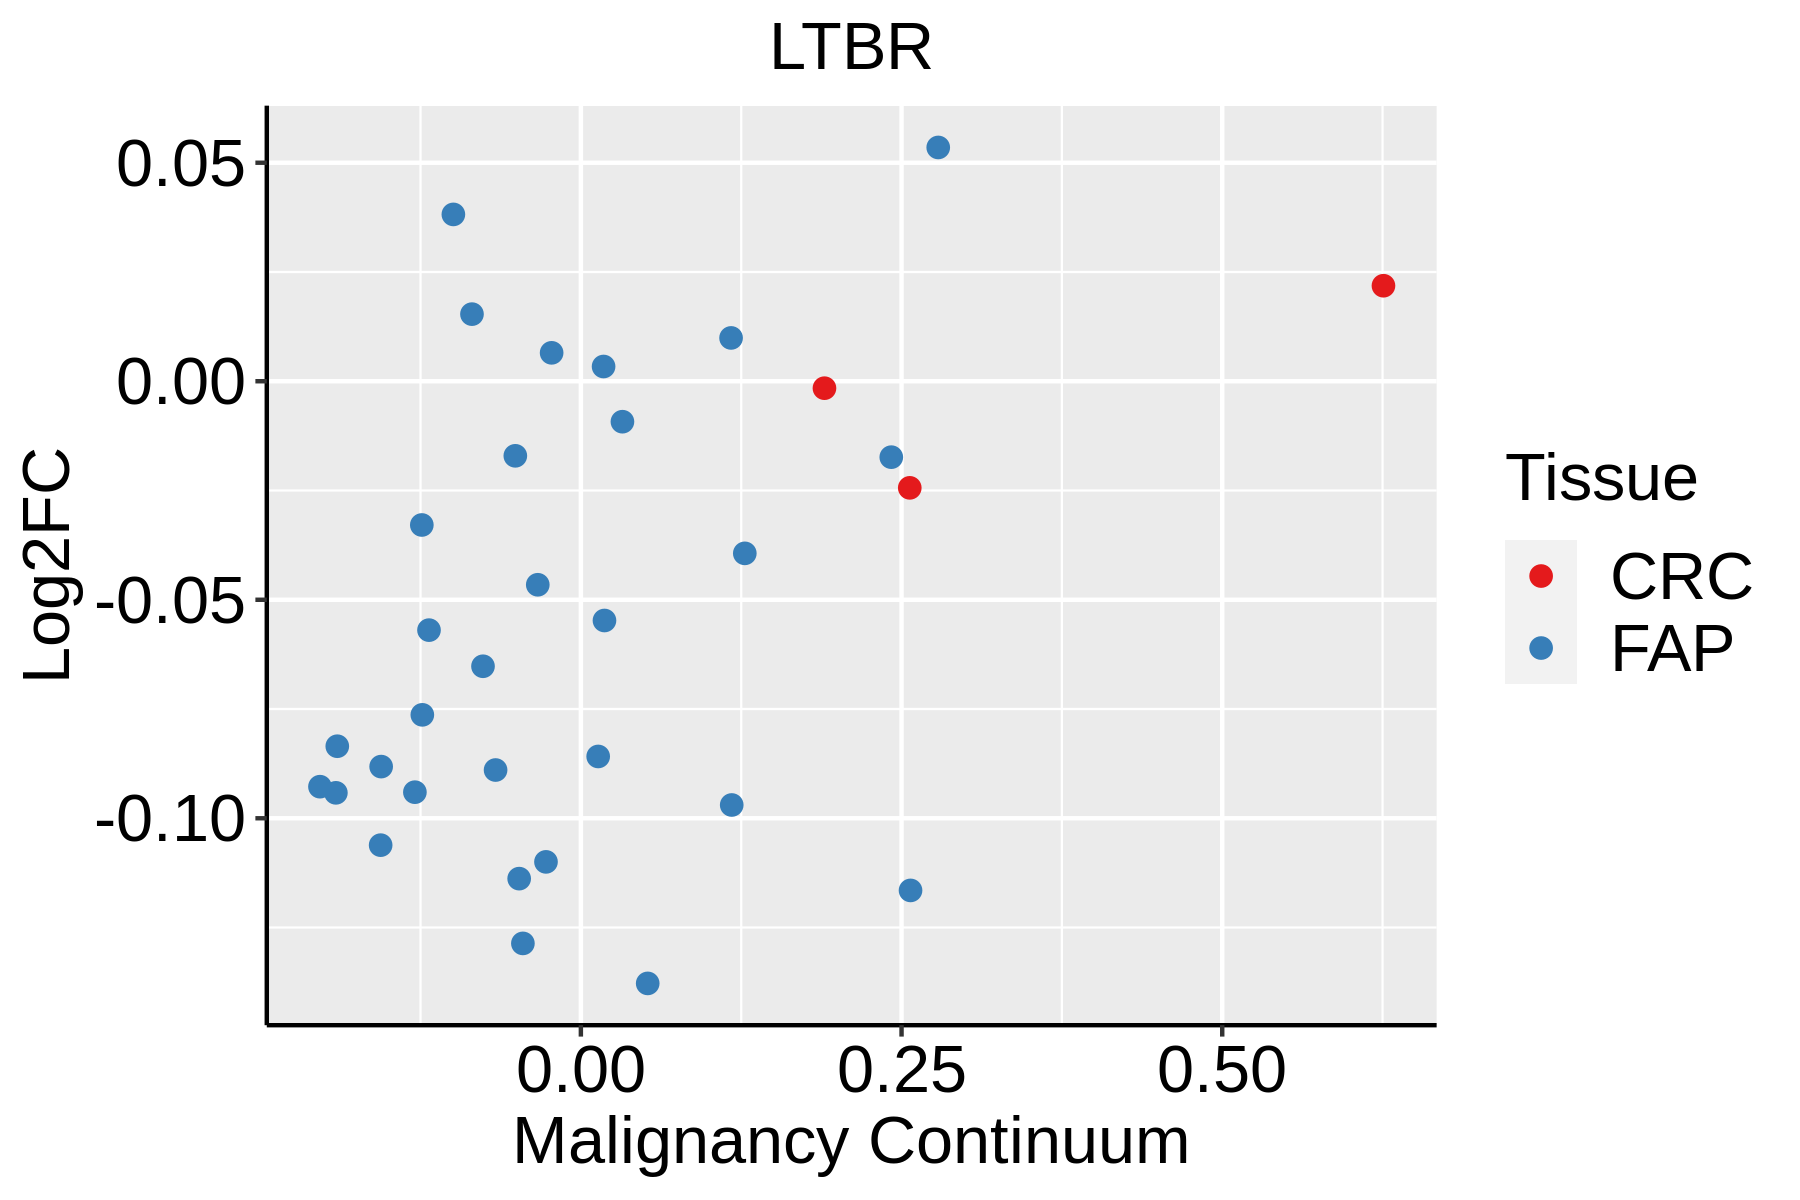 | FAP: Familial adenomatous polyposis |
| CRC: Colorectal cancer | ||
| Colorectum (HTA11) |  | AD: Adenomas |
| SER: Sessile serrated lesions | ||
| MSI-H: Microsatellite-high colorectal cancer | ||
| MSS: Microsatellite stable colorectal cancer | ||
| Esophagus | 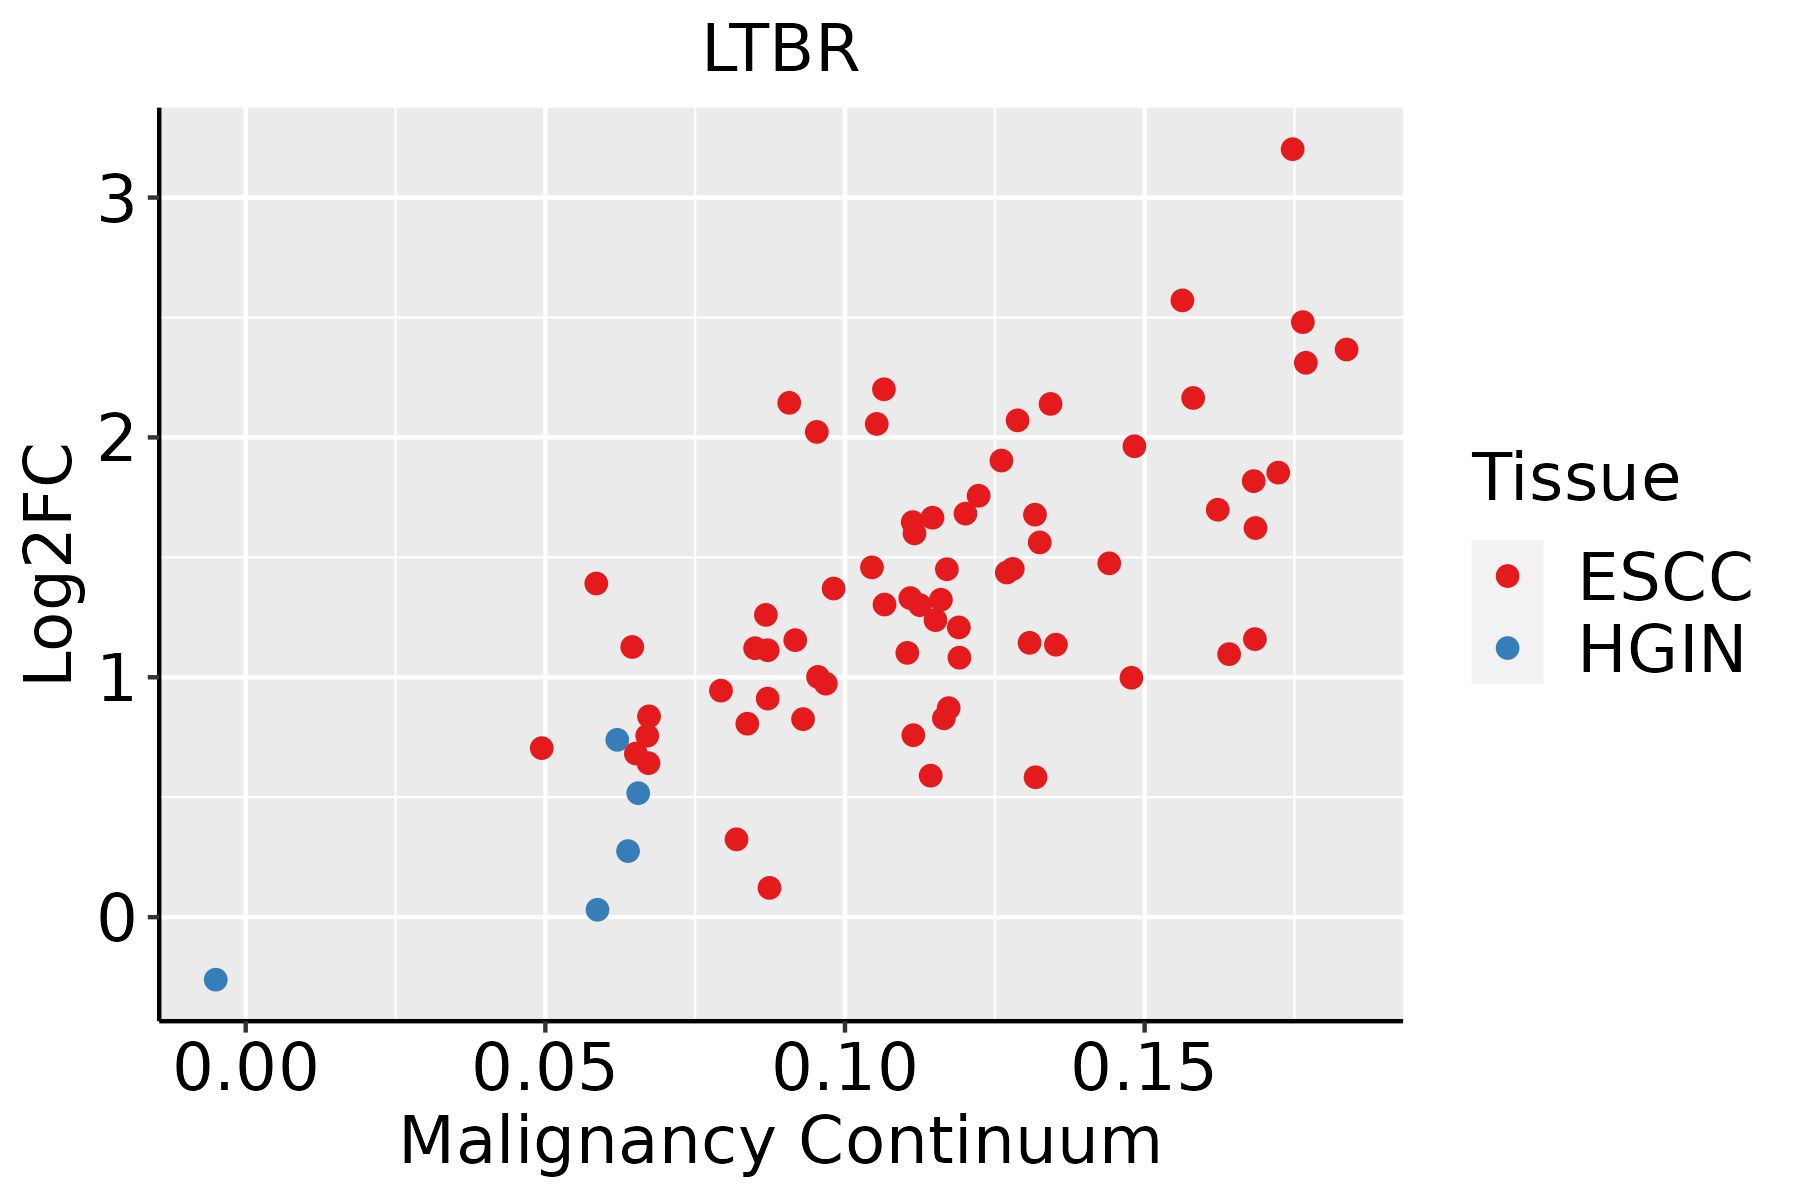 | ESCC: Esophageal squamous cell carcinoma |
| HGIN: High-grade intraepithelial neoplasias | ||
| LGIN: Low-grade intraepithelial neoplasias | ||
| Liver |  | HCC: Hepatocellular carcinoma |
| NAFLD: Non-alcoholic fatty liver disease | ||
| Oral Cavity | 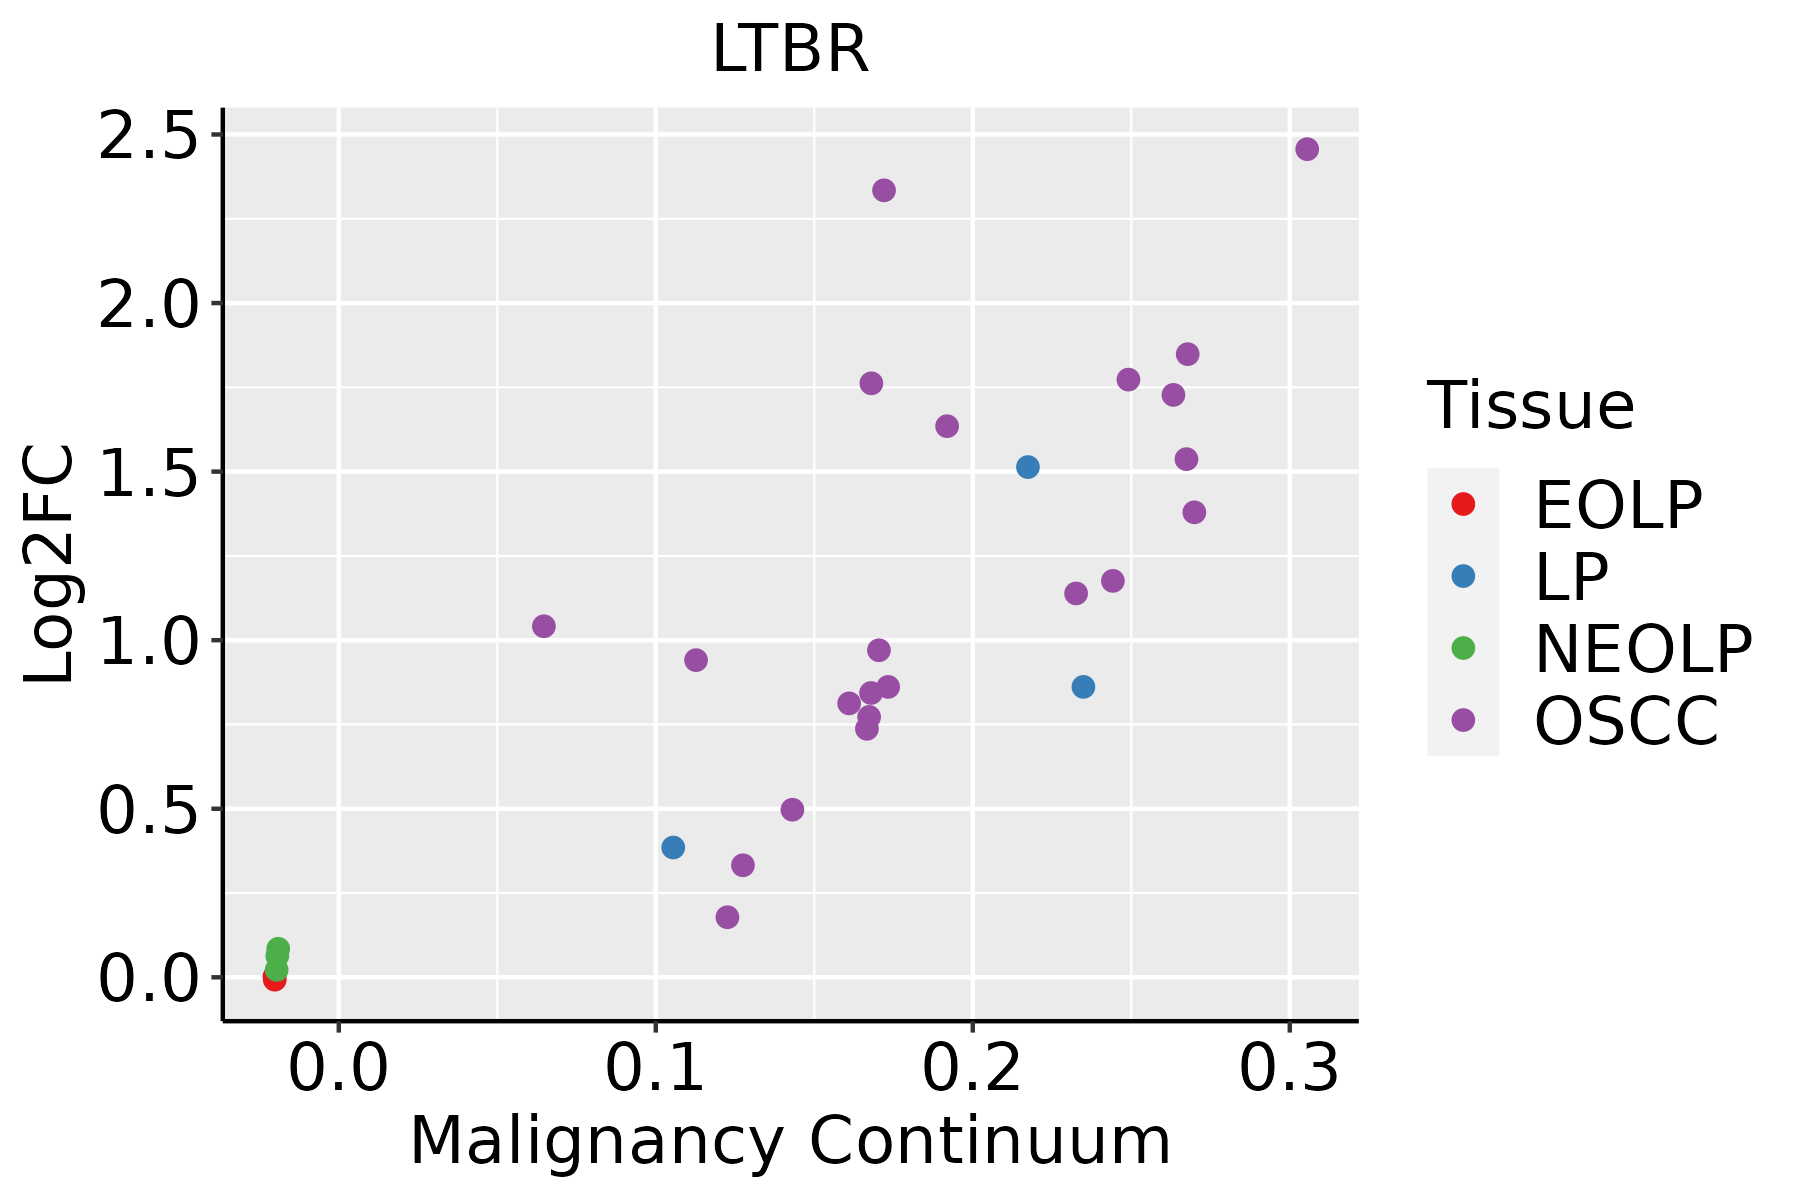 | EOLP: Erosive Oral lichen planus |
| LP: leukoplakia | ||
| NEOLP: Non-erosive oral lichen planus | ||
| OSCC: Oral squamous cell carcinoma | ||
| Skin |  | AK: Actinic keratosis |
| cSCC: Cutaneous squamous cell carcinoma | ||
| SCCIS:squamous cell carcinoma in situ | ||
| Thyroid | 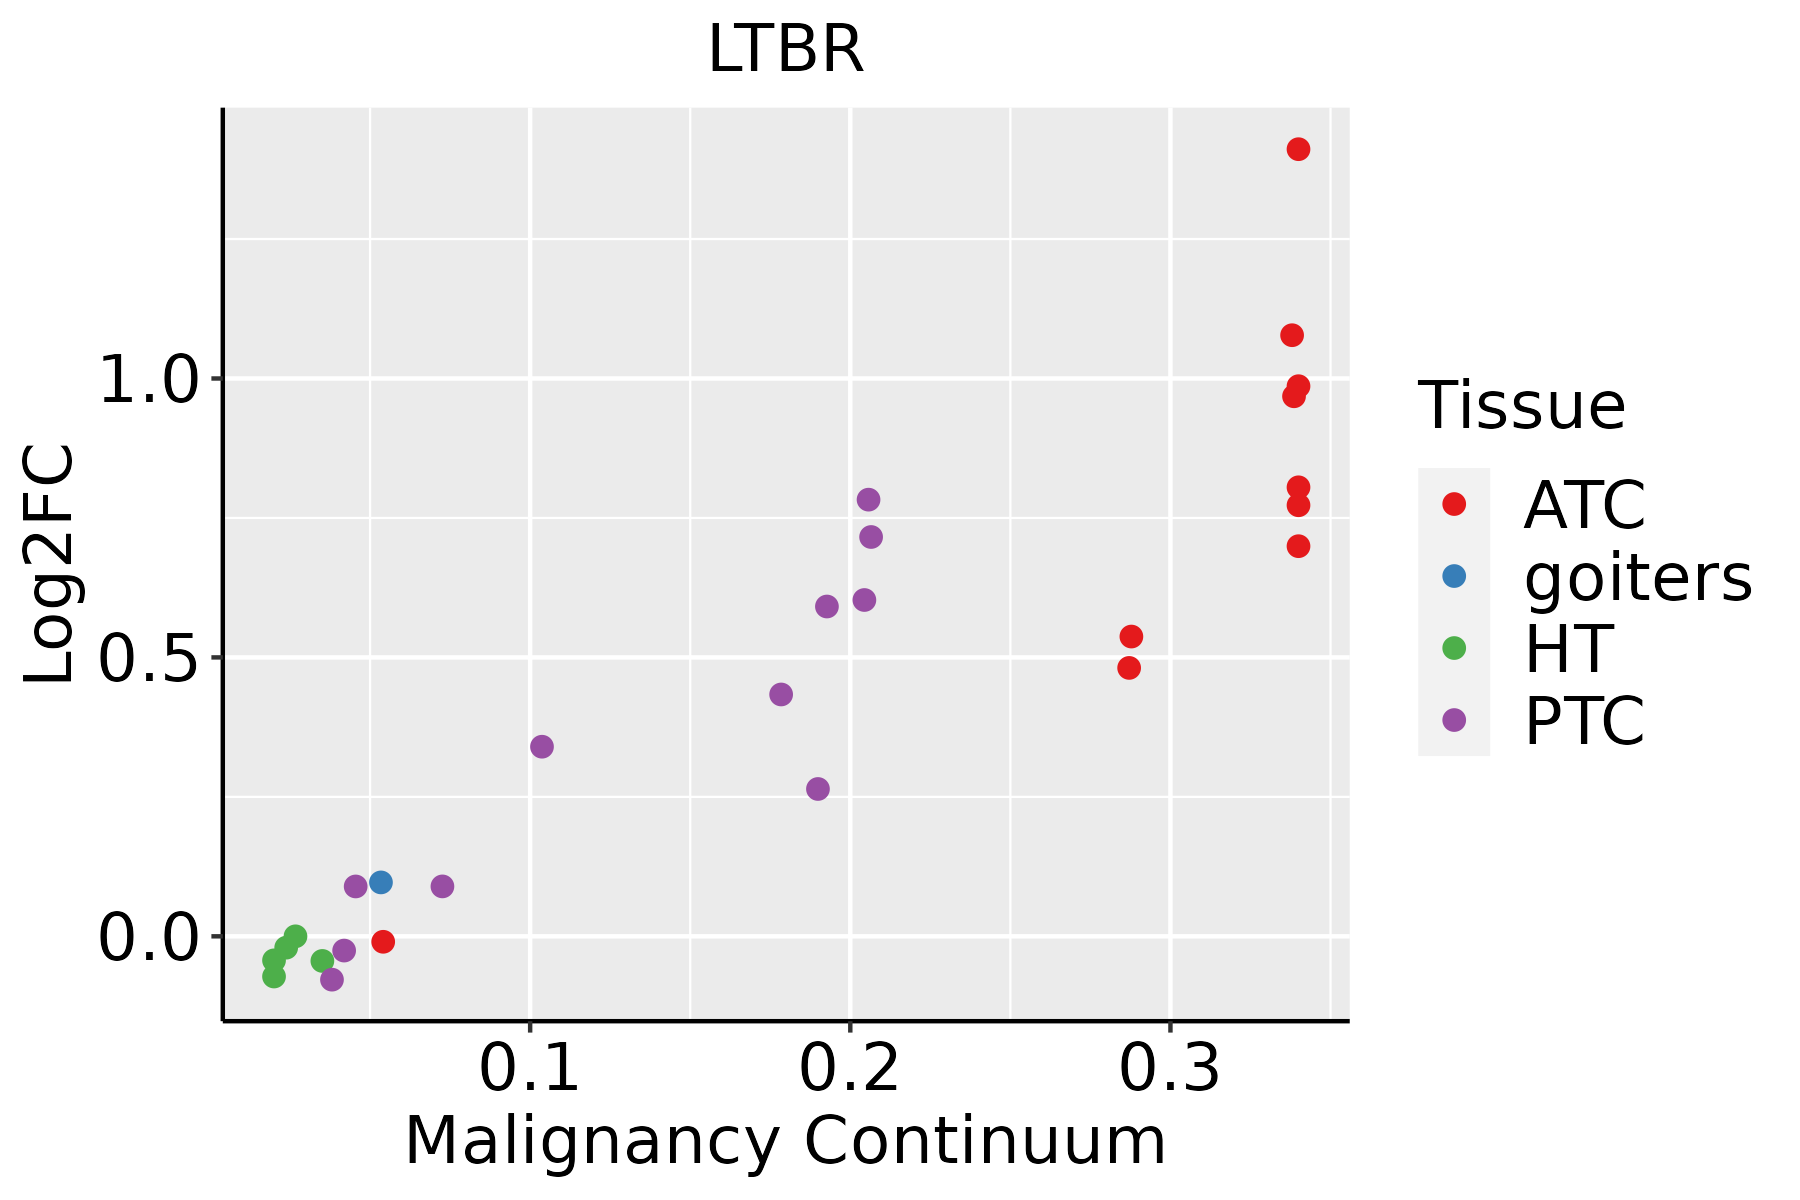 | ATC: Anaplastic thyroid cancer |
| HT: Hashimoto's thyroiditis | ||
| PTC: Papillary thyroid cancer |
| ∗log2FC in expression of this searched gene in stem-like cells from each diseased tissue sample relative to stem-like cells in normal samples in each tissue plotted against the malignancy continuum. Samples are colored based on if they are from different disease stage. |
Top |
Malignant transformation related pathway analysis |
| Find out the enriched GO biological processes and KEGG pathways involved in transition from healthy to precancer to cancer |
| Tissue | Disease Stage | Enriched GO biological Processes |
| Colorectum | AD |  |
| Colorectum | SER |  |
| Colorectum | MSS |  |
| Colorectum | MSI-H |  |
| Colorectum | FAP |  |
| ∗Top 15 enriched GO BP terms are showed in the bar plot of each disease state in each tissue. Each row represents a significant GO biological process which is colored according to the -log10(p.adjust). |
| Page: 1 2 3 4 5 6 7 8 9 |
| GO ID | Tissue | Disease Stage | Description | Gene Ratio | Bg Ratio | pvalue | p.adjust | Count |
| GO:2001233 | Colorectum | AD | regulation of apoptotic signaling pathway | 119/3918 | 356/18723 | 2.14e-08 | 1.21e-06 | 119 |
| GO:0030099 | Colorectum | AD | myeloid cell differentiation | 119/3918 | 381/18723 | 1.24e-06 | 4.01e-05 | 119 |
| GO:0043123 | Colorectum | AD | positive regulation of I-kappaB kinase/NF-kappaB signaling | 60/3918 | 186/18723 | 1.91e-04 | 2.56e-03 | 60 |
| GO:0071496 | Colorectum | AD | cellular response to external stimulus | 94/3918 | 320/18723 | 1.98e-04 | 2.64e-03 | 94 |
| GO:0043122 | Colorectum | AD | regulation of I-kappaB kinase/NF-kappaB signaling | 76/3918 | 249/18723 | 2.17e-04 | 2.85e-03 | 76 |
| GO:0097191 | Colorectum | AD | extrinsic apoptotic signaling pathway | 68/3918 | 219/18723 | 2.64e-04 | 3.27e-03 | 68 |
| GO:0051403 | Colorectum | AD | stress-activated MAPK cascade | 72/3918 | 239/18723 | 4.77e-04 | 5.25e-03 | 72 |
| GO:0031098 | Colorectum | AD | stress-activated protein kinase signaling cascade | 74/3918 | 247/18723 | 4.80e-04 | 5.27e-03 | 74 |
| GO:0007249 | Colorectum | AD | I-kappaB kinase/NF-kappaB signaling | 82/3918 | 281/18723 | 6.09e-04 | 6.40e-03 | 82 |
| GO:2001235 | Colorectum | AD | positive regulation of apoptotic signaling pathway | 42/3918 | 126/18723 | 7.85e-04 | 7.84e-03 | 42 |
| GO:0070302 | Colorectum | AD | regulation of stress-activated protein kinase signaling cascade | 58/3918 | 195/18723 | 2.21e-03 | 1.74e-02 | 58 |
| GO:0032872 | Colorectum | AD | regulation of stress-activated MAPK cascade | 57/3918 | 192/18723 | 2.51e-03 | 1.92e-02 | 57 |
| GO:0002573 | Colorectum | AD | myeloid leukocyte differentiation | 60/3918 | 208/18723 | 4.03e-03 | 2.81e-02 | 60 |
| GO:20012331 | Colorectum | SER | regulation of apoptotic signaling pathway | 101/2897 | 356/18723 | 3.05e-10 | 4.07e-08 | 101 |
| GO:00971911 | Colorectum | SER | extrinsic apoptotic signaling pathway | 58/2897 | 219/18723 | 1.76e-05 | 5.22e-04 | 58 |
| GO:20012351 | Colorectum | SER | positive regulation of apoptotic signaling pathway | 36/2897 | 126/18723 | 1.29e-04 | 2.63e-03 | 36 |
| GO:2001236 | Colorectum | SER | regulation of extrinsic apoptotic signaling pathway | 39/2897 | 151/18723 | 6.67e-04 | 8.94e-03 | 39 |
| GO:00714961 | Colorectum | SER | cellular response to external stimulus | 70/2897 | 320/18723 | 1.40e-03 | 1.53e-02 | 70 |
| GO:00300991 | Colorectum | SER | myeloid cell differentiation | 80/2897 | 381/18723 | 2.28e-03 | 2.18e-02 | 80 |
| GO:00310981 | Colorectum | SER | stress-activated protein kinase signaling cascade | 54/2897 | 247/18723 | 4.65e-03 | 3.67e-02 | 54 |
| Page: 1 2 3 4 5 6 7 8 9 10 11 |
| Pathway ID | Tissue | Disease Stage | Description | Gene Ratio | Bg Ratio | pvalue | p.adjust | qvalue | Count |
| hsa04066 | Colorectum | AD | HIF-1 signaling pathway | 48/2092 | 109/8465 | 7.25e-06 | 7.84e-05 | 5.00e-05 | 48 |
| hsa05166 | Colorectum | AD | Human T-cell leukemia virus 1 infection | 72/2092 | 222/8465 | 5.24e-03 | 2.44e-02 | 1.55e-02 | 72 |
| hsa040661 | Colorectum | AD | HIF-1 signaling pathway | 48/2092 | 109/8465 | 7.25e-06 | 7.84e-05 | 5.00e-05 | 48 |
| hsa051661 | Colorectum | AD | Human T-cell leukemia virus 1 infection | 72/2092 | 222/8465 | 5.24e-03 | 2.44e-02 | 1.55e-02 | 72 |
| hsa040662 | Colorectum | SER | HIF-1 signaling pathway | 36/1580 | 109/8465 | 2.27e-04 | 2.15e-03 | 1.56e-03 | 36 |
| hsa040663 | Colorectum | SER | HIF-1 signaling pathway | 36/1580 | 109/8465 | 2.27e-04 | 2.15e-03 | 1.56e-03 | 36 |
| hsa040664 | Colorectum | MSS | HIF-1 signaling pathway | 39/1875 | 109/8465 | 7.61e-04 | 5.00e-03 | 3.06e-03 | 39 |
| hsa051662 | Colorectum | MSS | Human T-cell leukemia virus 1 infection | 68/1875 | 222/8465 | 1.84e-03 | 9.61e-03 | 5.89e-03 | 68 |
| hsa040665 | Colorectum | MSS | HIF-1 signaling pathway | 39/1875 | 109/8465 | 7.61e-04 | 5.00e-03 | 3.06e-03 | 39 |
| hsa051663 | Colorectum | MSS | Human T-cell leukemia virus 1 infection | 68/1875 | 222/8465 | 1.84e-03 | 9.61e-03 | 5.89e-03 | 68 |
| hsa040666 | Colorectum | FAP | HIF-1 signaling pathway | 38/1404 | 109/8465 | 2.43e-06 | 4.28e-05 | 2.60e-05 | 38 |
| hsa040667 | Colorectum | FAP | HIF-1 signaling pathway | 38/1404 | 109/8465 | 2.43e-06 | 4.28e-05 | 2.60e-05 | 38 |
| hsa05166211 | Esophagus | ESCC | Human T-cell leukemia virus 1 infection | 164/4205 | 222/8465 | 8.13e-14 | 2.09e-12 | 1.07e-12 | 164 |
| hsa0520325 | Esophagus | ESCC | Viral carcinogenesis | 137/4205 | 204/8465 | 2.47e-07 | 1.88e-06 | 9.62e-07 | 137 |
| hsa0406629 | Esophagus | ESCC | HIF-1 signaling pathway | 75/4205 | 109/8465 | 3.66e-05 | 1.68e-04 | 8.60e-05 | 75 |
| hsa040645 | Esophagus | ESCC | NF-kappa B signaling pathway | 67/4205 | 104/8465 | 1.62e-03 | 4.89e-03 | 2.50e-03 | 67 |
| hsa05166310 | Esophagus | ESCC | Human T-cell leukemia virus 1 infection | 164/4205 | 222/8465 | 8.13e-14 | 2.09e-12 | 1.07e-12 | 164 |
| hsa0520335 | Esophagus | ESCC | Viral carcinogenesis | 137/4205 | 204/8465 | 2.47e-07 | 1.88e-06 | 9.62e-07 | 137 |
| hsa04066113 | Esophagus | ESCC | HIF-1 signaling pathway | 75/4205 | 109/8465 | 3.66e-05 | 1.68e-04 | 8.60e-05 | 75 |
| hsa0406412 | Esophagus | ESCC | NF-kappa B signaling pathway | 67/4205 | 104/8465 | 1.62e-03 | 4.89e-03 | 2.50e-03 | 67 |
| Page: 1 2 3 |
Top |
Cell-cell communication analysis |
| Identification of potential cell-cell interactions between two cell types and their ligand-receptor pairs for different disease states |
| Ligand | Receptor | LRpair | Pathway | Tissue | Disease Stage |
| TNFSF14 | LTBR | TNFSF14_LTBR | LIGHT | Breast | DCIS |
| LTa1b2 | LTBR | LTA_LTB_LTBR | LT | Cervix | ADJ |
| TNFSF14 | LTBR | TNFSF14_LTBR | LIGHT | Cervix | CC |
| TNFSF14 | LTBR | TNFSF14_LTBR | LIGHT | Cervix | Healthy |
| TNFSF14 | LTBR | TNFSF14_LTBR | LIGHT | Cervix | Precancer |
| TNFSF14 | LTBR | TNFSF14_LTBR | LIGHT | Endometrium | Healthy |
| LTa1b2 | LTBR | LTA_LTB_LTBR | LT | Esophagus | ESCC |
| TNFSF14 | LTBR | TNFSF14_LTBR | LIGHT | Esophagus | ESCC |
| TNFSF14 | LTBR | TNFSF14_LTBR | LIGHT | HNSCC | ADJ |
| TNFSF14 | LTBR | TNFSF14_LTBR | LIGHT | HNSCC | OSCC |
| TNFSF14 | LTBR | TNFSF14_LTBR | LIGHT | Liver | Healthy |
| TNFSF14 | LTBR | TNFSF14_LTBR | LIGHT | Liver | Precancer |
| TNFSF14 | LTBR | TNFSF14_LTBR | LIGHT | Prostate | BPH |
| TNFSF14 | LTBR | TNFSF14_LTBR | LIGHT | Prostate | Tumor |
| TNFSF14 | LTBR | TNFSF14_LTBR | LIGHT | Skin | cSCC |
| Page: 1 |
Top |
Single-cell gene regulatory network inference analysis |
| Find out the significant the regulons (TFs) and the target genes of each regulon across cell types for different disease states |
| TF | Cell Type | Tissue | Disease Stage | Target Gene | RSS | Regulon Activity |
| ∗The dot plots of a searched regulon are shown for all cell subpopulations in each disease state of each tissue based on the regulon specific score inferred using pySCENIC and by calculating the average expression. |
| Page: 1 |
Top |
Somatic mutation of malignant transformation related genes |
| Annotation of somatic variants for genes involved in malignant transformation |
| Hugo Symbol | Variant Class | Variant Classification | dbSNP RS | HGVSc | HGVSp | HGVSp Short | SWISSPROT | BIOTYPE | SIFT | PolyPhen | Tumor Sample Barcode | Tissue | Histology | Sex | Age | Stage | Therapy Types | Drugs | Outcome |
| LTBR | SNV | Missense_Mutation | c.691N>G | p.Leu231Val | p.L231V | P36941 | protein_coding | tolerated(0.08) | possibly_damaging(0.836) | TCGA-AC-A23H-01 | Breast | breast invasive carcinoma | Female | >=65 | I/II | Unknown | Unknown | PD | |
| LTBR | insertion | Frame_Shift_Ins | novel | c.1106_1107insG | p.Pro372ThrfsTer53 | p.P372Tfs*53 | P36941 | protein_coding | TCGA-EA-A410-01 | Cervix | cervical & endocervical cancer | Female | <65 | I/II | Unknown | Unknown | SD | ||
| LTBR | SNV | Missense_Mutation | novel | c.538N>C | p.Ser180Pro | p.S180P | P36941 | protein_coding | deleterious(0) | probably_damaging(0.994) | TCGA-5M-AAT6-01 | Colorectum | colon adenocarcinoma | Female | <65 | III/IV | Unknown | Unknown | PD |
| LTBR | SNV | Missense_Mutation | c.559N>G | p.Pro187Ala | p.P187A | P36941 | protein_coding | tolerated(0.06) | possibly_damaging(0.814) | TCGA-AA-3819-01 | Colorectum | colon adenocarcinoma | Female | <65 | I/II | Unknown | Unknown | SD | |
| LTBR | SNV | Missense_Mutation | rs759292715 | c.928N>A | p.Ala310Thr | p.A310T | P36941 | protein_coding | tolerated(0.71) | benign(0) | TCGA-AZ-6601-01 | Colorectum | colon adenocarcinoma | Male | >=65 | I/II | Unknown | Unknown | PD |
| LTBR | SNV | Missense_Mutation | c.89C>T | p.Pro30Leu | p.P30L | P36941 | protein_coding | tolerated(0.3) | benign(0.006) | TCGA-CK-4951-01 | Colorectum | colon adenocarcinoma | Female | >=65 | I/II | Unknown | Unknown | PD | |
| LTBR | SNV | Missense_Mutation | c.554G>A | p.Cys185Tyr | p.C185Y | P36941 | protein_coding | deleterious(0) | probably_damaging(0.997) | TCGA-D5-6530-01 | Colorectum | colon adenocarcinoma | Male | <65 | I/II | Unknown | Unknown | SD | |
| LTBR | SNV | Missense_Mutation | c.1224G>T | p.Lys408Asn | p.K408N | P36941 | protein_coding | deleterious(0) | probably_damaging(0.996) | TCGA-D5-6530-01 | Colorectum | colon adenocarcinoma | Male | <65 | I/II | Unknown | Unknown | SD | |
| LTBR | SNV | Missense_Mutation | novel | c.619N>A | p.Asp207Asn | p.D207N | P36941 | protein_coding | deleterious(0) | possibly_damaging(0.735) | TCGA-D5-6540-01 | Colorectum | colon adenocarcinoma | Male | >=65 | I/II | Unknown | Unknown | SD |
| LTBR | SNV | Missense_Mutation | c.398N>T | p.Ala133Val | p.A133V | P36941 | protein_coding | tolerated(0.63) | benign(0) | TCGA-AG-A002-01 | Colorectum | rectum adenocarcinoma | Male | <65 | I/II | Unknown | Unknown | SD |
| Page: 1 2 3 4 |
Top |
Related drugs of malignant transformation related genes |
| Identification of chemicals and drugs interact with genes involved in malignant transfromation |
| (DGIdb 4.0) |
| Entrez ID | Symbol | Category | Interaction Types | Drug Claim Name | Drug Name | PMIDs |
| 4055 | LTBR | DRUGGABLE GENOME | 178101763 | |||
| 4055 | LTBR | DRUGGABLE GENOME | Baminercept | BAMINERCEPT | ||
| 4055 | LTBR | DRUGGABLE GENOME | HCBE-11 | HCBE-11 |
| Page: 1 |

Copyright 2023-Present -The University of Texas Health Science Center at Houston |