
|
|||||
|
 | |
| |
| |
| |
| |
| |
|
Gene: LPGAT1 |
Gene summary for LPGAT1 |
| Gene information | Species | Human | Gene symbol | LPGAT1 | Gene ID | 9926 |
| Gene name | lysophosphatidylglycerol acyltransferase 1 | |
| Gene Alias | FAM34A | |
| Cytomap | 1q32.3 | |
| Gene Type | protein-coding | GO ID | GO:0006082 | UniProtAcc | Q92604 |
Top |
Malignant transformation analysis |
| Identification of the aberrant gene expression in precancerous and cancerous lesions by comparing the gene expression of stem-like cells in diseased tissues with normal stem cells |
| Entrez ID | Symbol | Replicates | Species | Organ | Tissue | Adj P-value | Log2FC | Malignancy |
| 9926 | LPGAT1 | P32T-E | Human | Esophagus | ESCC | 5.27e-28 | 3.50e-01 | 0.1666 |
| 9926 | LPGAT1 | P36T-E | Human | Esophagus | ESCC | 1.13e-22 | 6.40e-01 | 0.1187 |
| 9926 | LPGAT1 | P37T-E | Human | Esophagus | ESCC | 1.79e-21 | 4.11e-01 | 0.1371 |
| 9926 | LPGAT1 | P38T-E | Human | Esophagus | ESCC | 4.58e-04 | 9.24e-02 | 0.127 |
| 9926 | LPGAT1 | P39T-E | Human | Esophagus | ESCC | 1.83e-03 | 1.47e-01 | 0.0894 |
| 9926 | LPGAT1 | P40T-E | Human | Esophagus | ESCC | 4.82e-10 | 2.06e-01 | 0.109 |
| 9926 | LPGAT1 | P42T-E | Human | Esophagus | ESCC | 8.41e-14 | 2.81e-01 | 0.1175 |
| 9926 | LPGAT1 | P44T-E | Human | Esophagus | ESCC | 6.61e-14 | 2.83e-01 | 0.1096 |
| 9926 | LPGAT1 | P47T-E | Human | Esophagus | ESCC | 1.42e-23 | 2.48e-01 | 0.1067 |
| 9926 | LPGAT1 | P48T-E | Human | Esophagus | ESCC | 4.24e-14 | 2.42e-01 | 0.0959 |
| 9926 | LPGAT1 | P49T-E | Human | Esophagus | ESCC | 5.15e-05 | 3.22e-01 | 0.1768 |
| 9926 | LPGAT1 | P52T-E | Human | Esophagus | ESCC | 3.76e-19 | 3.44e-01 | 0.1555 |
| 9926 | LPGAT1 | P54T-E | Human | Esophagus | ESCC | 4.01e-16 | 2.94e-01 | 0.0975 |
| 9926 | LPGAT1 | P56T-E | Human | Esophagus | ESCC | 9.19e-11 | 9.17e-01 | 0.1613 |
| 9926 | LPGAT1 | P57T-E | Human | Esophagus | ESCC | 1.70e-25 | 3.06e-01 | 0.0926 |
| 9926 | LPGAT1 | P61T-E | Human | Esophagus | ESCC | 1.48e-27 | 5.72e-01 | 0.099 |
| 9926 | LPGAT1 | P62T-E | Human | Esophagus | ESCC | 2.84e-25 | 3.63e-01 | 0.1302 |
| 9926 | LPGAT1 | P65T-E | Human | Esophagus | ESCC | 1.05e-11 | 2.21e-01 | 0.0978 |
| 9926 | LPGAT1 | P74T-E | Human | Esophagus | ESCC | 6.76e-09 | 1.84e-01 | 0.1479 |
| 9926 | LPGAT1 | P75T-E | Human | Esophagus | ESCC | 4.68e-24 | 1.36e-01 | 0.1125 |
| Page: 1 2 3 4 5 6 7 8 9 |
| Tissue | Expression Dynamics | Abbreviation |
| Colorectum (GSE201348) |  | FAP: Familial adenomatous polyposis |
| CRC: Colorectal cancer | ||
| Colorectum (HTA11) |  | AD: Adenomas |
| SER: Sessile serrated lesions | ||
| MSI-H: Microsatellite-high colorectal cancer | ||
| MSS: Microsatellite stable colorectal cancer | ||
| Esophagus | 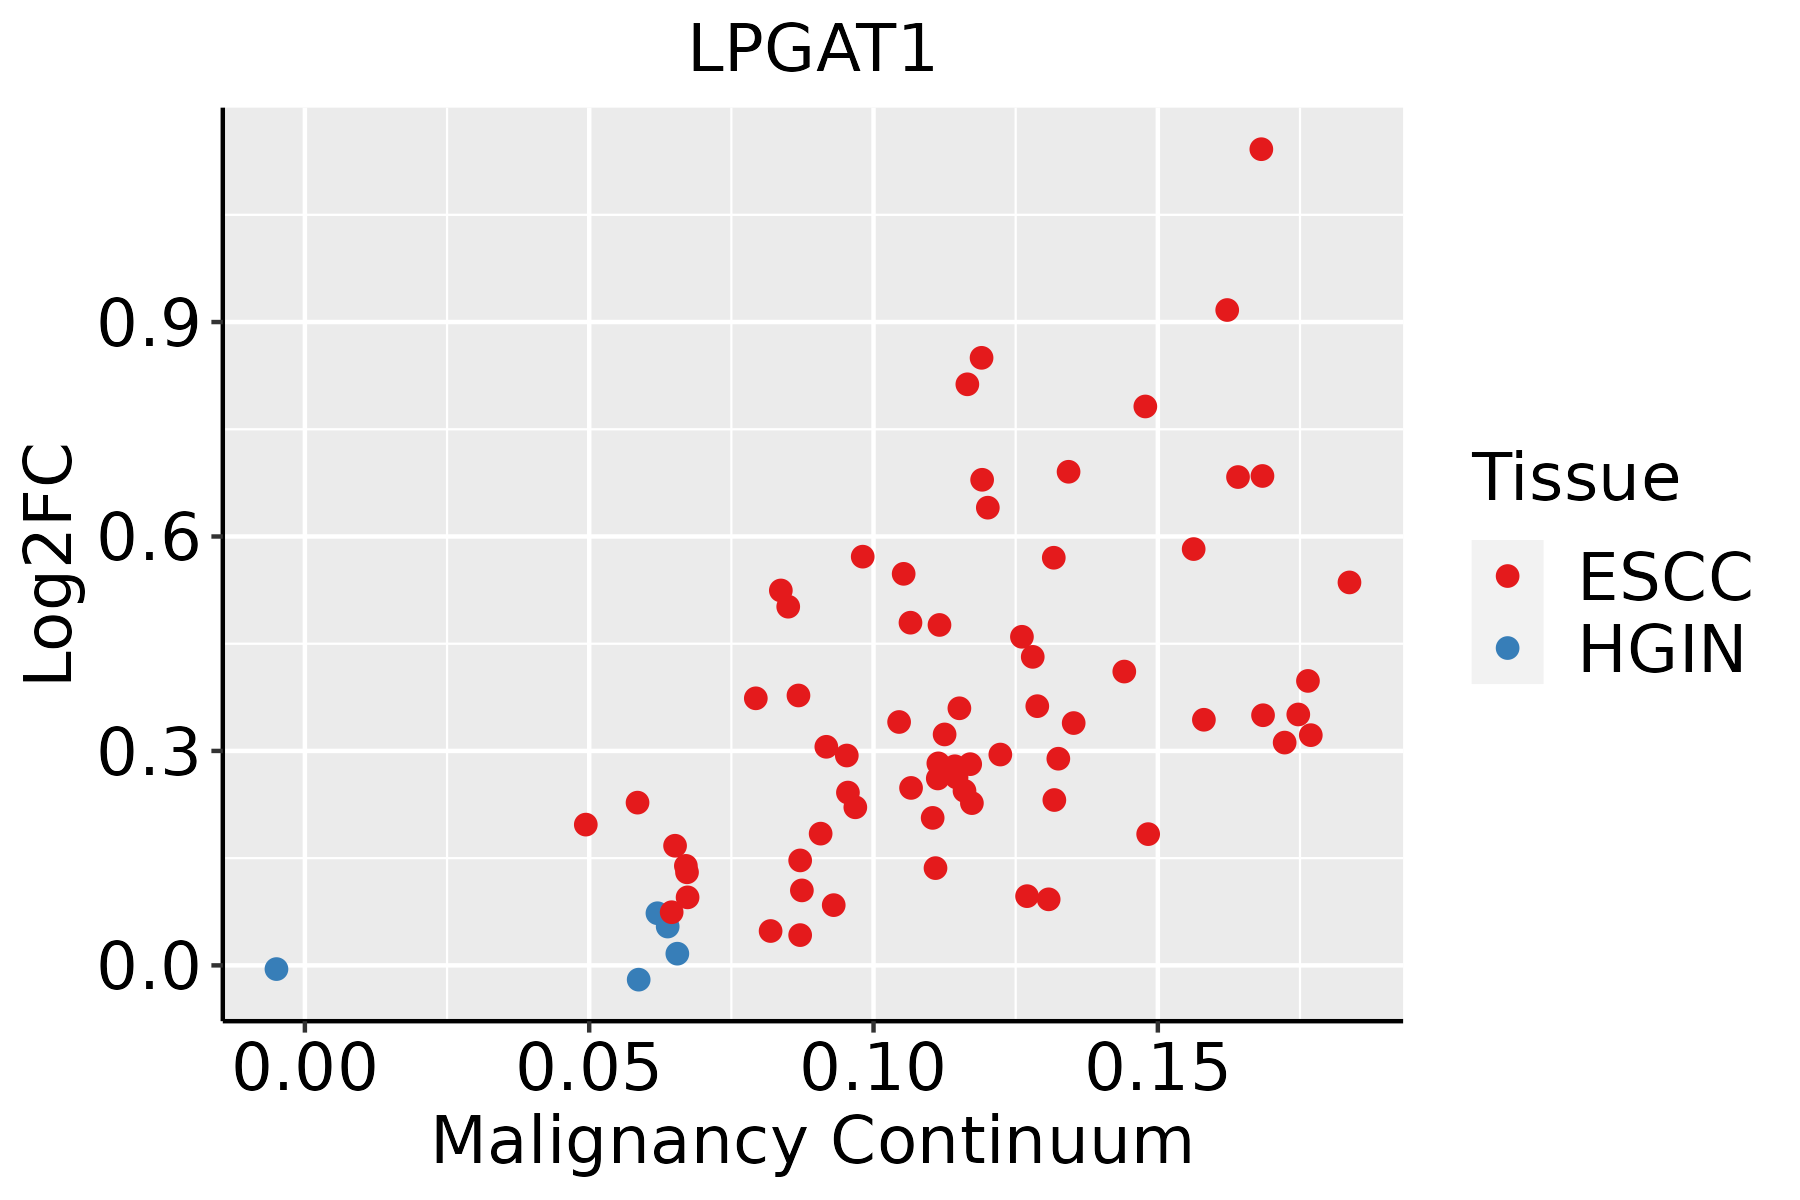 | ESCC: Esophageal squamous cell carcinoma |
| HGIN: High-grade intraepithelial neoplasias | ||
| LGIN: Low-grade intraepithelial neoplasias | ||
| GC | 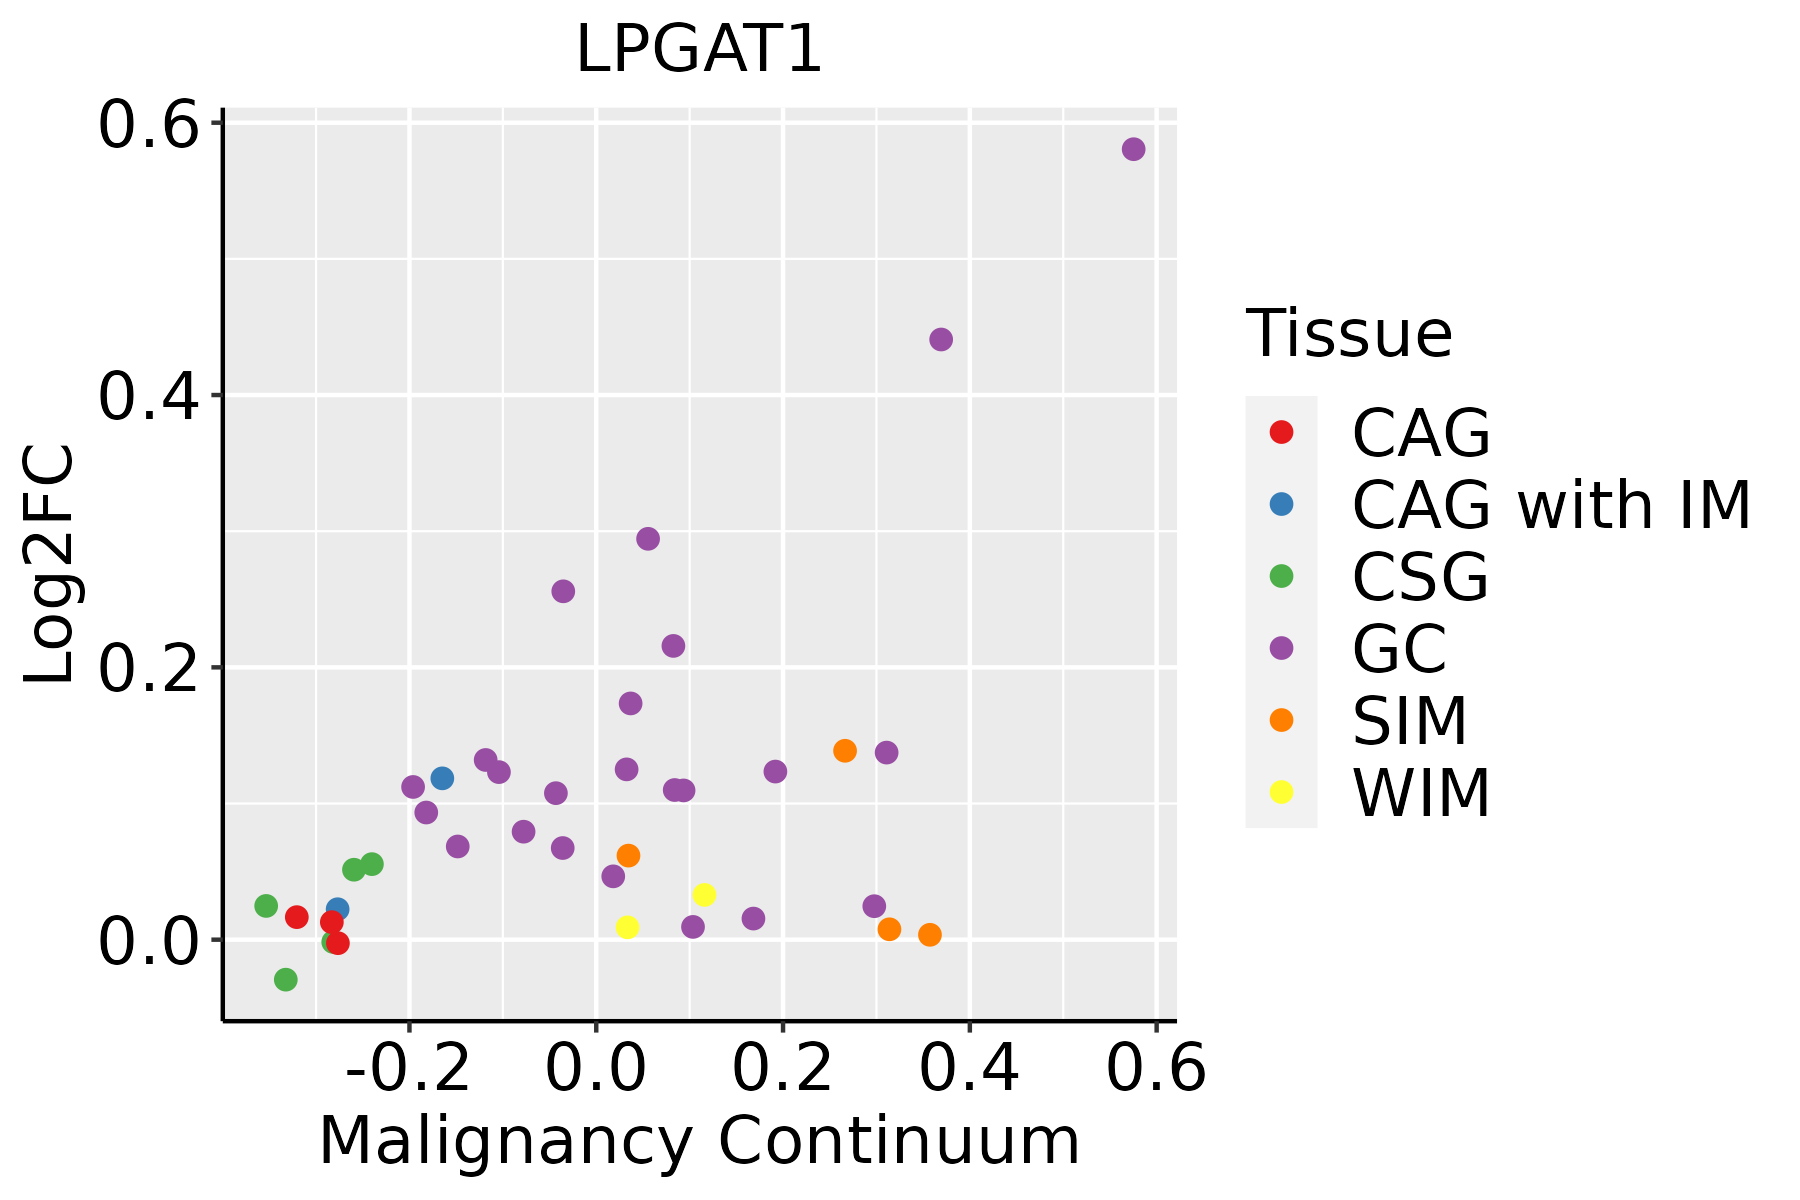 | CAG: Chronic atrophic gastritis |
| CAG with IM: Chronic atrophic gastritis with intestinal metaplasia | ||
| CSG: Chronic superficial gastritis | ||
| GC: Gastric cancer | ||
| SIM: Severe intestinal metaplasia | ||
| WIM: Wild intestinal metaplasia | ||
| Liver | 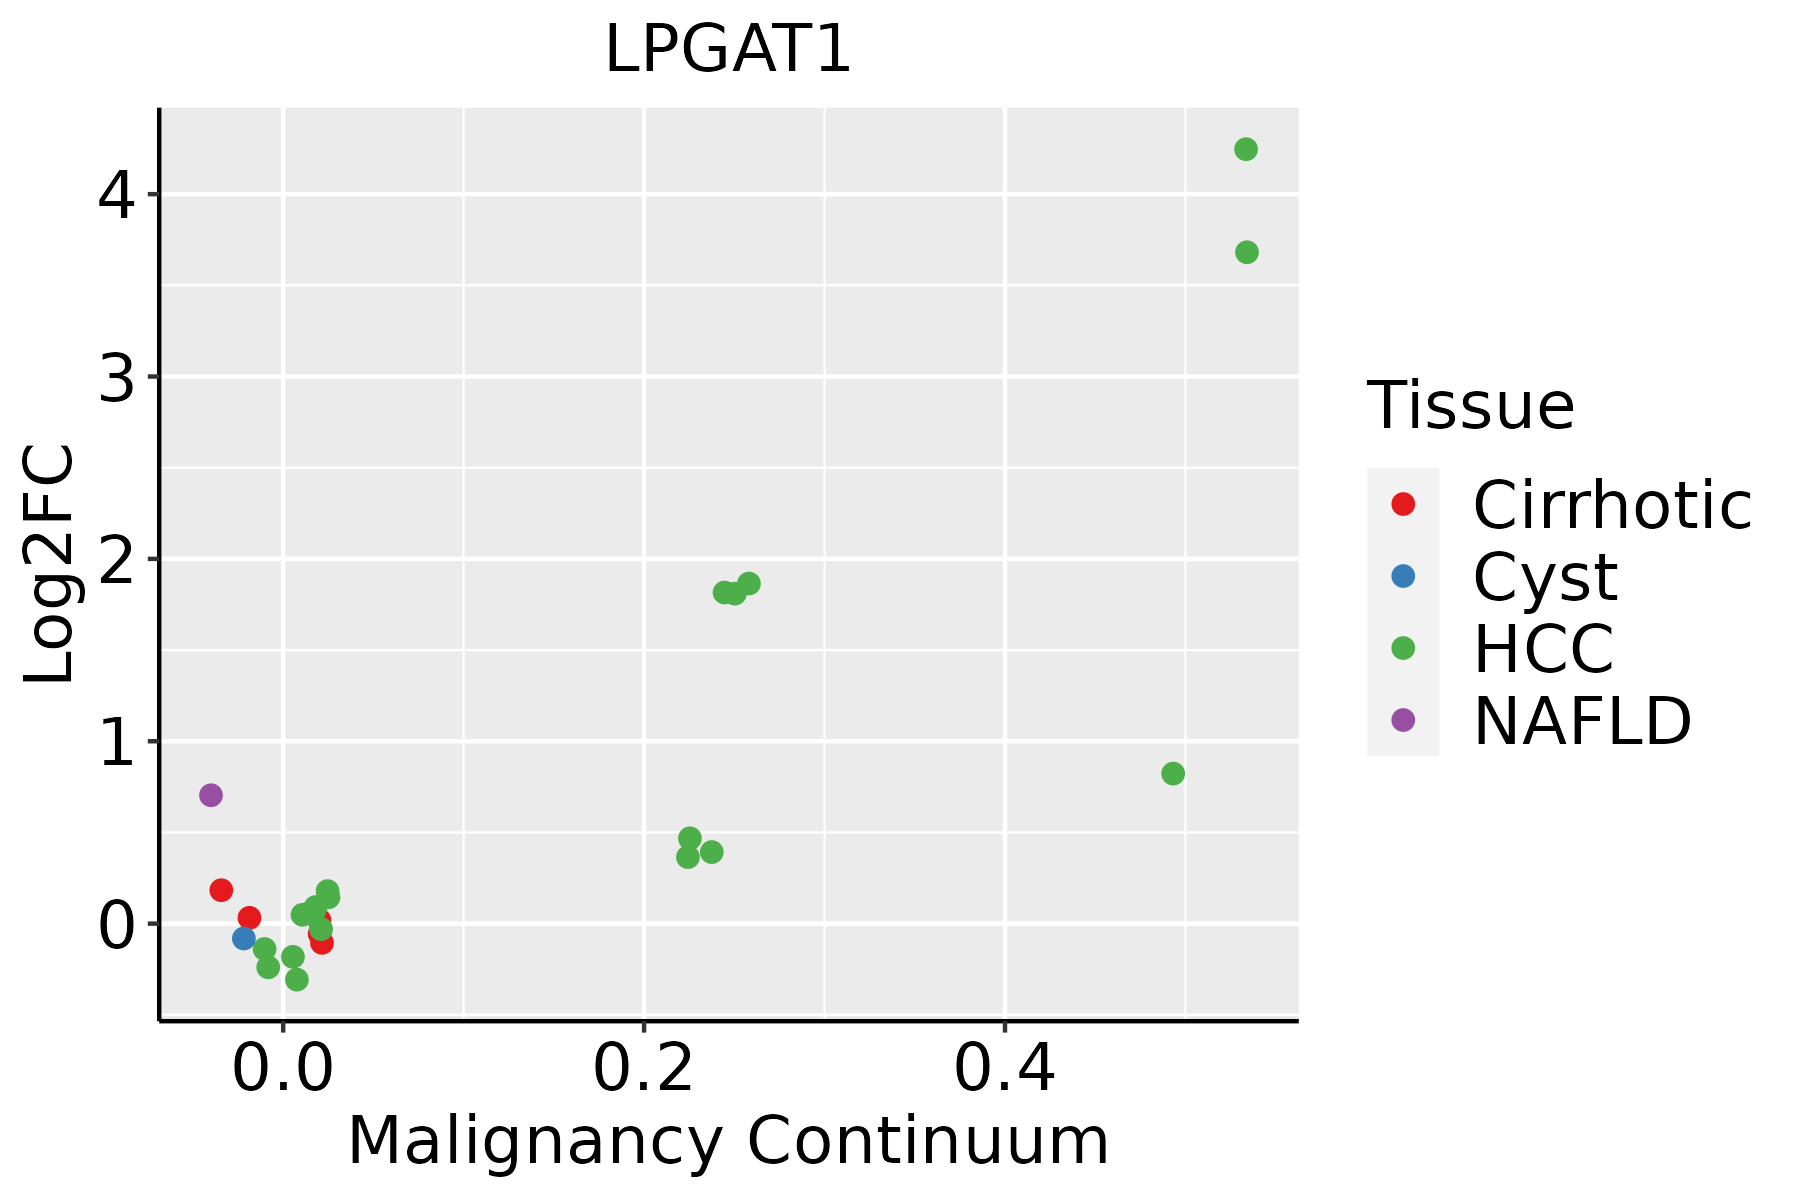 | HCC: Hepatocellular carcinoma |
| NAFLD: Non-alcoholic fatty liver disease | ||
| Oral Cavity | 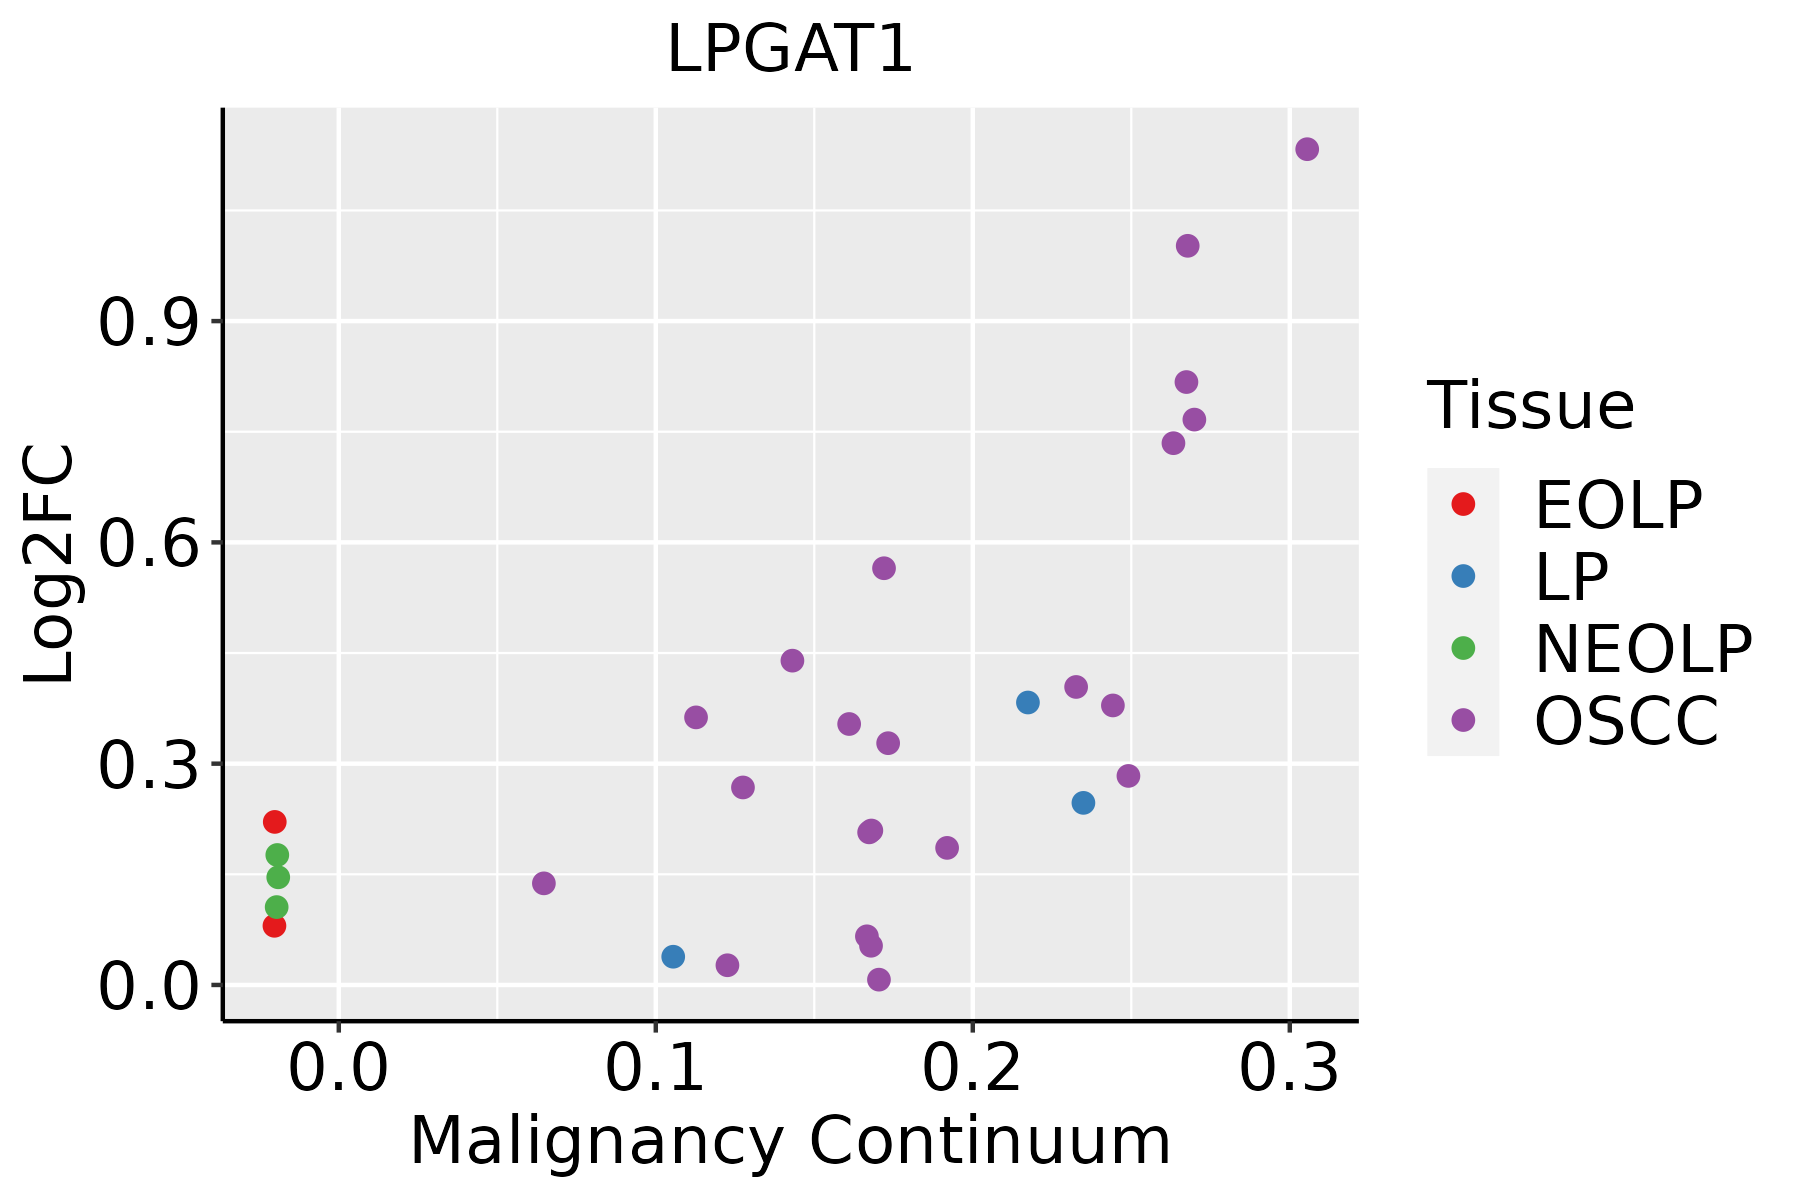 | EOLP: Erosive Oral lichen planus |
| LP: leukoplakia | ||
| NEOLP: Non-erosive oral lichen planus | ||
| OSCC: Oral squamous cell carcinoma | ||
| Prostate |  | BPH: Benign Prostatic Hyperplasia |
| Skin |  | AK: Actinic keratosis |
| cSCC: Cutaneous squamous cell carcinoma | ||
| SCCIS:squamous cell carcinoma in situ | ||
| Thyroid | 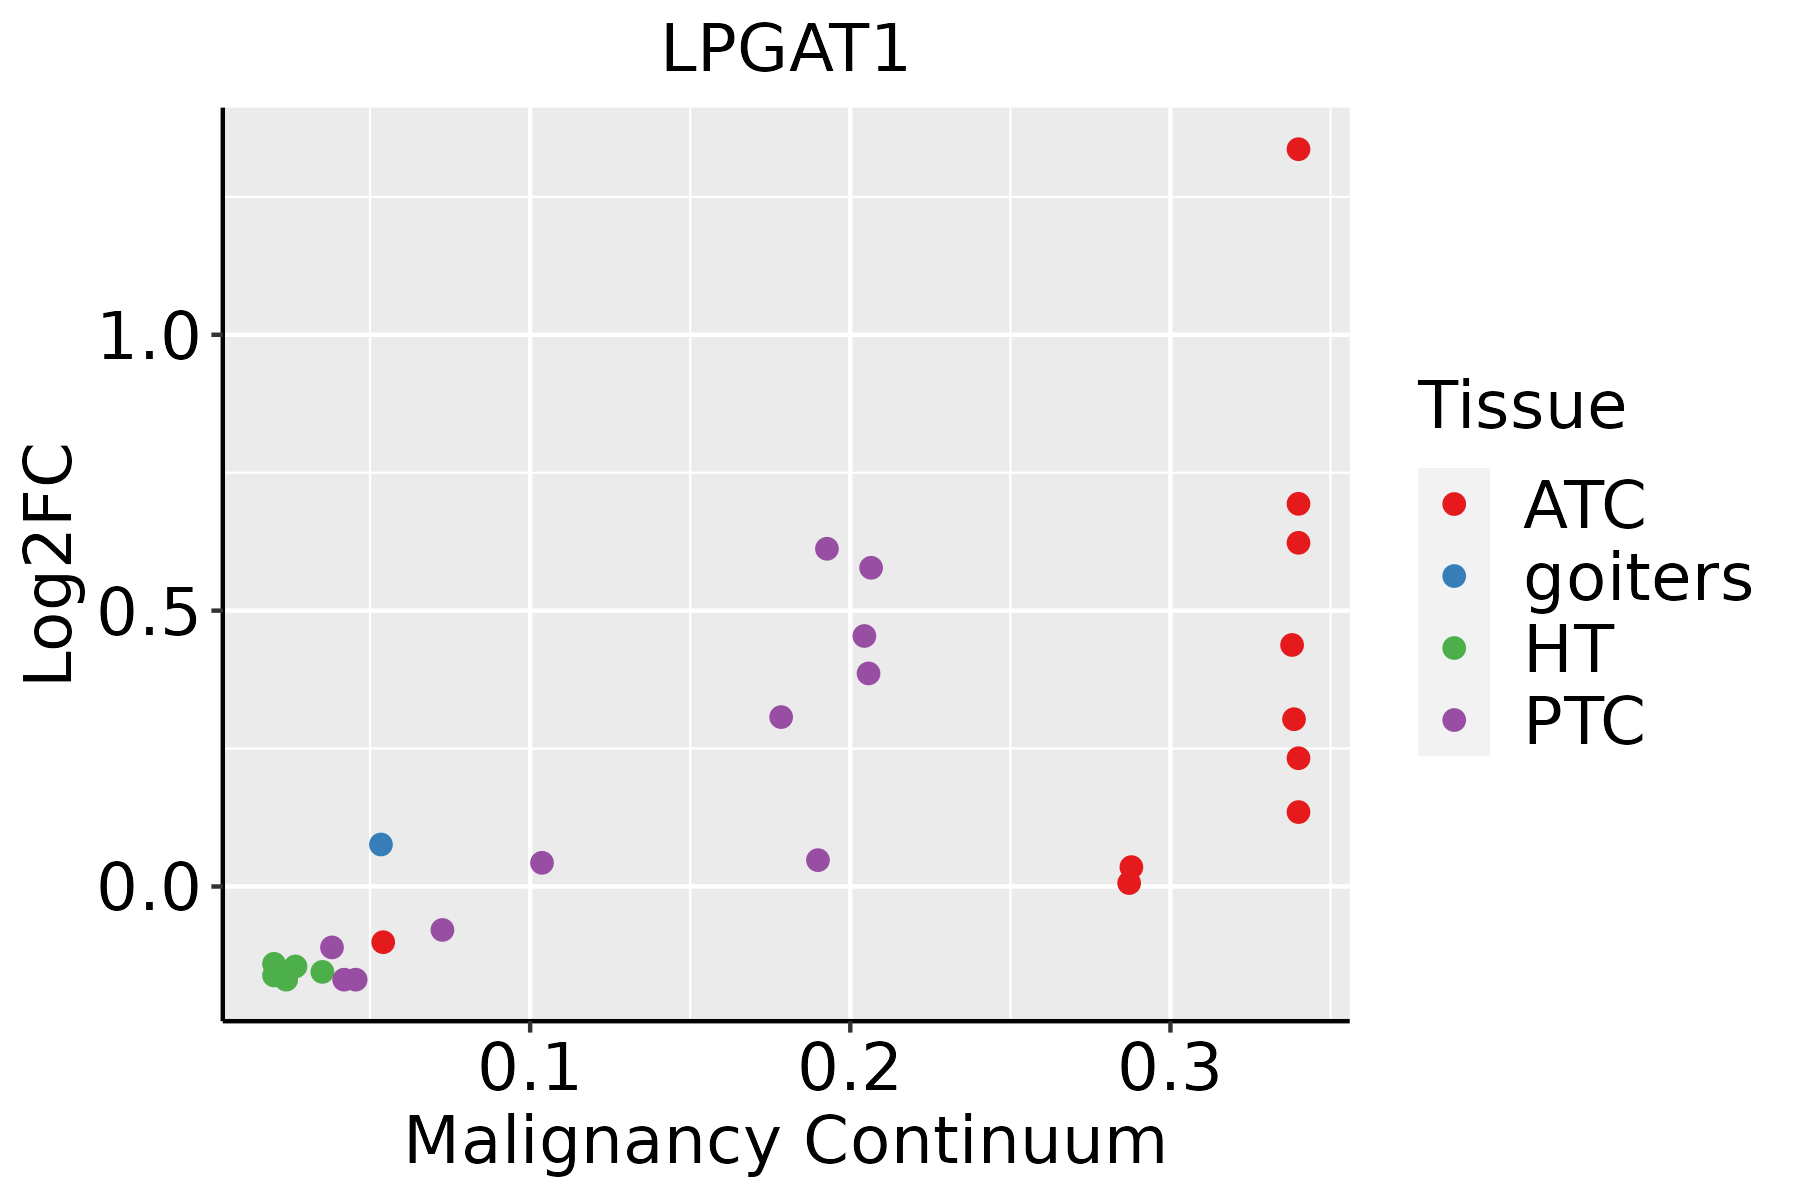 | ATC: Anaplastic thyroid cancer |
| HT: Hashimoto's thyroiditis | ||
| PTC: Papillary thyroid cancer |
| ∗log2FC in expression of this searched gene in stem-like cells from each diseased tissue sample relative to stem-like cells in normal samples in each tissue plotted against the malignancy continuum. Samples are colored based on if they are from different disease stage. |
Top |
Malignant transformation related pathway analysis |
| Find out the enriched GO biological processes and KEGG pathways involved in transition from healthy to precancer to cancer |
| Tissue | Disease Stage | Enriched GO biological Processes |
| Colorectum | AD |  |
| Colorectum | SER |  |
| Colorectum | MSS |  |
| Colorectum | MSI-H |  |
| Colorectum | FAP |  |
| ∗Top 15 enriched GO BP terms are showed in the bar plot of each disease state in each tissue. Each row represents a significant GO biological process which is colored according to the -log10(p.adjust). |
| Page: 1 2 3 4 5 6 7 8 9 |
| GO ID | Tissue | Disease Stage | Description | Gene Ratio | Bg Ratio | pvalue | p.adjust | Count |
| GO:0006631 | Colorectum | AD | fatty acid metabolic process | 114/3918 | 390/18723 | 5.58e-05 | 9.44e-04 | 114 |
| GO:0062012 | Colorectum | AD | regulation of small molecule metabolic process | 93/3918 | 334/18723 | 1.46e-03 | 1.24e-02 | 93 |
| GO:0006650 | Colorectum | AD | glycerophospholipid metabolic process | 83/3918 | 306/18723 | 5.40e-03 | 3.55e-02 | 83 |
| GO:0006644 | Colorectum | AD | phospholipid metabolic process | 101/3918 | 383/18723 | 5.80e-03 | 3.67e-02 | 101 |
| GO:0045017 | Colorectum | AD | glycerolipid biosynthetic process | 69/3918 | 252/18723 | 8.33e-03 | 4.88e-02 | 69 |
| GO:00066312 | Colorectum | MSS | fatty acid metabolic process | 95/3467 | 390/18723 | 2.20e-03 | 1.84e-02 | 95 |
| GO:00620121 | Colorectum | MSS | regulation of small molecule metabolic process | 83/3467 | 334/18723 | 2.25e-03 | 1.85e-02 | 83 |
| GO:0062013 | Colorectum | MSS | positive regulation of small molecule metabolic process | 39/3467 | 143/18723 | 6.34e-03 | 4.23e-02 | 39 |
| GO:0046394 | Colorectum | MSS | carboxylic acid biosynthetic process | 76/3467 | 314/18723 | 6.71e-03 | 4.38e-02 | 76 |
| GO:0016053 | Colorectum | MSS | organic acid biosynthetic process | 76/3467 | 316/18723 | 7.88e-03 | 4.84e-02 | 76 |
| GO:00620122 | Colorectum | FAP | regulation of small molecule metabolic process | 74/2622 | 334/18723 | 3.15e-05 | 7.13e-04 | 74 |
| GO:00066313 | Colorectum | FAP | fatty acid metabolic process | 81/2622 | 390/18723 | 1.43e-04 | 2.24e-03 | 81 |
| GO:0008654 | Colorectum | FAP | phospholipid biosynthetic process | 54/2622 | 253/18723 | 8.88e-04 | 9.08e-03 | 54 |
| GO:00620131 | Colorectum | FAP | positive regulation of small molecule metabolic process | 34/2622 | 143/18723 | 1.15e-03 | 1.10e-02 | 34 |
| GO:00066502 | Colorectum | FAP | glycerophospholipid metabolic process | 62/2622 | 306/18723 | 1.54e-03 | 1.38e-02 | 62 |
| GO:00066442 | Colorectum | FAP | phospholipid metabolic process | 74/2622 | 383/18723 | 2.24e-03 | 1.83e-02 | 74 |
| GO:00450172 | Colorectum | FAP | glycerolipid biosynthetic process | 50/2622 | 252/18723 | 6.32e-03 | 3.95e-02 | 50 |
| GO:00086541 | Colorectum | CRC | phospholipid biosynthetic process | 49/2078 | 253/18723 | 7.07e-05 | 1.51e-03 | 49 |
| GO:00066503 | Colorectum | CRC | glycerophospholipid metabolic process | 55/2078 | 306/18723 | 2.10e-04 | 3.55e-03 | 55 |
| GO:00450173 | Colorectum | CRC | glycerolipid biosynthetic process | 47/2078 | 252/18723 | 2.47e-04 | 4.06e-03 | 47 |
| Page: 1 2 3 4 5 6 7 |
| Pathway ID | Tissue | Disease Stage | Description | Gene Ratio | Bg Ratio | pvalue | p.adjust | qvalue | Count |
| Page: 1 |
Top |
Cell-cell communication analysis |
| Identification of potential cell-cell interactions between two cell types and their ligand-receptor pairs for different disease states |
| Ligand | Receptor | LRpair | Pathway | Tissue | Disease Stage |
| Page: 1 |
Top |
Single-cell gene regulatory network inference analysis |
| Find out the significant the regulons (TFs) and the target genes of each regulon across cell types for different disease states |
| TF | Cell Type | Tissue | Disease Stage | Target Gene | RSS | Regulon Activity |
| ∗The dot plots of a searched regulon are shown for all cell subpopulations in each disease state of each tissue based on the regulon specific score inferred using pySCENIC and by calculating the average expression. |
| Page: 1 |
Top |
Somatic mutation of malignant transformation related genes |
| Annotation of somatic variants for genes involved in malignant transformation |
| Hugo Symbol | Variant Class | Variant Classification | dbSNP RS | HGVSc | HGVSp | HGVSp Short | SWISSPROT | BIOTYPE | SIFT | PolyPhen | Tumor Sample Barcode | Tissue | Histology | Sex | Age | Stage | Therapy Types | Drugs | Outcome |
| LPGAT1 | SNV | Missense_Mutation | novel | c.796N>A | p.Asp266Asn | p.D266N | Q92604 | protein_coding | tolerated(0.08) | benign(0.232) | TCGA-5L-AAT1-01 | Breast | breast invasive carcinoma | Female | <65 | III/IV | Hormone Therapy | letrozol | SD |
| LPGAT1 | SNV | Missense_Mutation | c.863N>T | p.Pro288Leu | p.P288L | Q92604 | protein_coding | deleterious(0.02) | probably_damaging(0.997) | TCGA-A7-A0DA-01 | Breast | breast invasive carcinoma | Female | <65 | I/II | Chemotherapy | adriamycin | SD | |
| LPGAT1 | SNV | Missense_Mutation | c.824N>T | p.Arg275Met | p.R275M | Q92604 | protein_coding | deleterious(0) | probably_damaging(0.997) | TCGA-AN-A0AK-01 | Breast | breast invasive carcinoma | Female | >=65 | I/II | Unknown | Unknown | SD | |
| LPGAT1 | SNV | Missense_Mutation | c.892N>A | p.Asp298Asn | p.D298N | Q92604 | protein_coding | tolerated(0.35) | benign(0.023) | TCGA-BH-A0HF-01 | Breast | breast invasive carcinoma | Female | >=65 | I/II | Hormone Therapy | arimidex | SD | |
| LPGAT1 | insertion | Frame_Shift_Ins | novel | c.697_698dupAG | p.Ser233ArgfsTer11 | p.S233Rfs*11 | Q92604 | protein_coding | TCGA-AN-A0FS-01 | Breast | breast invasive carcinoma | Female | <65 | I/II | Unknown | Unknown | SD | ||
| LPGAT1 | insertion | Nonsense_Mutation | novel | c.1020_1021insTAAATTGTCAAGTAT | p.Ser340_Asn341insTer | p.S340_N341ins* | Q92604 | protein_coding | TCGA-AR-A0U0-01 | Breast | breast invasive carcinoma | Female | >=65 | I/II | Unknown | Unknown | SD | ||
| LPGAT1 | SNV | Missense_Mutation | c.787N>A | p.Glu263Lys | p.E263K | Q92604 | protein_coding | tolerated(1) | benign(0.009) | TCGA-C5-A1BK-01 | Cervix | cervical & endocervical cancer | Female | <65 | I/II | Unknown | Unknown | SD | |
| LPGAT1 | SNV | Missense_Mutation | novel | c.277N>A | p.Asp93Asn | p.D93N | Q92604 | protein_coding | deleterious(0) | probably_damaging(0.911) | TCGA-CM-6678-01 | Colorectum | colon adenocarcinoma | Female | <65 | I/II | Chemotherapy | fluorouracil | SD |
| LPGAT1 | SNV | Missense_Mutation | c.767N>T | p.Thr256Met | p.T256M | Q92604 | protein_coding | deleterious(0) | probably_damaging(0.998) | TCGA-G4-6628-01 | Colorectum | colon adenocarcinoma | Male | >=65 | I/II | Unknown | Unknown | SD | |
| LPGAT1 | SNV | Missense_Mutation | c.1024N>G | p.Leu342Val | p.L342V | Q92604 | protein_coding | tolerated(0.37) | benign(0) | TCGA-AG-3728-01 | Colorectum | rectum adenocarcinoma | Male | >=65 | III/IV | Chemotherapy | folinic | CR |
| Page: 1 2 3 4 |
Top |
Related drugs of malignant transformation related genes |
| Identification of chemicals and drugs interact with genes involved in malignant transfromation |
| (DGIdb 4.0) |
| Entrez ID | Symbol | Category | Interaction Types | Drug Claim Name | Drug Name | PMIDs |
| Page: 1 |

Copyright 2023-Present -The University of Texas Health Science Center at Houston |