
|
|||||
|
 | |
| |
| |
| |
| |
| |
|
Gene: LMF2 |
Gene summary for LMF2 |
| Gene information | Species | Human | Gene symbol | LMF2 | Gene ID | 91289 |
| Gene name | lipase maturation factor 2 | |
| Gene Alias | TMEM112B | |
| Cytomap | 22q13.33 | |
| Gene Type | protein-coding | GO ID | GO:0006807 | UniProtAcc | Q9BU23 |
Top |
Malignant transformation analysis |
| Identification of the aberrant gene expression in precancerous and cancerous lesions by comparing the gene expression of stem-like cells in diseased tissues with normal stem cells |
| Entrez ID | Symbol | Replicates | Species | Organ | Tissue | Adj P-value | Log2FC | Malignancy |
| 91289 | LMF2 | P104T-E | Human | Esophagus | ESCC | 1.98e-09 | 6.17e-01 | 0.0931 |
| 91289 | LMF2 | P107T-E | Human | Esophagus | ESCC | 1.73e-49 | 1.17e+00 | 0.171 |
| 91289 | LMF2 | P126T-E | Human | Esophagus | ESCC | 2.11e-05 | 8.20e-01 | 0.1125 |
| 91289 | LMF2 | P127T-E | Human | Esophagus | ESCC | 3.56e-15 | 2.98e-01 | 0.0826 |
| 91289 | LMF2 | P128T-E | Human | Esophagus | ESCC | 1.82e-32 | 1.15e+00 | 0.1241 |
| 91289 | LMF2 | P130T-E | Human | Esophagus | ESCC | 2.09e-61 | 1.18e+00 | 0.1676 |
| 91289 | LMF2 | HCC1_Meng | Human | Liver | HCC | 5.35e-84 | 2.32e-01 | 0.0246 |
| 91289 | LMF2 | HCC2_Meng | Human | Liver | HCC | 2.57e-27 | 8.85e-02 | 0.0107 |
| 91289 | LMF2 | cirrhotic2 | Human | Liver | Cirrhotic | 6.16e-03 | 9.97e-02 | 0.0201 |
| 91289 | LMF2 | HCC1 | Human | Liver | HCC | 1.43e-07 | 3.92e+00 | 0.5336 |
| 91289 | LMF2 | HCC2 | Human | Liver | HCC | 1.69e-12 | 2.70e+00 | 0.5341 |
| 91289 | LMF2 | Pt13.b | Human | Liver | HCC | 5.38e-05 | 1.04e-01 | 0.0251 |
| 91289 | LMF2 | S014 | Human | Liver | HCC | 4.07e-30 | 1.23e+00 | 0.2254 |
| 91289 | LMF2 | S015 | Human | Liver | HCC | 4.10e-29 | 1.50e+00 | 0.2375 |
| 91289 | LMF2 | S016 | Human | Liver | HCC | 1.12e-38 | 1.42e+00 | 0.2243 |
| 91289 | LMF2 | S027 | Human | Liver | HCC | 1.51e-13 | 1.15e+00 | 0.2446 |
| 91289 | LMF2 | S028 | Human | Liver | HCC | 2.29e-38 | 1.25e+00 | 0.2503 |
| 91289 | LMF2 | S029 | Human | Liver | HCC | 6.74e-35 | 1.50e+00 | 0.2581 |
| 91289 | LMF2 | C04 | Human | Oral cavity | OSCC | 6.74e-28 | 1.02e+00 | 0.2633 |
| 91289 | LMF2 | C21 | Human | Oral cavity | OSCC | 2.23e-62 | 1.90e+00 | 0.2678 |
| Page: 1 2 3 4 5 6 |
| Tissue | Expression Dynamics | Abbreviation |
| Esophagus |  | ESCC: Esophageal squamous cell carcinoma |
| HGIN: High-grade intraepithelial neoplasias | ||
| LGIN: Low-grade intraepithelial neoplasias | ||
| Liver | 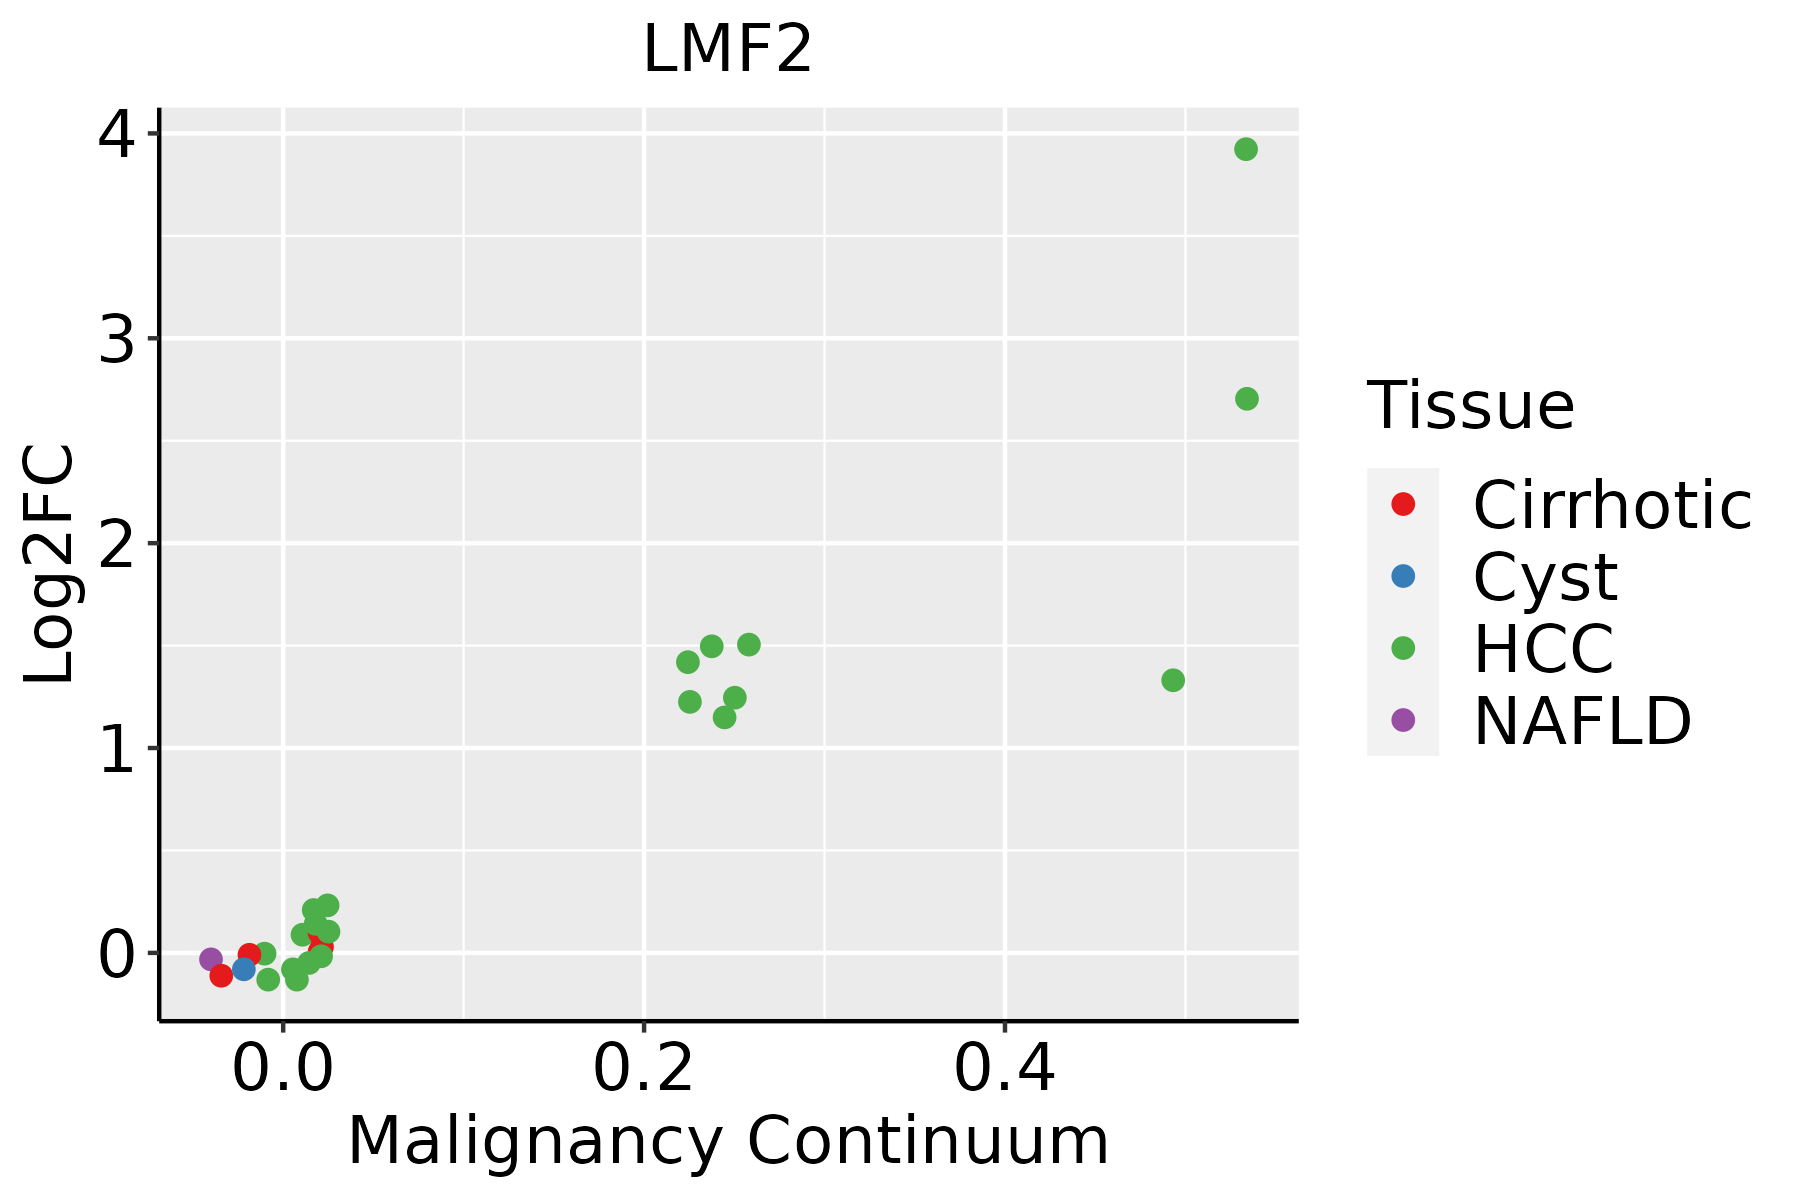 | HCC: Hepatocellular carcinoma |
| NAFLD: Non-alcoholic fatty liver disease | ||
| Oral Cavity | 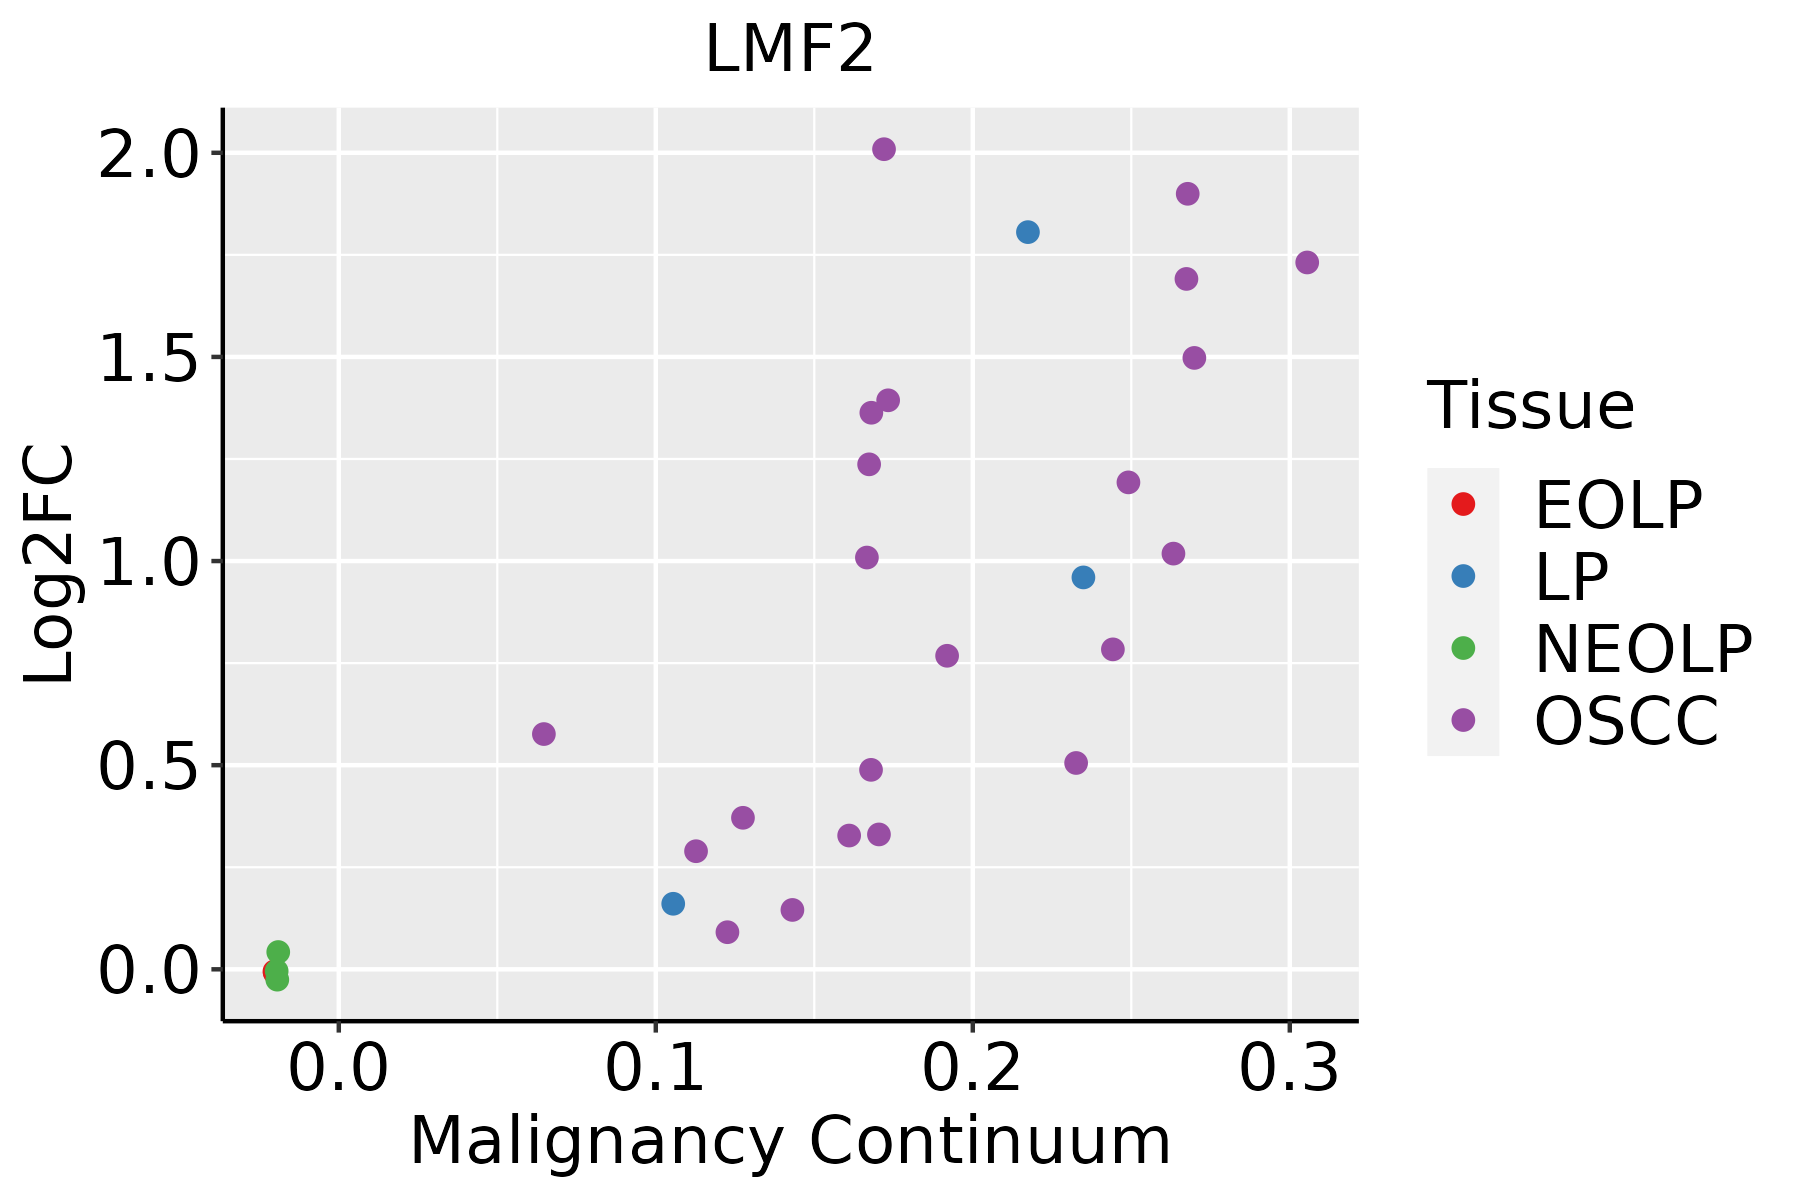 | EOLP: Erosive Oral lichen planus |
| LP: leukoplakia | ||
| NEOLP: Non-erosive oral lichen planus | ||
| OSCC: Oral squamous cell carcinoma | ||
| Skin |  | AK: Actinic keratosis |
| cSCC: Cutaneous squamous cell carcinoma | ||
| SCCIS:squamous cell carcinoma in situ | ||
| Thyroid | 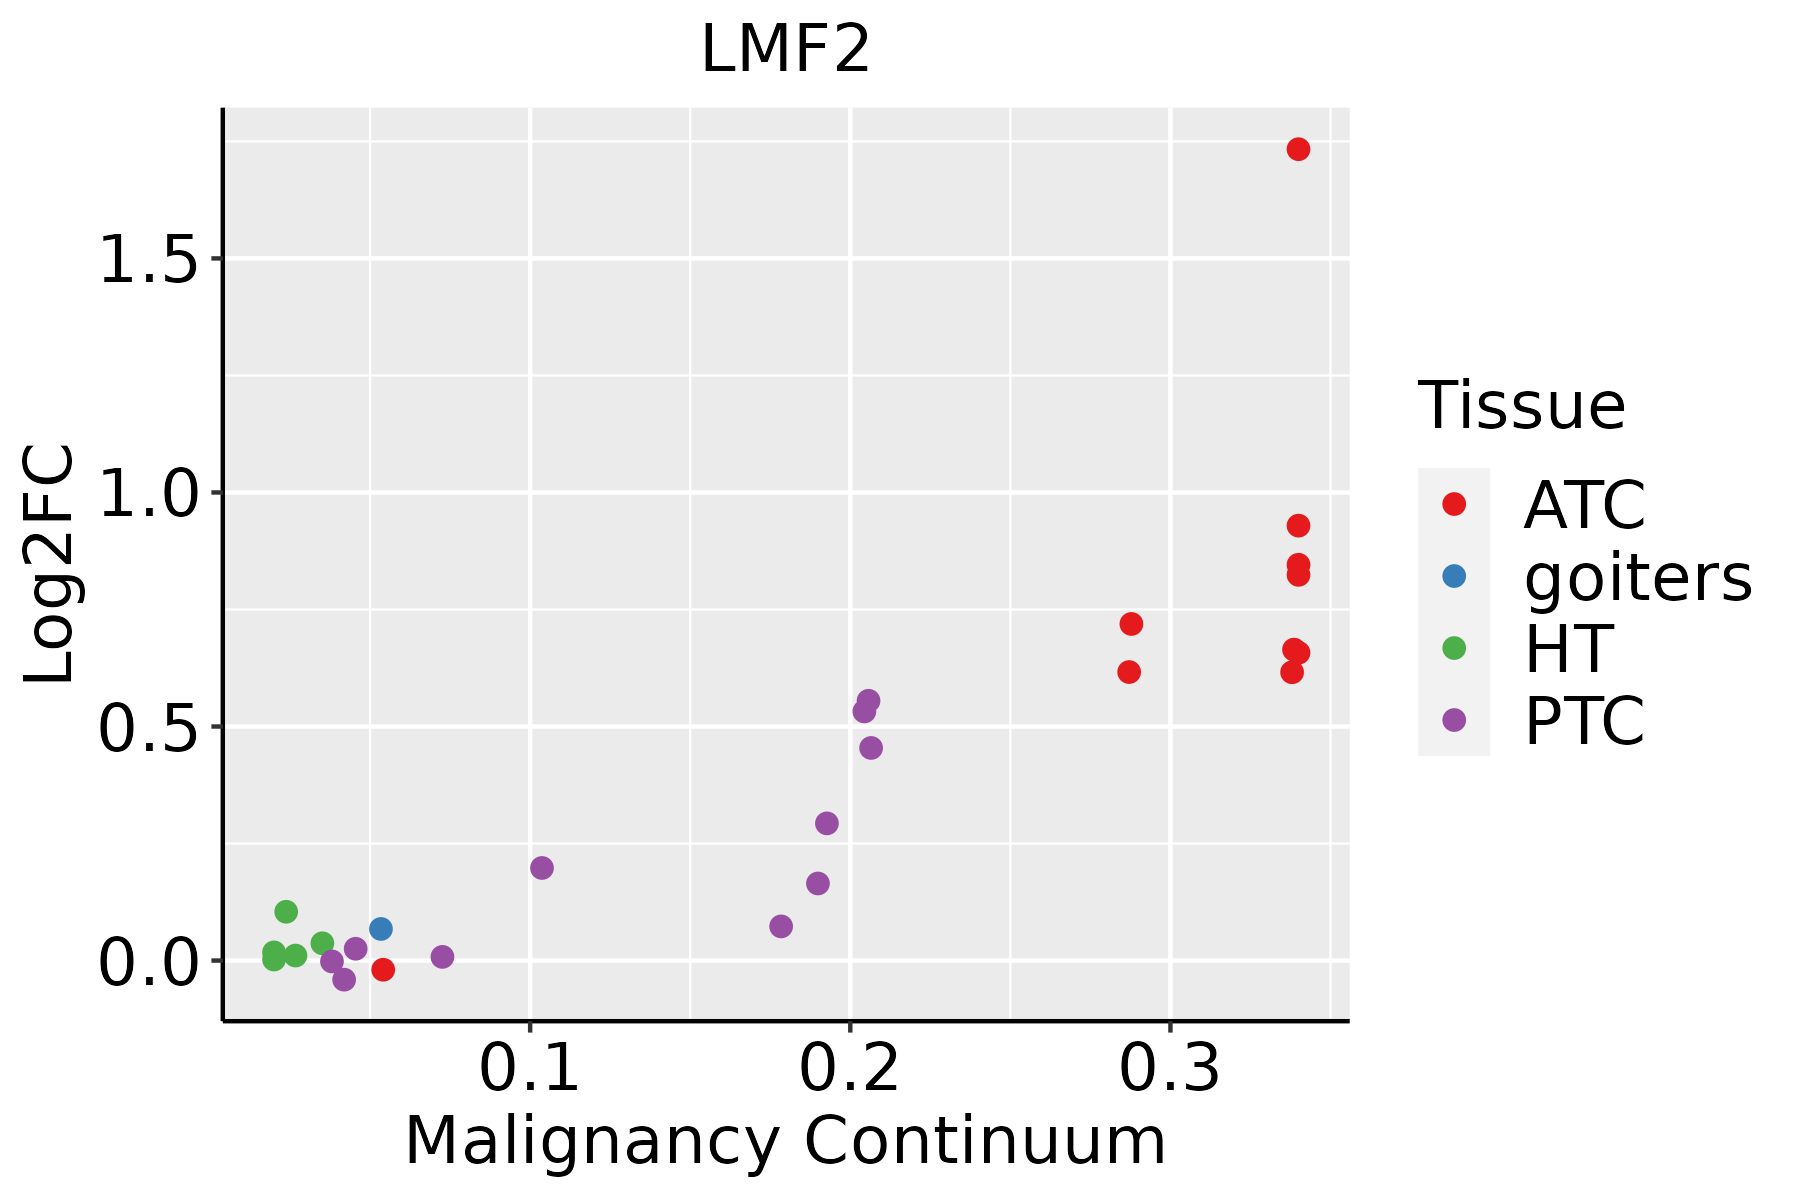 | ATC: Anaplastic thyroid cancer |
| HT: Hashimoto's thyroiditis | ||
| PTC: Papillary thyroid cancer |
| ∗log2FC in expression of this searched gene in stem-like cells from each diseased tissue sample relative to stem-like cells in normal samples in each tissue plotted against the malignancy continuum. Samples are colored based on if they are from different disease stage. |
Top |
Malignant transformation related pathway analysis |
| Find out the enriched GO biological processes and KEGG pathways involved in transition from healthy to precancer to cancer |
| Tissue | Disease Stage | Enriched GO biological Processes |
| Colorectum | AD |  |
| Colorectum | SER |  |
| Colorectum | MSS |  |
| Colorectum | MSI-H |  |
| Colorectum | FAP |  |
| ∗Top 15 enriched GO BP terms are showed in the bar plot of each disease state in each tissue. Each row represents a significant GO biological process which is colored according to the -log10(p.adjust). |
| Page: 1 2 3 4 5 6 7 8 9 |
| GO ID | Tissue | Disease Stage | Description | Gene Ratio | Bg Ratio | pvalue | p.adjust | Count |
| GO:005160417 | Esophagus | HGIN | protein maturation | 68/2587 | 294/18723 | 9.77e-06 | 2.86e-04 | 68 |
| GO:005160418 | Esophagus | ESCC | protein maturation | 189/8552 | 294/18723 | 7.64e-11 | 2.39e-09 | 189 |
| GO:00516046 | Liver | Cirrhotic | protein maturation | 121/4634 | 294/18723 | 3.54e-10 | 1.68e-08 | 121 |
| GO:005160412 | Liver | HCC | protein maturation | 171/7958 | 294/18723 | 3.80e-08 | 8.30e-07 | 171 |
| GO:005160410 | Oral cavity | OSCC | protein maturation | 170/7305 | 294/18723 | 3.97e-11 | 1.28e-09 | 170 |
| GO:005160416 | Oral cavity | LP | protein maturation | 122/4623 | 294/18723 | 1.37e-10 | 7.72e-09 | 122 |
| GO:005160419 | Skin | cSCC | protein maturation | 117/4864 | 294/18723 | 1.27e-07 | 2.93e-06 | 117 |
| GO:005160420 | Thyroid | PTC | protein maturation | 132/5968 | 294/18723 | 1.71e-06 | 2.39e-05 | 132 |
| GO:0051604110 | Thyroid | ATC | protein maturation | 136/6293 | 294/18723 | 4.00e-06 | 4.42e-05 | 136 |
| Page: 1 |
| Pathway ID | Tissue | Disease Stage | Description | Gene Ratio | Bg Ratio | pvalue | p.adjust | qvalue | Count |
| Page: 1 |
Top |
Cell-cell communication analysis |
| Identification of potential cell-cell interactions between two cell types and their ligand-receptor pairs for different disease states |
| Ligand | Receptor | LRpair | Pathway | Tissue | Disease Stage |
| Page: 1 |
Top |
Single-cell gene regulatory network inference analysis |
| Find out the significant the regulons (TFs) and the target genes of each regulon across cell types for different disease states |
| TF | Cell Type | Tissue | Disease Stage | Target Gene | RSS | Regulon Activity |
| ∗The dot plots of a searched regulon are shown for all cell subpopulations in each disease state of each tissue based on the regulon specific score inferred using pySCENIC and by calculating the average expression. |
| Page: 1 |
Top |
Somatic mutation of malignant transformation related genes |
| Annotation of somatic variants for genes involved in malignant transformation |
| Hugo Symbol | Variant Class | Variant Classification | dbSNP RS | HGVSc | HGVSp | HGVSp Short | SWISSPROT | BIOTYPE | SIFT | PolyPhen | Tumor Sample Barcode | Tissue | Histology | Sex | Age | Stage | Therapy Types | Drugs | Outcome |
| LMF2 | SNV | Missense_Mutation | c.334N>A | p.Leu112Met | p.L112M | Q9BU23 | protein_coding | deleterious(0.02) | probably_damaging(0.94) | TCGA-E9-A22G-01 | Breast | breast invasive carcinoma | Female | <65 | I/II | Chemotherapy | doxorubicin | SD | |
| LMF2 | insertion | Frame_Shift_Ins | novel | c.1147_1148insAACGTTTCTCTTTCTTTGAA | p.Ala383GlufsTer25 | p.A383Efs*25 | Q9BU23 | protein_coding | TCGA-A2-A0CX-01 | Breast | breast invasive carcinoma | Female | <65 | I/II | Chemotherapy | adriamycin | SD | ||
| LMF2 | deletion | Frame_Shift_Del | novel | c.728delT | p.Phe243SerfsTer22 | p.F243Sfs*22 | Q9BU23 | protein_coding | TCGA-D8-A27V-01 | Breast | breast invasive carcinoma | Female | <65 | I/II | Hormone Therapy | tamoxiphen | SD | ||
| LMF2 | SNV | Missense_Mutation | rs375477419 | c.1325N>T | p.Ala442Val | p.A442V | Q9BU23 | protein_coding | tolerated(0.18) | benign(0.038) | TCGA-2W-A8YY-01 | Cervix | cervical & endocervical cancer | Female | <65 | I/II | Chemotherapy | cisplatin | CR |
| LMF2 | SNV | Missense_Mutation | novel | c.2048N>A | p.Gly683Glu | p.G683E | Q9BU23 | protein_coding | tolerated(1) | benign(0.058) | TCGA-C5-A902-01 | Cervix | cervical & endocervical cancer | Female | <65 | I/II | Chemotherapy | cisplatin | SD |
| LMF2 | SNV | Missense_Mutation | novel | c.2051N>T | p.Ala684Val | p.A684V | Q9BU23 | protein_coding | tolerated(0.19) | benign(0.006) | TCGA-C5-A905-01 | Cervix | cervical & endocervical cancer | Female | <65 | I/II | Unknown | Unknown | SD |
| LMF2 | SNV | Missense_Mutation | rs149785243 | c.908N>T | p.Thr303Met | p.T303M | Q9BU23 | protein_coding | tolerated(0.32) | benign(0.021) | TCGA-DG-A2KK-01 | Cervix | cervical & endocervical cancer | Female | <65 | III/IV | Chemotherapy | cisplatin | SD |
| LMF2 | SNV | Missense_Mutation | novel | c.1046N>C | p.Arg349Thr | p.R349T | Q9BU23 | protein_coding | deleterious(0.03) | benign(0.018) | TCGA-VS-AA62-01 | Cervix | cervical & endocervical cancer | Female | <65 | I/II | Chemotherapy | cisplatin | PD |
| LMF2 | SNV | Missense_Mutation | rs752866373 | c.1360N>T | p.Leu454Phe | p.L454F | Q9BU23 | protein_coding | deleterious(0) | probably_damaging(0.997) | TCGA-ZJ-AB0H-01 | Cervix | cervical & endocervical cancer | Female | <65 | III/IV | Unknown | Unknown | SD |
| LMF2 | insertion | In_Frame_Ins | novel | c.165_166insGTT | p.Gln55_Gln56insVal | p.Q55_Q56insV | Q9BU23 | protein_coding | TCGA-C5-A7X5-01 | Cervix | cervical & endocervical cancer | Female | >=65 | I/II | Chemotherapy | carboplatin | PD |
| Page: 1 2 3 4 5 6 |
Top |
Related drugs of malignant transformation related genes |
| Identification of chemicals and drugs interact with genes involved in malignant transfromation |
| (DGIdb 4.0) |
| Entrez ID | Symbol | Category | Interaction Types | Drug Claim Name | Drug Name | PMIDs |
| Page: 1 |

Copyright 2023-Present -The University of Texas Health Science Center at Houston |