
|
|||||
|
 | |
| |
| |
| |
| |
| |
|
Gene: KIAA0141 |
Gene summary for KIAA0141 |
| Gene information | Species | Human | Gene symbol | KIAA0141 | Gene ID | 9812 |
| Gene name | DAP3 binding cell death enhancer 1 | |
| Gene Alias | DELE | |
| Cytomap | 5q31.3 | |
| Gene Type | protein-coding | GO ID | GO:0006508 | UniProtAcc | Q14154 |
Top |
Malignant transformation analysis |
| Identification of the aberrant gene expression in precancerous and cancerous lesions by comparing the gene expression of stem-like cells in diseased tissues with normal stem cells |
| Entrez ID | Symbol | Replicates | Species | Organ | Tissue | Adj P-value | Log2FC | Malignancy |
| 9812 | KIAA0141 | C46 | Human | Oral cavity | OSCC | 3.20e-13 | 3.73e-01 | 0.1673 |
| 9812 | KIAA0141 | C57 | Human | Oral cavity | OSCC | 1.80e-04 | 1.18e-01 | 0.1679 |
| 9812 | KIAA0141 | C08 | Human | Oral cavity | OSCC | 6.16e-08 | 1.59e-01 | 0.1919 |
| 9812 | KIAA0141 | C09 | Human | Oral cavity | OSCC | 7.76e-03 | 1.90e-01 | 0.1431 |
| 9812 | KIAA0141 | SYSMH1 | Human | Oral cavity | OSCC | 4.03e-02 | 7.32e-02 | 0.1127 |
| 9812 | KIAA0141 | SYSMH2 | Human | Oral cavity | OSCC | 4.85e-10 | 2.22e-01 | 0.2326 |
| 9812 | KIAA0141 | SYSMH3 | Human | Oral cavity | OSCC | 5.92e-07 | 1.89e-01 | 0.2442 |
| 9812 | KIAA0141 | SYSMH5 | Human | Oral cavity | OSCC | 2.66e-02 | 4.36e-02 | 0.0647 |
| 9812 | KIAA0141 | SYSMH6 | Human | Oral cavity | OSCC | 5.15e-10 | 1.16e-01 | 0.1275 |
| Page: 1 2 3 4 |
| Tissue | Expression Dynamics | Abbreviation |
| Esophagus | 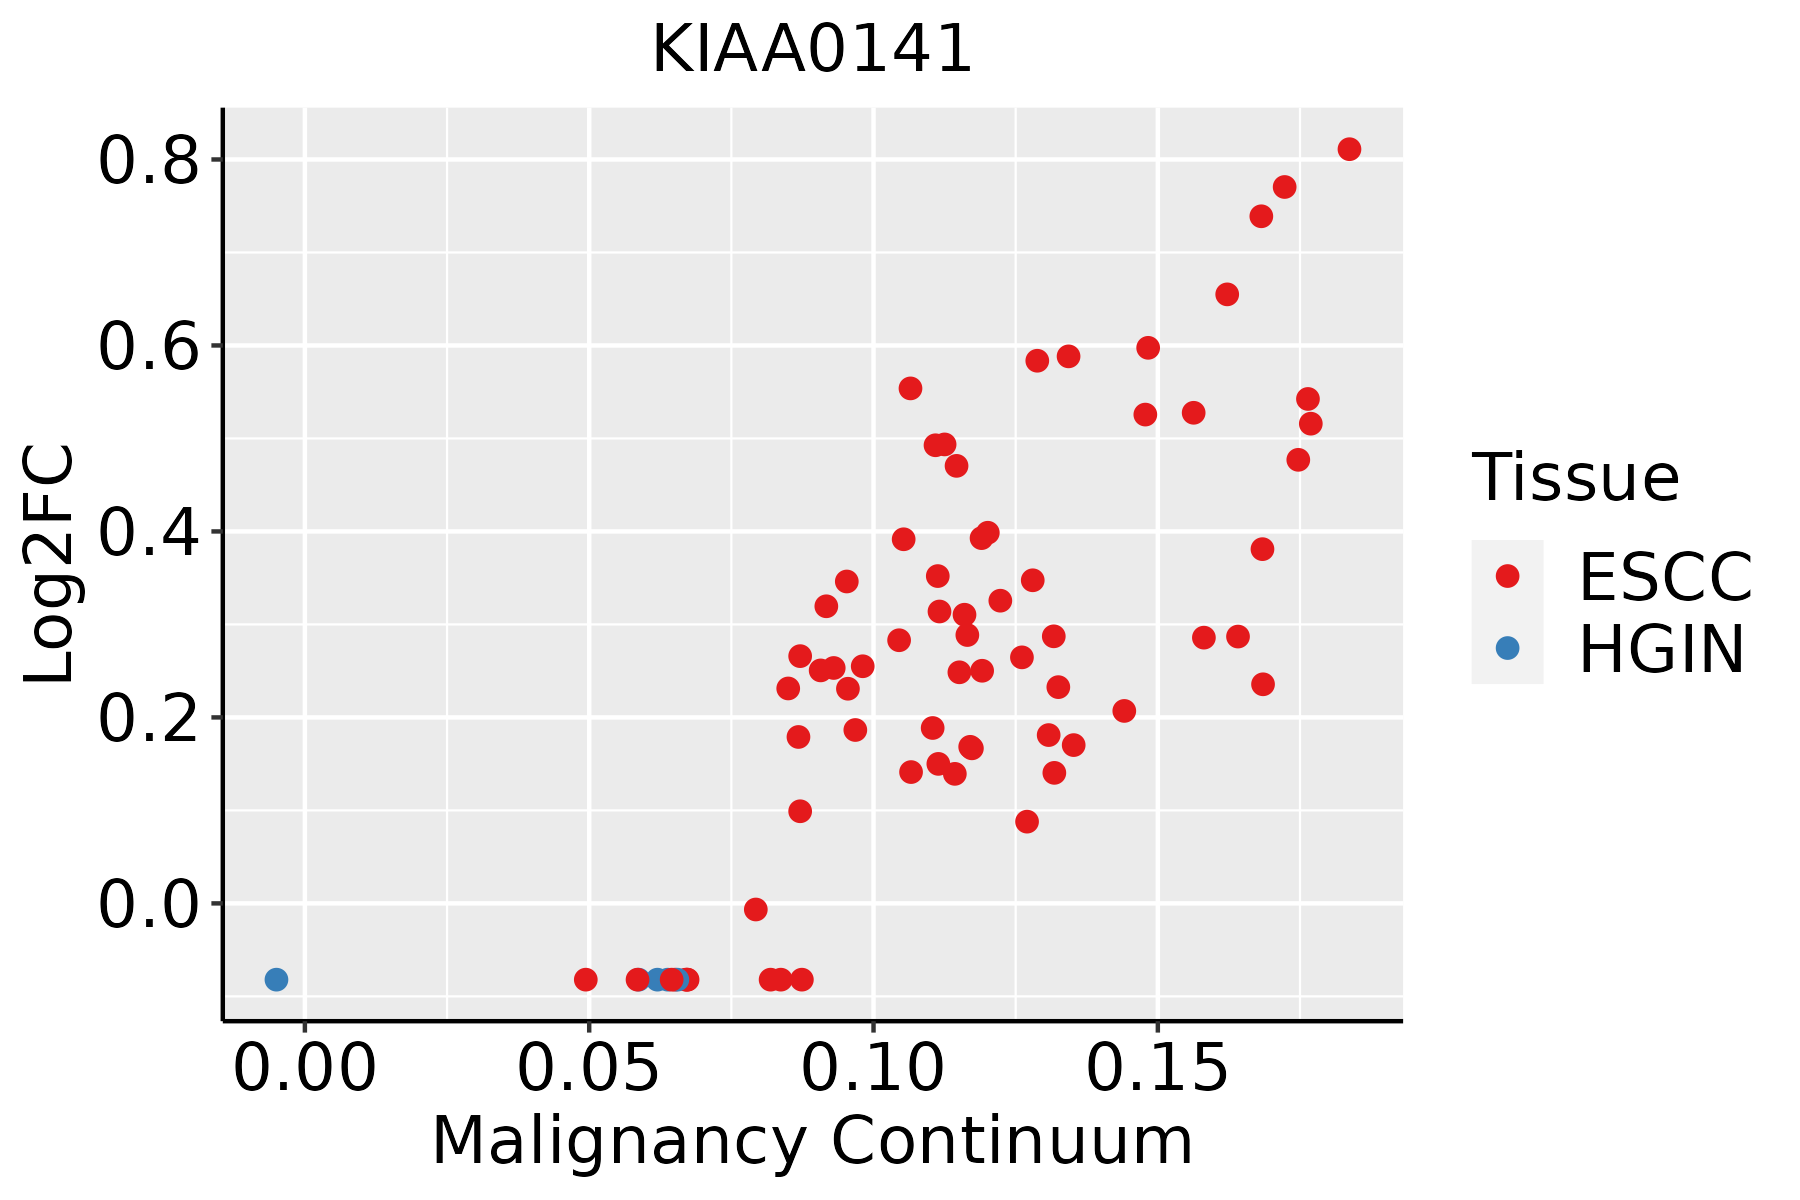 | ESCC: Esophageal squamous cell carcinoma |
| HGIN: High-grade intraepithelial neoplasias | ||
| LGIN: Low-grade intraepithelial neoplasias | ||
| Oral Cavity | 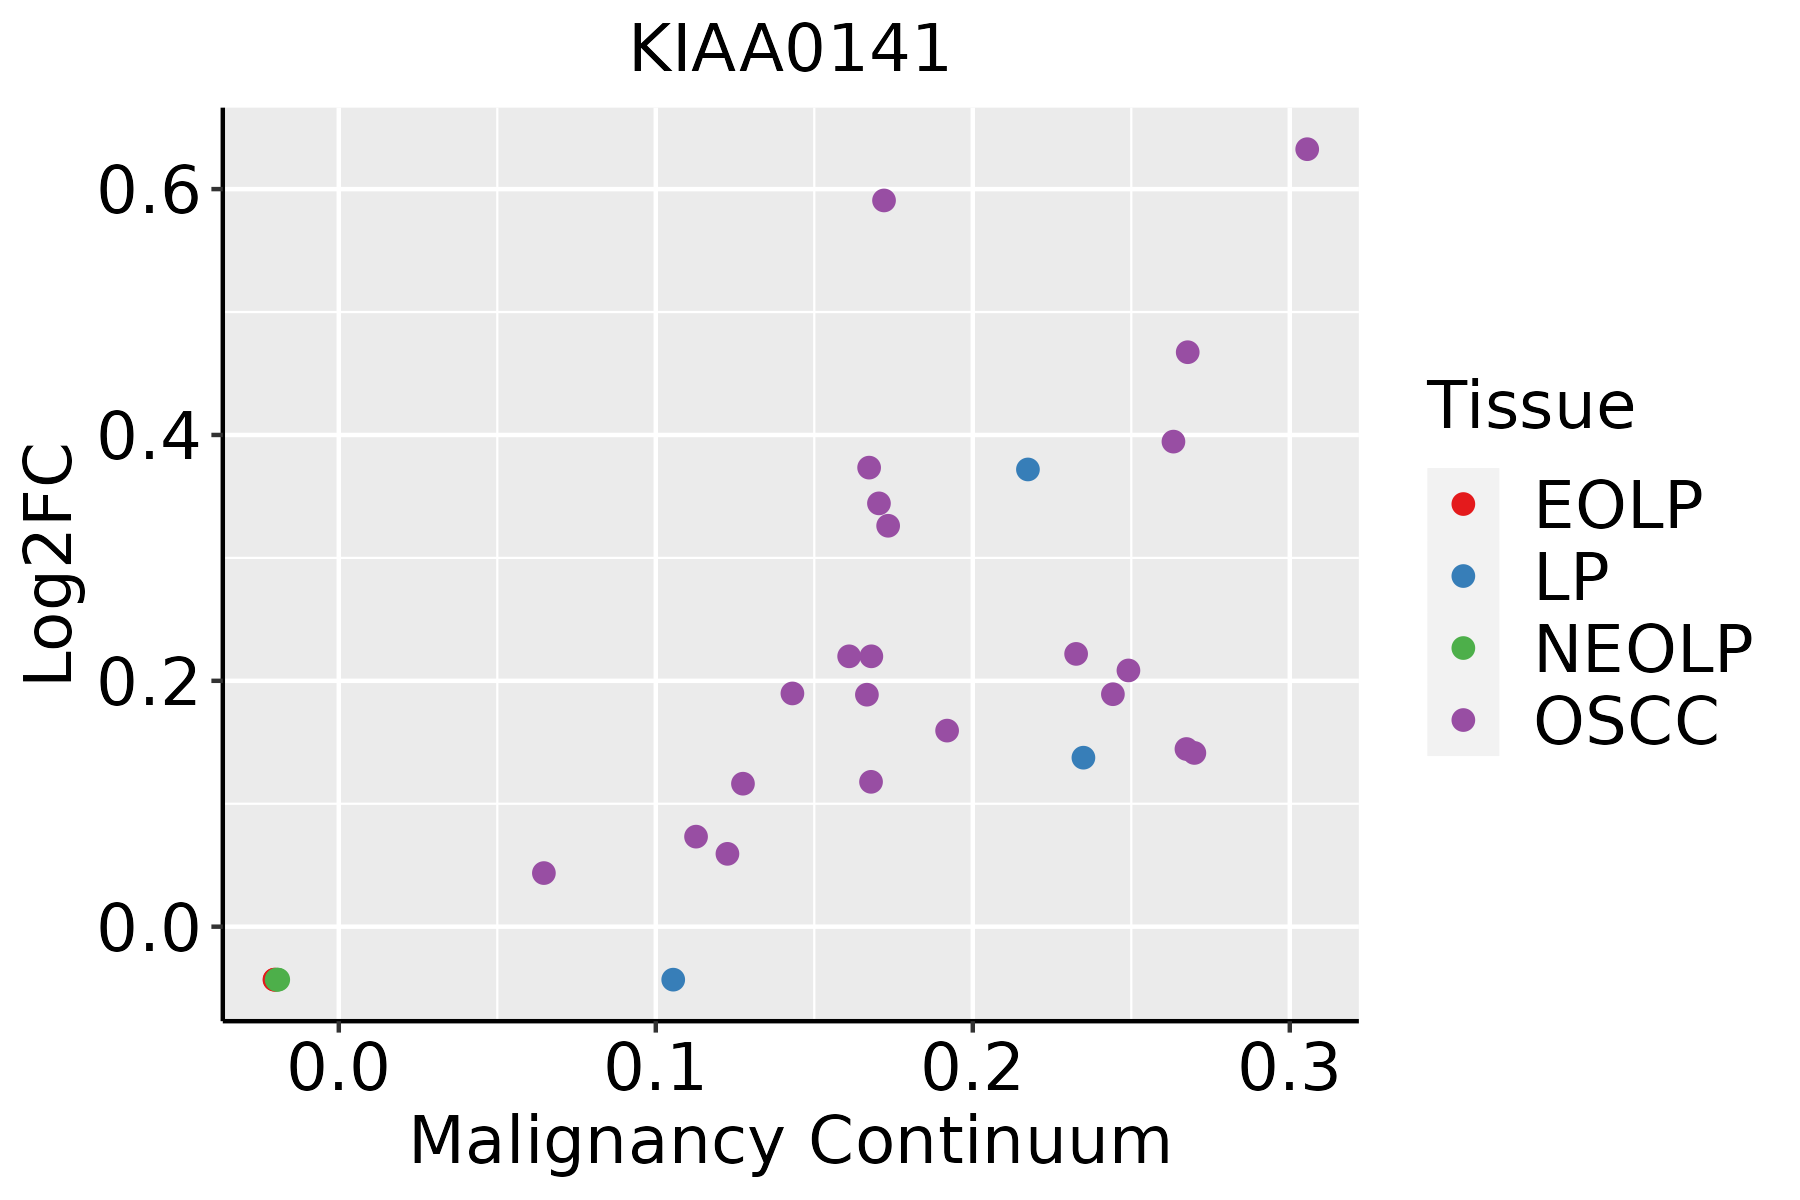 | EOLP: Erosive Oral lichen planus |
| LP: leukoplakia | ||
| NEOLP: Non-erosive oral lichen planus | ||
| OSCC: Oral squamous cell carcinoma |
| ∗log2FC in expression of this searched gene in stem-like cells from each diseased tissue sample relative to stem-like cells in normal samples in each tissue plotted against the malignancy continuum. Samples are colored based on if they are from different disease stage. |
Top |
Malignant transformation related pathway analysis |
| Find out the enriched GO biological processes and KEGG pathways involved in transition from healthy to precancer to cancer |
| Tissue | Disease Stage | Enriched GO biological Processes |
| Colorectum | AD |  |
| Colorectum | SER |  |
| Colorectum | MSS |  |
| Colorectum | MSI-H |  |
| Colorectum | FAP |  |
| ∗Top 15 enriched GO BP terms are showed in the bar plot of each disease state in each tissue. Each row represents a significant GO biological process which is colored according to the -log10(p.adjust). |
| Page: 1 2 3 4 5 6 7 8 9 |
| GO ID | Tissue | Disease Stage | Description | Gene Ratio | Bg Ratio | pvalue | p.adjust | Count |
| Page: 1 |
| Pathway ID | Tissue | Disease Stage | Description | Gene Ratio | Bg Ratio | pvalue | p.adjust | qvalue | Count |
| Page: 1 |
Top |
Cell-cell communication analysis |
| Identification of potential cell-cell interactions between two cell types and their ligand-receptor pairs for different disease states |
| Ligand | Receptor | LRpair | Pathway | Tissue | Disease Stage |
| Page: 1 |
Top |
Single-cell gene regulatory network inference analysis |
| Find out the significant the regulons (TFs) and the target genes of each regulon across cell types for different disease states |
| TF | Cell Type | Tissue | Disease Stage | Target Gene | RSS | Regulon Activity |
| ∗The dot plots of a searched regulon are shown for all cell subpopulations in each disease state of each tissue based on the regulon specific score inferred using pySCENIC and by calculating the average expression. |
| Page: 1 |
Top |
Somatic mutation of malignant transformation related genes |
| Annotation of somatic variants for genes involved in malignant transformation |
| Hugo Symbol | Variant Class | Variant Classification | dbSNP RS | HGVSc | HGVSp | HGVSp Short | SWISSPROT | BIOTYPE | SIFT | PolyPhen | Tumor Sample Barcode | Tissue | Histology | Sex | Age | Stage | Therapy Types | Drugs | Outcome |
| KIAA0141 | SNV | Missense_Mutation | c.1117N>T | p.Val373Leu | p.V373L | Q14154 | protein_coding | tolerated(0.27) | probably_damaging(0.995) | TCGA-C8-A12K-01 | Breast | breast invasive carcinoma | Female | >=65 | I/II | Unknown | Unknown | SD | |
| KIAA0141 | SNV | Missense_Mutation | c.532T>A | p.Ser178Thr | p.S178T | Q14154 | protein_coding | deleterious(0.03) | benign(0.433) | TCGA-D8-A1XK-01 | Breast | breast invasive carcinoma | Female | <65 | I/II | Chemotherapy | doxorubicine+cyclophosphamide | SD | |
| KIAA0141 | deletion | Frame_Shift_Del | c.268_274delACTCTGG | p.Thr90ProfsTer24 | p.T90Pfs*24 | Q14154 | protein_coding | TCGA-D8-A13Z-01 | Breast | breast invasive carcinoma | Female | <65 | I/II | Chemotherapy | doxorubicine | SD | |||
| KIAA0141 | deletion | Frame_Shift_Del | novel | c.624delN | p.Lys209AsnfsTer25 | p.K209Nfs*25 | Q14154 | protein_coding | TCGA-EW-A2FV-01 | Breast | breast invasive carcinoma | Female | <65 | III/IV | Chemotherapy | docetaxel | SD | ||
| KIAA0141 | SNV | Missense_Mutation | c.679N>G | p.Leu227Val | p.L227V | Q14154 | protein_coding | tolerated(0.1) | benign(0.003) | TCGA-EK-A2RA-01 | Cervix | cervical & endocervical cancer | Female | >=65 | I/II | Unknown | Unknown | SD | |
| KIAA0141 | SNV | Missense_Mutation | rs145284153 | c.227G>A | p.Arg76His | p.R76H | Q14154 | protein_coding | tolerated(0.19) | benign(0) | TCGA-A6-5660-01 | Colorectum | colon adenocarcinoma | Male | >=65 | III/IV | Ancillary | leucovorin | SD |
| KIAA0141 | SNV | Missense_Mutation | novel | c.821N>T | p.Arg274Leu | p.R274L | Q14154 | protein_coding | tolerated(0.06) | benign(0.158) | TCGA-AA-A00N-01 | Colorectum | colon adenocarcinoma | Male | >=65 | I/II | Unknown | Unknown | PD |
| KIAA0141 | SNV | Missense_Mutation | rs137962377 | c.1249N>A | p.Ala417Thr | p.A417T | Q14154 | protein_coding | deleterious(0) | probably_damaging(0.999) | TCGA-AA-A02O-01 | Colorectum | colon adenocarcinoma | Male | >=65 | I/II | Unknown | Unknown | SD |
| KIAA0141 | SNV | Missense_Mutation | novel | c.359N>T | p.Trp120Leu | p.W120L | Q14154 | protein_coding | deleterious(0.01) | possibly_damaging(0.656) | TCGA-AA-A02R-01 | Colorectum | colon adenocarcinoma | Female | >=65 | I/II | Unknown | Unknown | PD |
| KIAA0141 | SNV | Missense_Mutation | c.299G>T | p.Arg100Met | p.R100M | Q14154 | protein_coding | deleterious(0) | probably_damaging(0.927) | TCGA-AZ-6601-01 | Colorectum | colon adenocarcinoma | Male | >=65 | I/II | Unknown | Unknown | PD |
| Page: 1 2 3 4 5 |
Top |
Related drugs of malignant transformation related genes |
| Identification of chemicals and drugs interact with genes involved in malignant transfromation |
| (DGIdb 4.0) |
| Entrez ID | Symbol | Category | Interaction Types | Drug Claim Name | Drug Name | PMIDs |
| Page: 1 |

Copyright 2023-Present -The University of Texas Health Science Center at Houston |