
|
|||||
|
 | |
| |
| |
| |
| |
| |
|
Gene: ISG15 |
Gene summary for ISG15 |
| Gene information | Species | Human | Gene symbol | ISG15 | Gene ID | 9636 |
| Gene name | ISG15 ubiquitin like modifier | |
| Gene Alias | G1P2 | |
| Cytomap | 1p36.33 | |
| Gene Type | protein-coding | GO ID | GO:0001503 | UniProtAcc | P05161 |
Top |
Malignant transformation analysis |
| Identification of the aberrant gene expression in precancerous and cancerous lesions by comparing the gene expression of stem-like cells in diseased tissues with normal stem cells |
| Entrez ID | Symbol | Replicates | Species | Organ | Tissue | Adj P-value | Log2FC | Malignancy |
| 9636 | ISG15 | GSM6177620_NYU_UCEC1_lib2_lib2 | Human | Endometrium | EEC | 5.97e-21 | 2.13e-01 | -0.1875 |
| 9636 | ISG15 | GSM6177620_NYU_UCEC1_lib3_lib3 | Human | Endometrium | EEC | 2.16e-20 | 1.62e-01 | -0.1883 |
| 9636 | ISG15 | GSM6177621_NYU_UCEC2_lib1_lib1 | Human | Endometrium | EEC | 6.52e-22 | -3.93e-01 | -0.1934 |
| 9636 | ISG15 | GSM6177622_NYU_UCEC3_lib1_lib1 | Human | Endometrium | EEC | 3.40e-23 | -2.76e-01 | -0.1917 |
| 9636 | ISG15 | GSM6177622_NYU_UCEC3_lib2_lib2 | Human | Endometrium | EEC | 3.70e-23 | -3.46e-01 | -0.1916 |
| 9636 | ISG15 | LZE4T | Human | Esophagus | ESCC | 5.20e-19 | 5.83e-01 | 0.0811 |
| 9636 | ISG15 | LZE5T | Human | Esophagus | ESCC | 3.11e-22 | 1.56e+00 | 0.0514 |
| 9636 | ISG15 | LZE7T | Human | Esophagus | ESCC | 1.36e-20 | 1.35e+00 | 0.0667 |
| 9636 | ISG15 | LZE8T | Human | Esophagus | ESCC | 1.73e-18 | 6.68e-01 | 0.067 |
| 9636 | ISG15 | LZE20T | Human | Esophagus | ESCC | 1.79e-40 | 1.94e+00 | 0.0662 |
| 9636 | ISG15 | LZE21D1 | Human | Esophagus | HGIN | 8.33e-04 | 6.85e-01 | 0.0632 |
| 9636 | ISG15 | LZE22D1 | Human | Esophagus | HGIN | 8.35e-06 | 4.65e-01 | 0.0595 |
| 9636 | ISG15 | LZE22T | Human | Esophagus | ESCC | 4.23e-16 | 1.36e+00 | 0.068 |
| 9636 | ISG15 | LZE24T | Human | Esophagus | ESCC | 9.41e-64 | 3.62e+00 | 0.0596 |
| 9636 | ISG15 | LZE21T | Human | Esophagus | ESCC | 4.04e-07 | 1.23e+00 | 0.0655 |
| 9636 | ISG15 | LZE6T | Human | Esophagus | ESCC | 1.73e-09 | 6.83e-01 | 0.0845 |
| 9636 | ISG15 | P1T-E | Human | Esophagus | ESCC | 4.95e-32 | 3.10e+00 | 0.0875 |
| 9636 | ISG15 | P2T-E | Human | Esophagus | ESCC | 9.38e-81 | 2.04e+00 | 0.1177 |
| 9636 | ISG15 | P4T-E | Human | Esophagus | ESCC | 2.15e-84 | 2.41e+00 | 0.1323 |
| 9636 | ISG15 | P5T-E | Human | Esophagus | ESCC | 6.87e-100 | 2.45e+00 | 0.1327 |
| Page: 1 2 3 4 5 6 7 8 9 10 11 12 |
| Tissue | Expression Dynamics | Abbreviation |
| Breast | 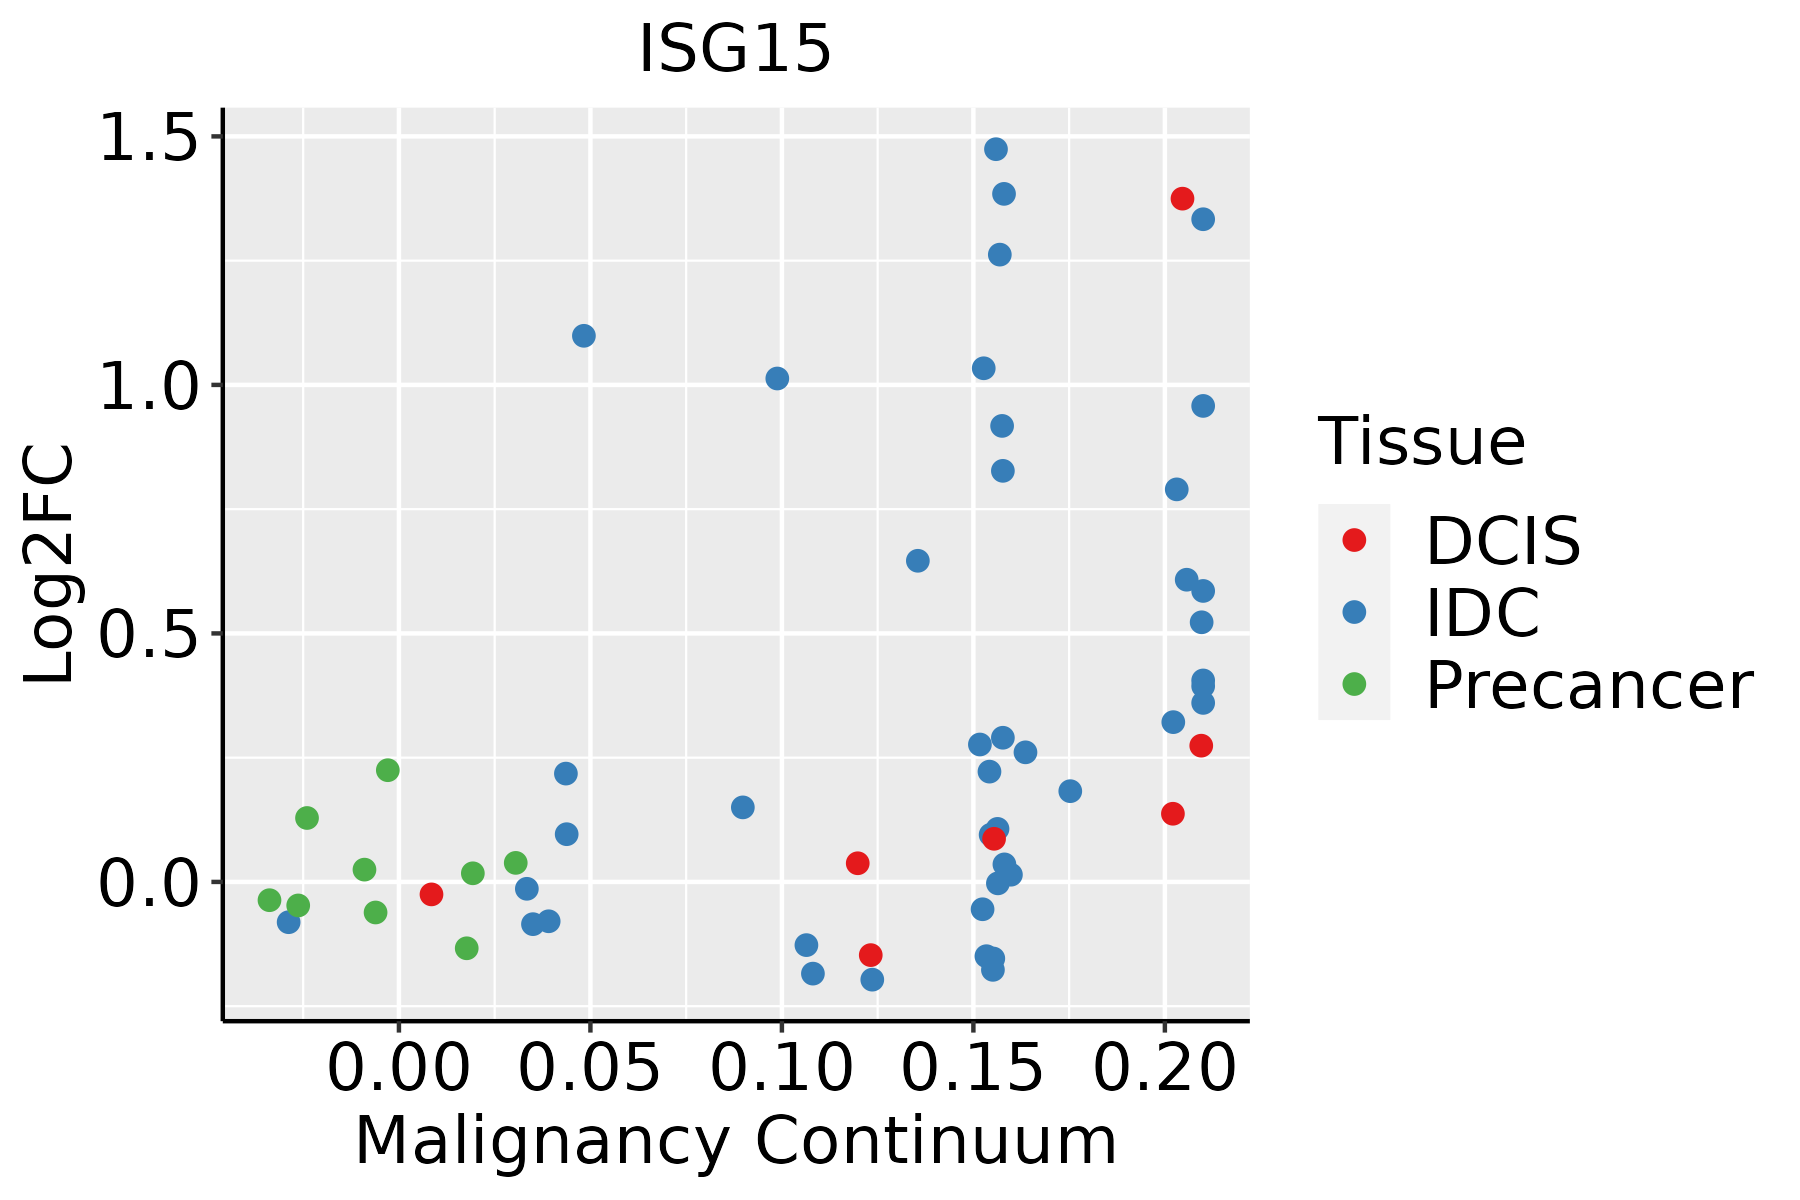 | IDC: Invasive ductal carcinoma |
| DCIS: Ductal carcinoma in situ | ||
| Precancer(BRCA1-mut): Precancerous lesion from BRCA1 mutation carriers | ||
| Cervix | 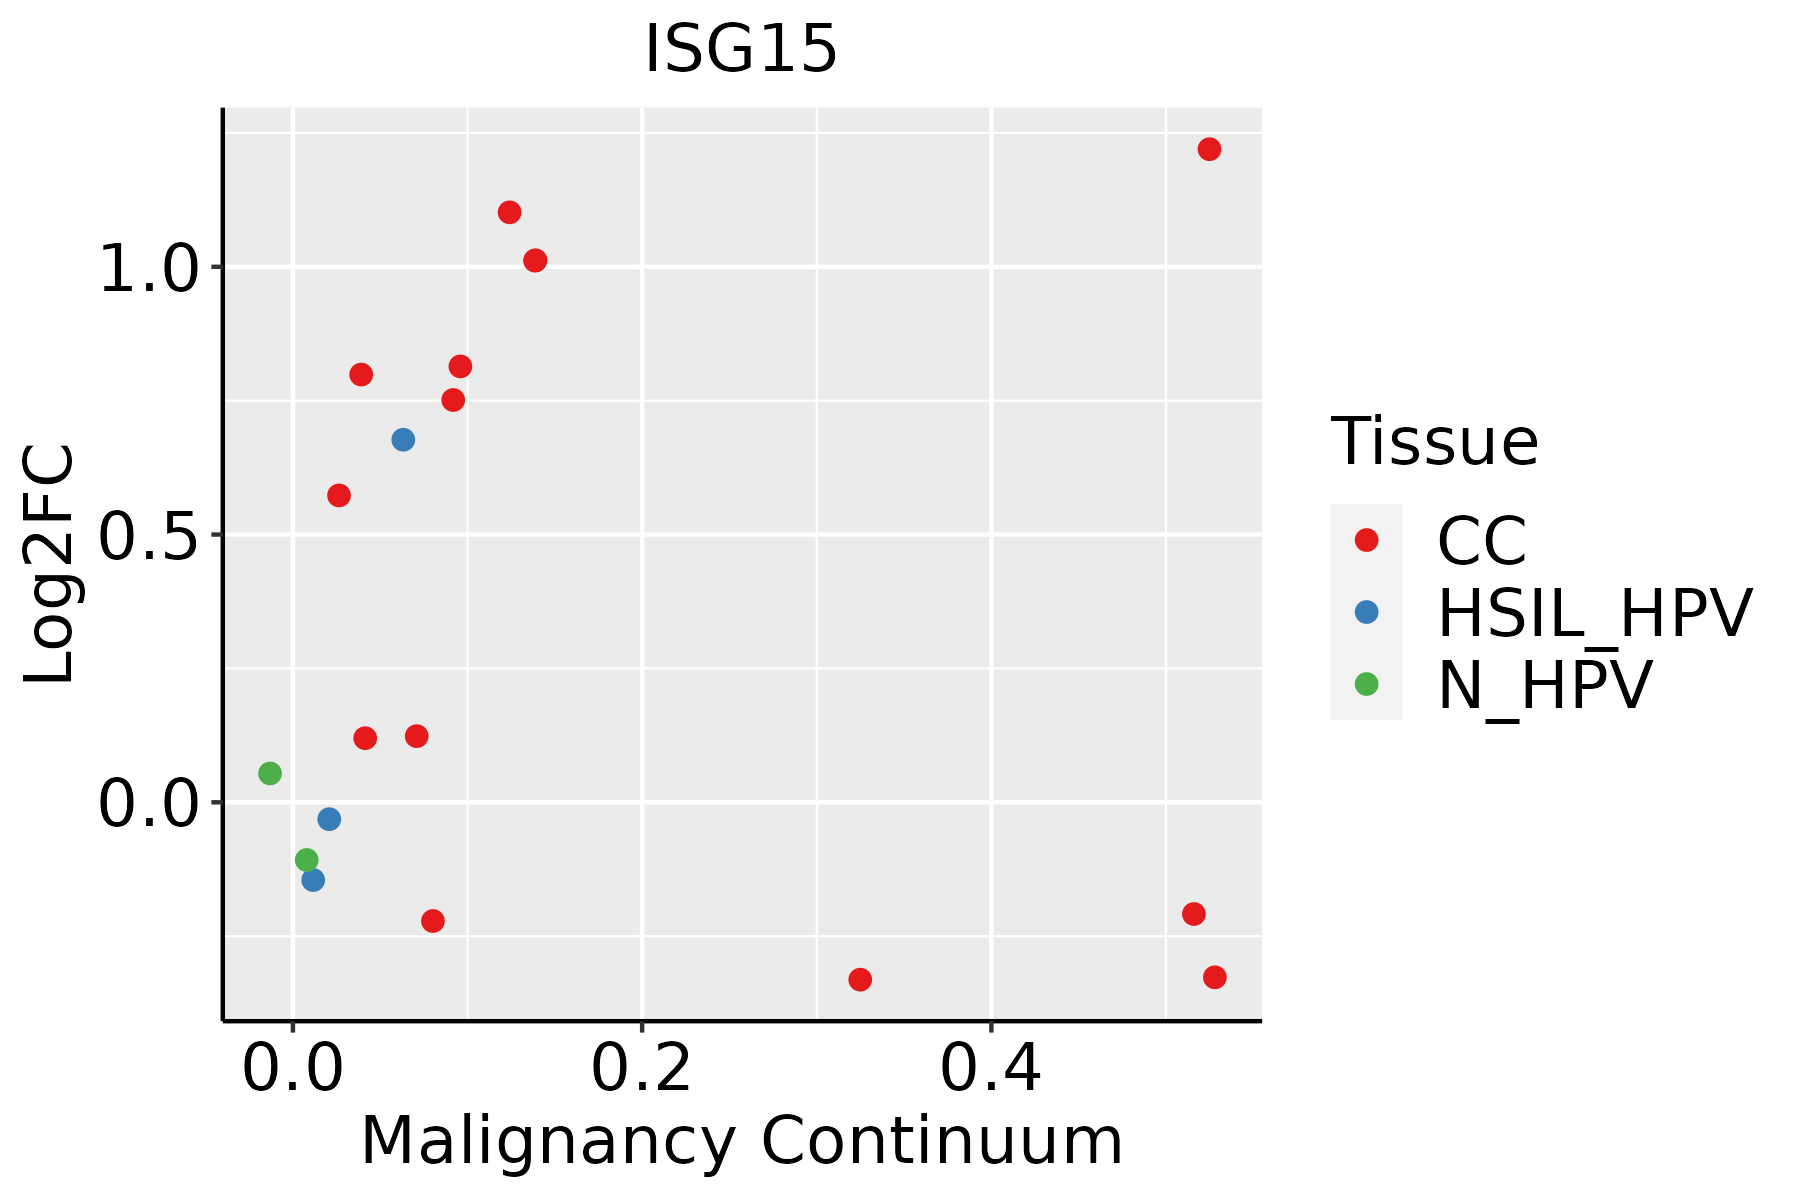 | CC: Cervix cancer |
| HSIL_HPV: HPV-infected high-grade squamous intraepithelial lesions | ||
| N_HPV: HPV-infected normal cervix | ||
| Colorectum (GSE201348) |  | FAP: Familial adenomatous polyposis |
| CRC: Colorectal cancer | ||
| Colorectum (HTA11) |  | AD: Adenomas |
| SER: Sessile serrated lesions | ||
| MSI-H: Microsatellite-high colorectal cancer | ||
| MSS: Microsatellite stable colorectal cancer | ||
| Endometrium | 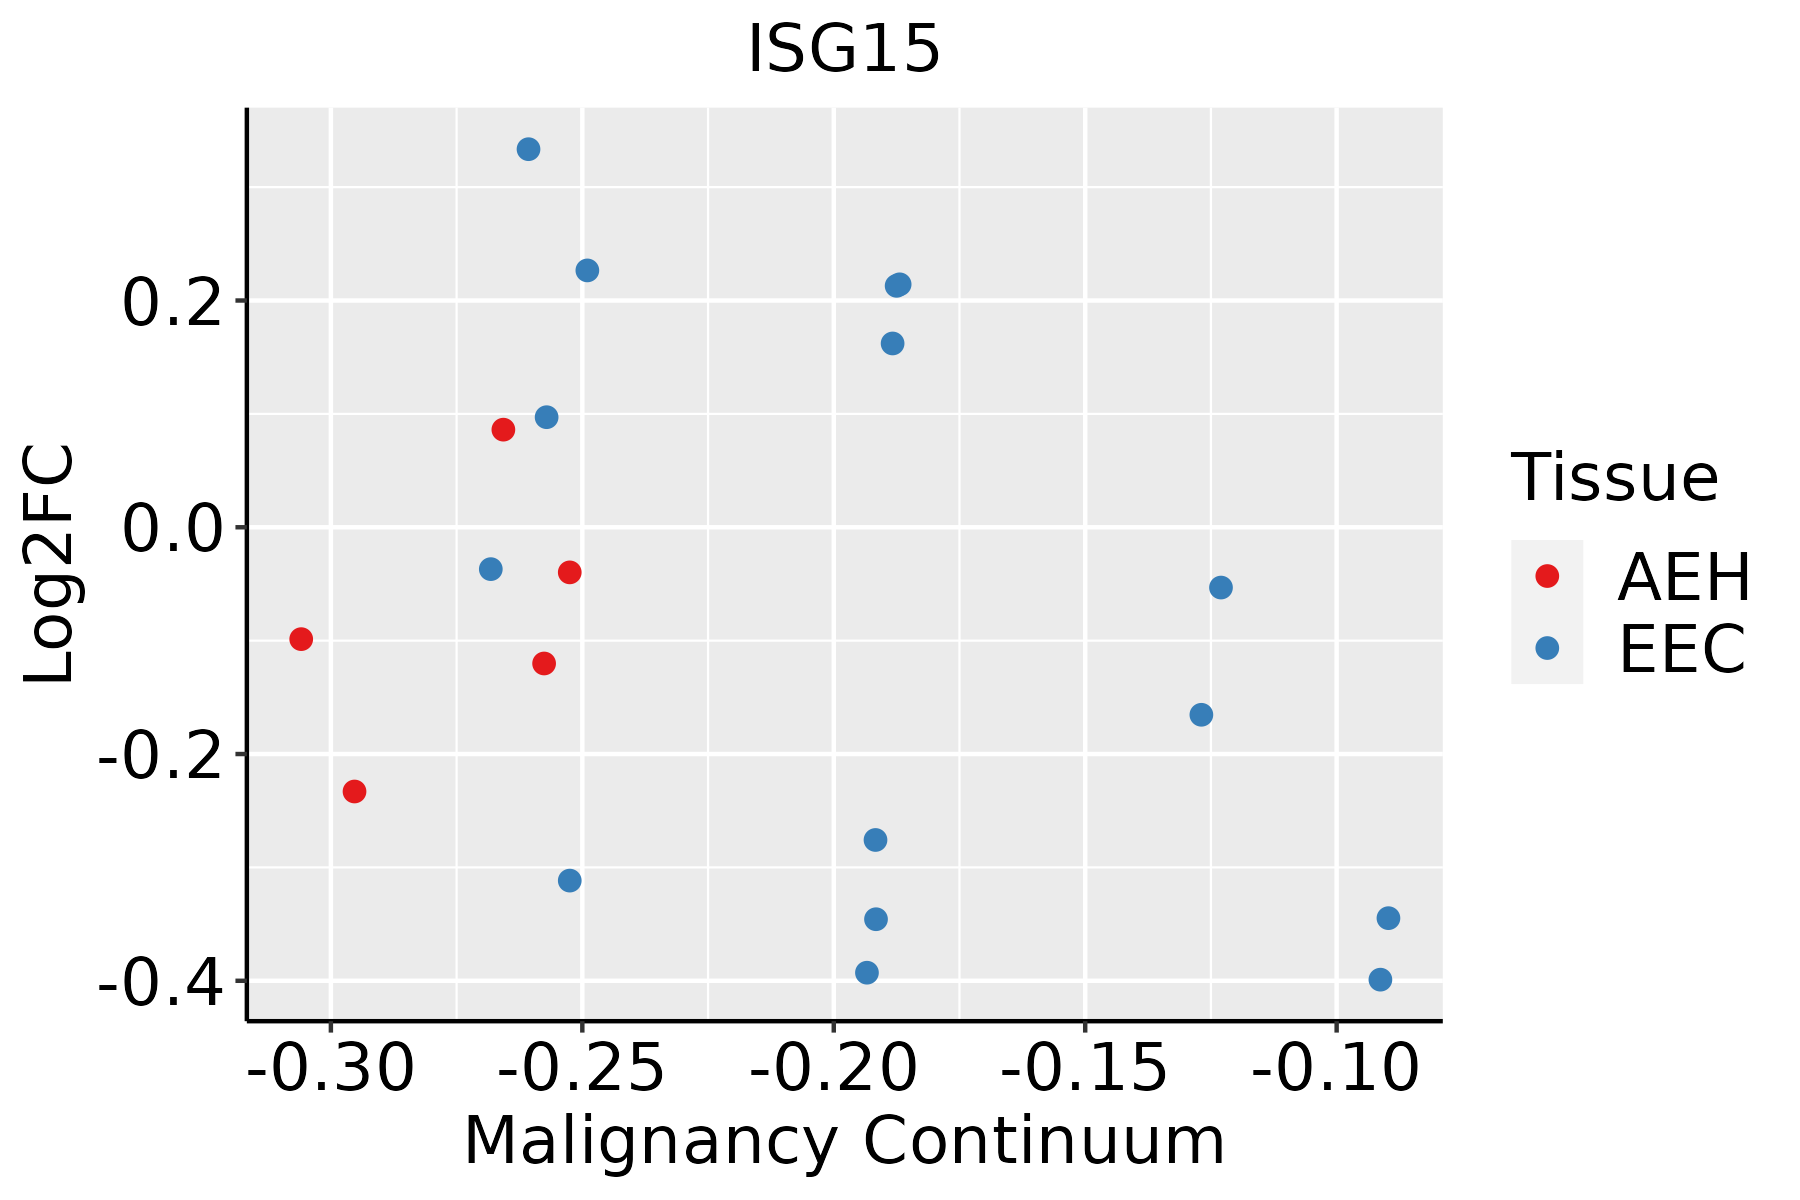 | AEH: Atypical endometrial hyperplasia |
| EEC: Endometrioid Cancer | ||
| Esophagus |  | ESCC: Esophageal squamous cell carcinoma |
| HGIN: High-grade intraepithelial neoplasias | ||
| LGIN: Low-grade intraepithelial neoplasias | ||
| GC | 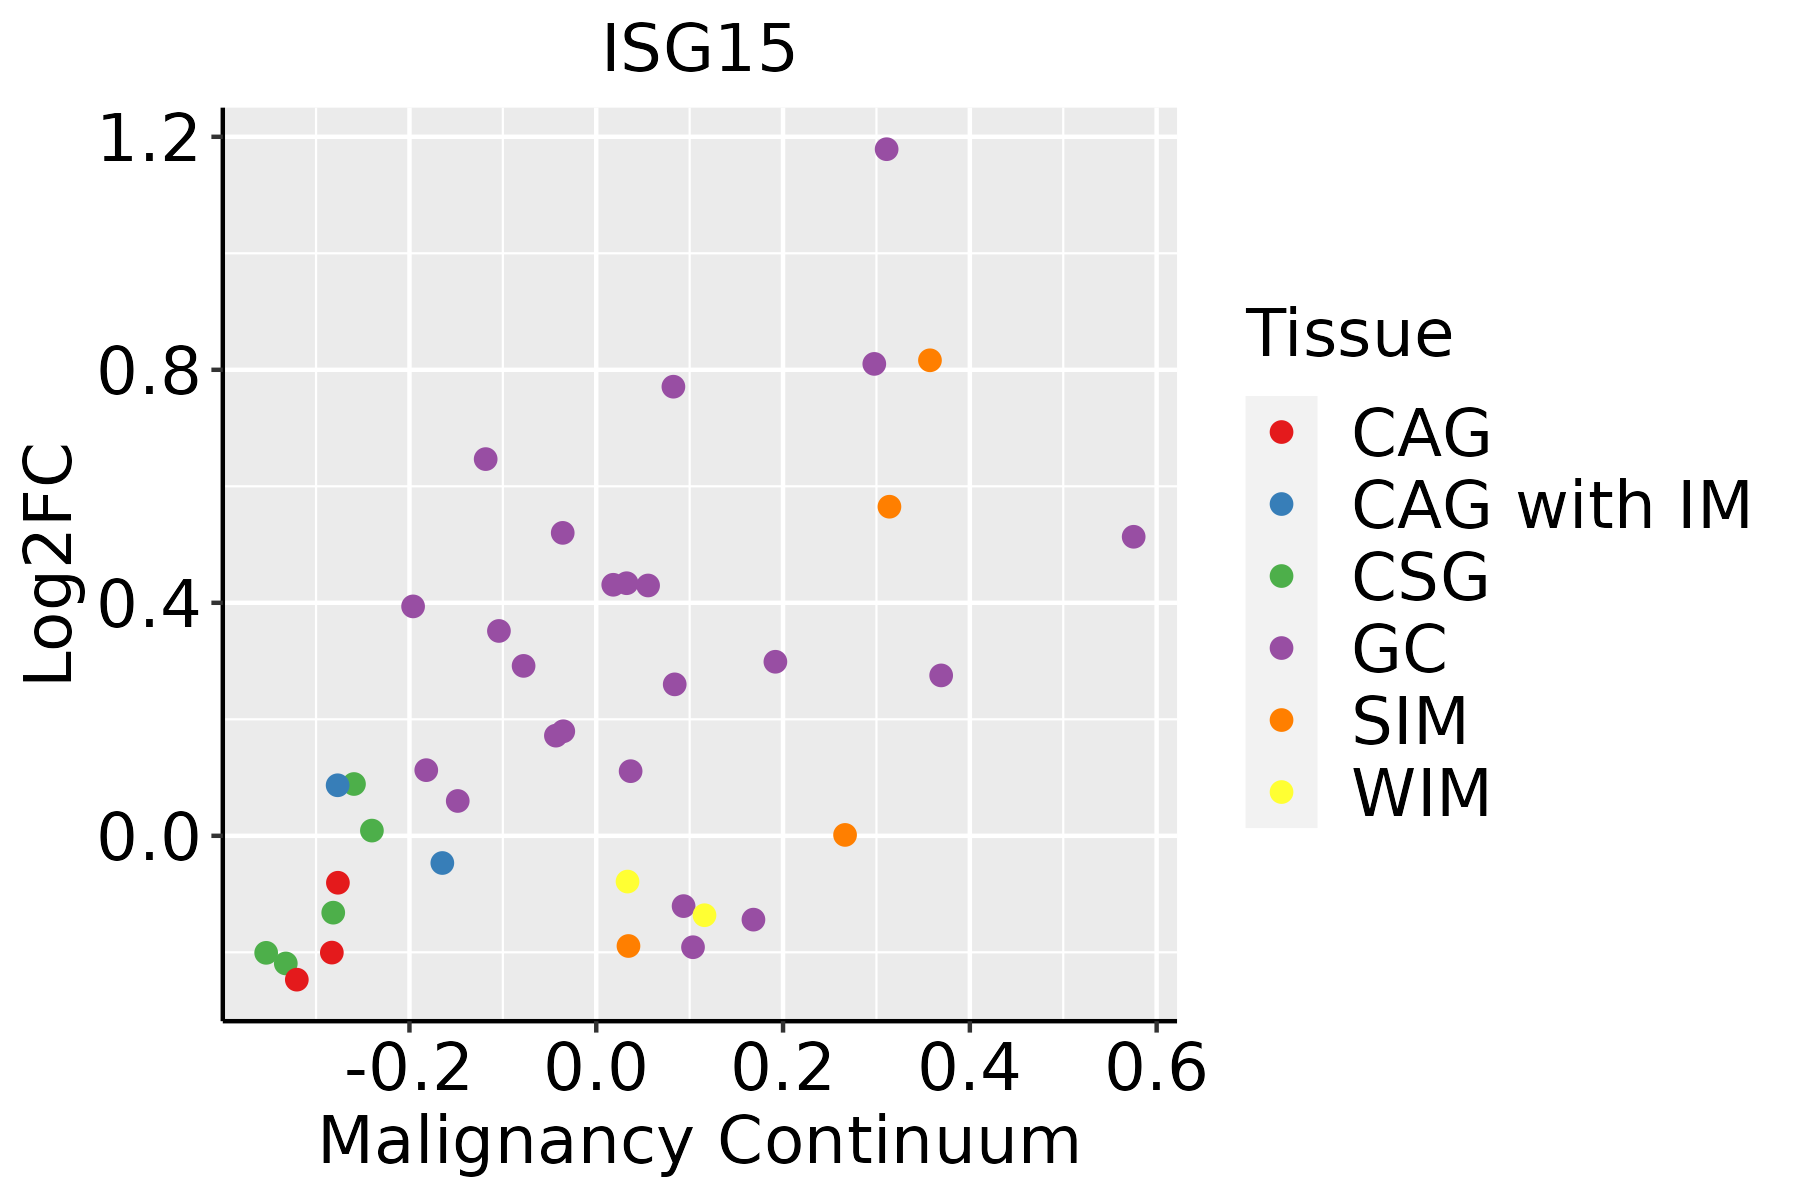 | CAG: Chronic atrophic gastritis |
| CAG with IM: Chronic atrophic gastritis with intestinal metaplasia | ||
| CSG: Chronic superficial gastritis | ||
| GC: Gastric cancer | ||
| SIM: Severe intestinal metaplasia | ||
| WIM: Wild intestinal metaplasia | ||
| Liver | 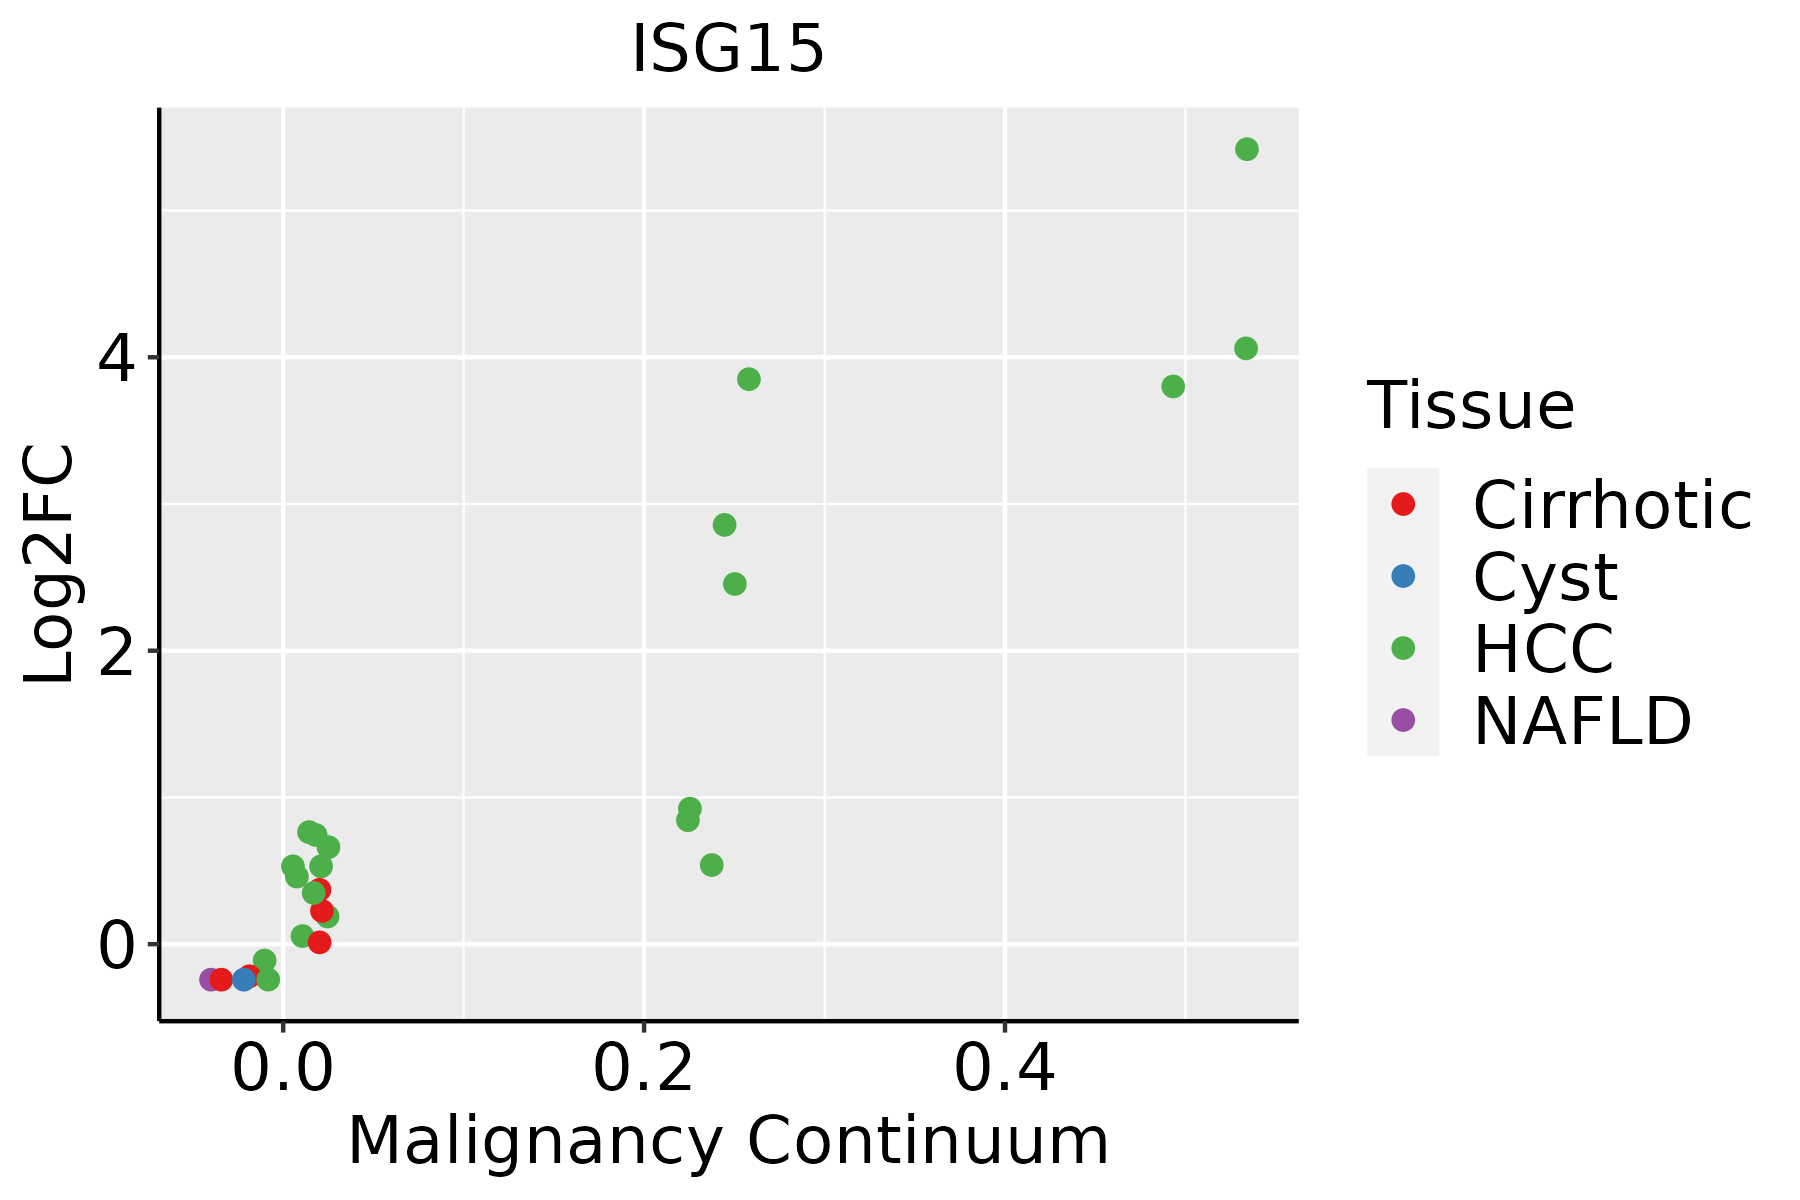 | HCC: Hepatocellular carcinoma |
| NAFLD: Non-alcoholic fatty liver disease | ||
| Oral Cavity | 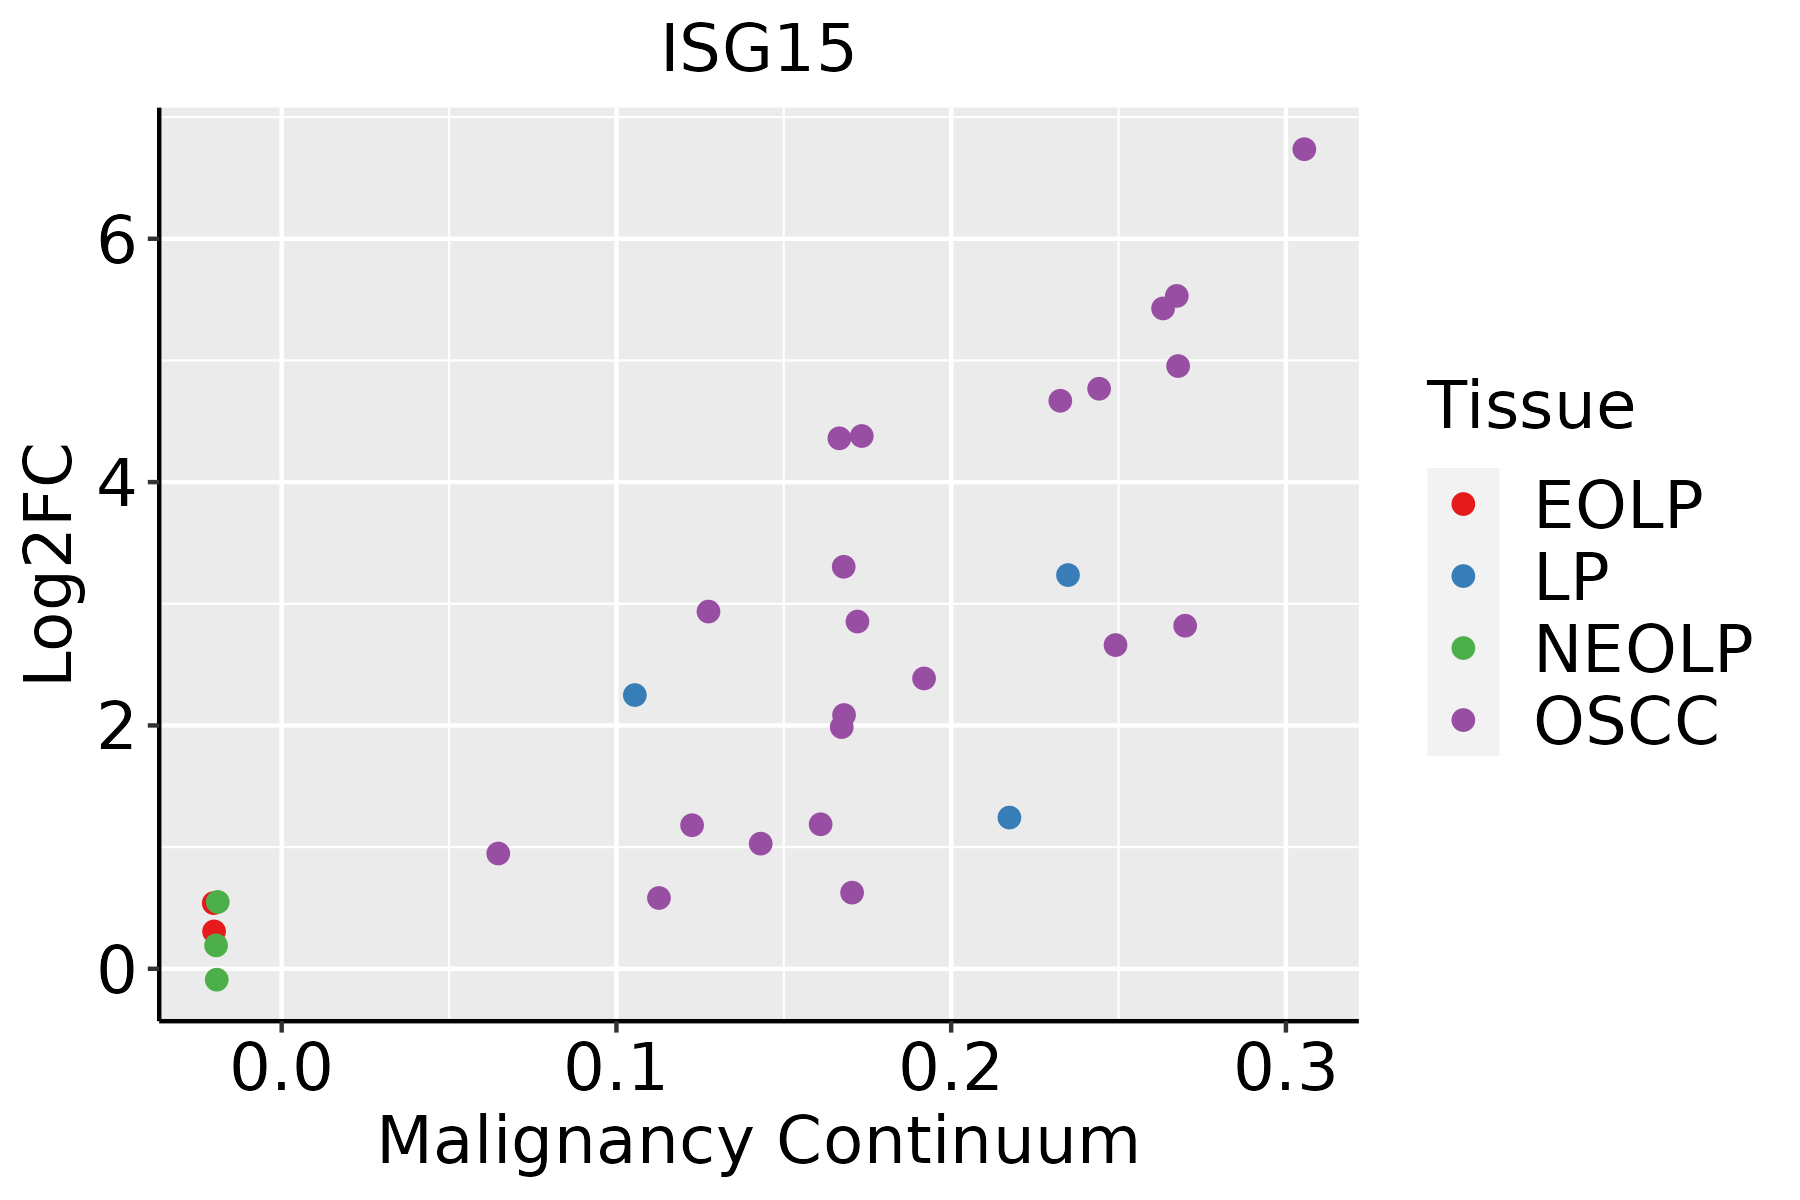 | EOLP: Erosive Oral lichen planus |
| LP: leukoplakia | ||
| NEOLP: Non-erosive oral lichen planus | ||
| OSCC: Oral squamous cell carcinoma | ||
| Prostate | 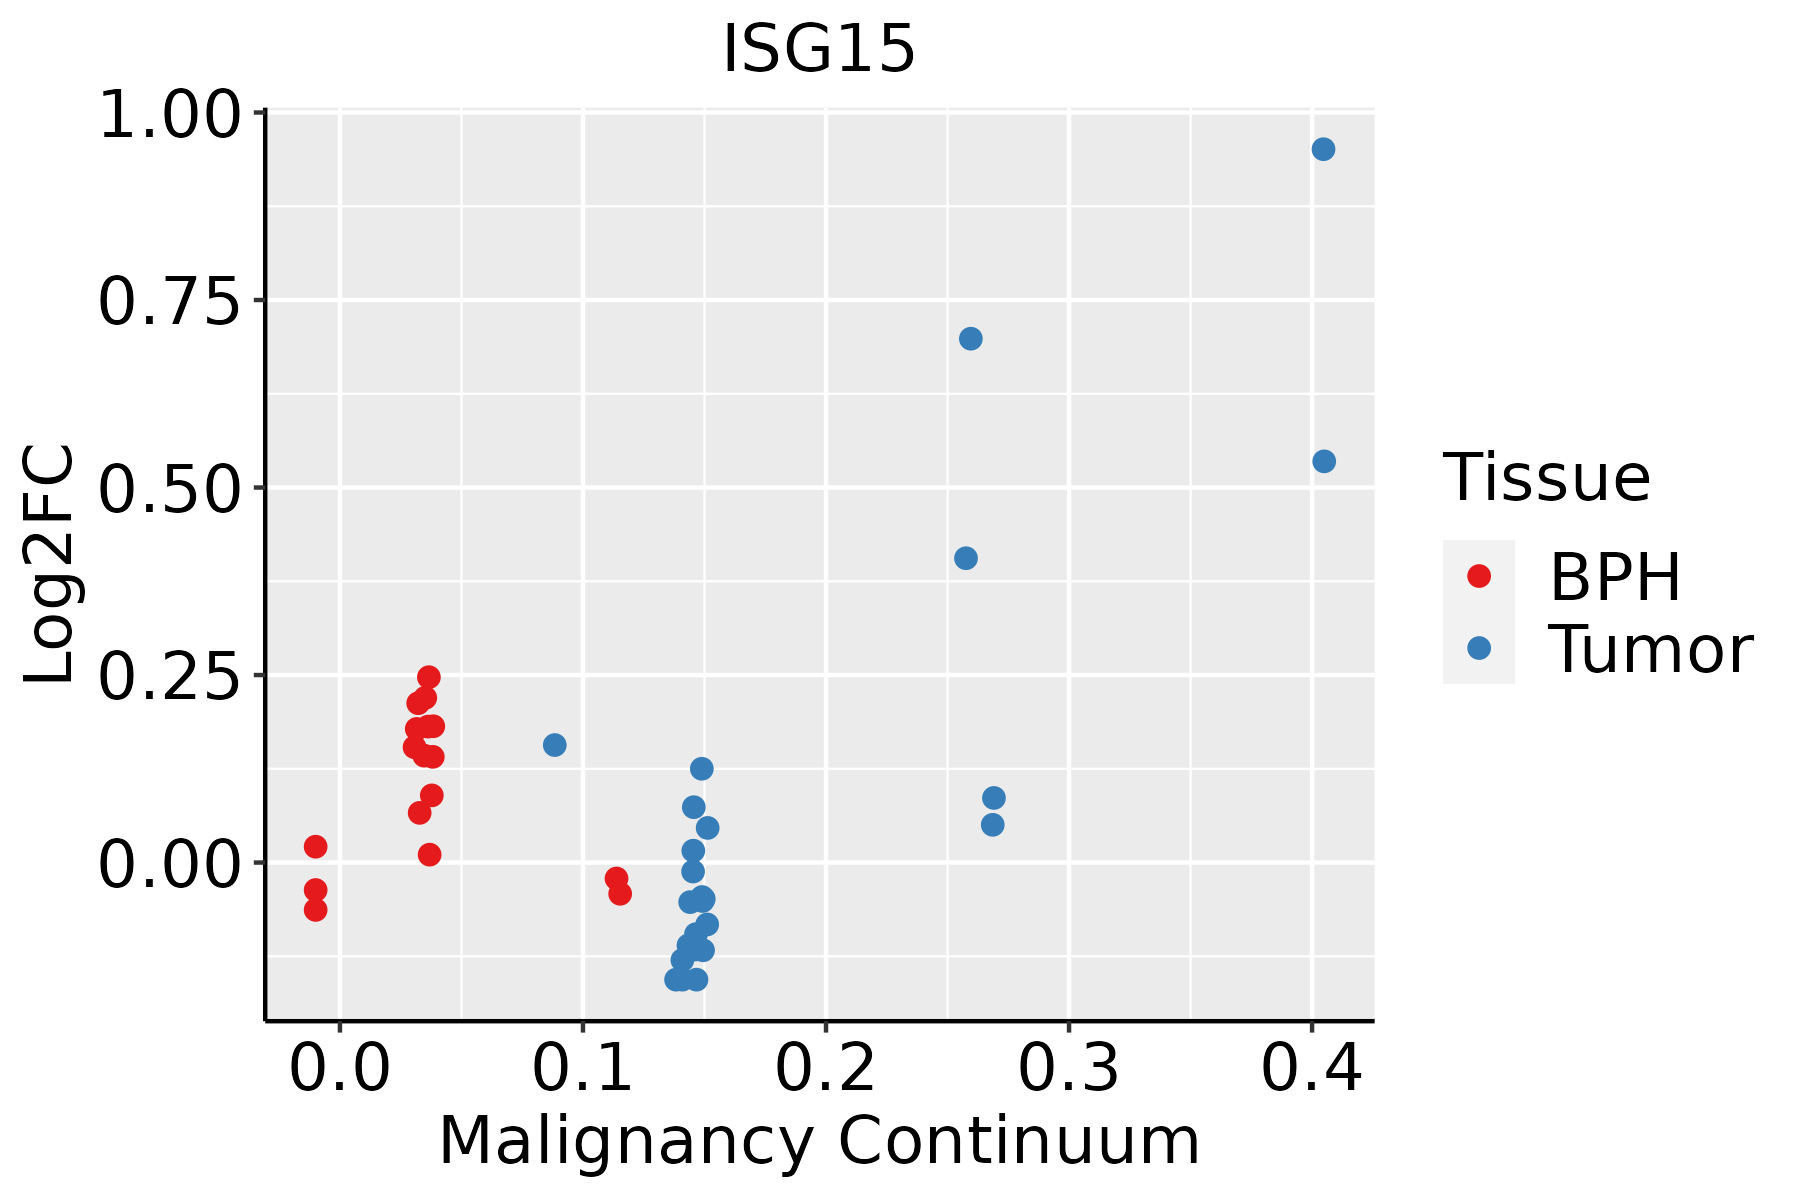 | BPH: Benign Prostatic Hyperplasia |
| Skin | 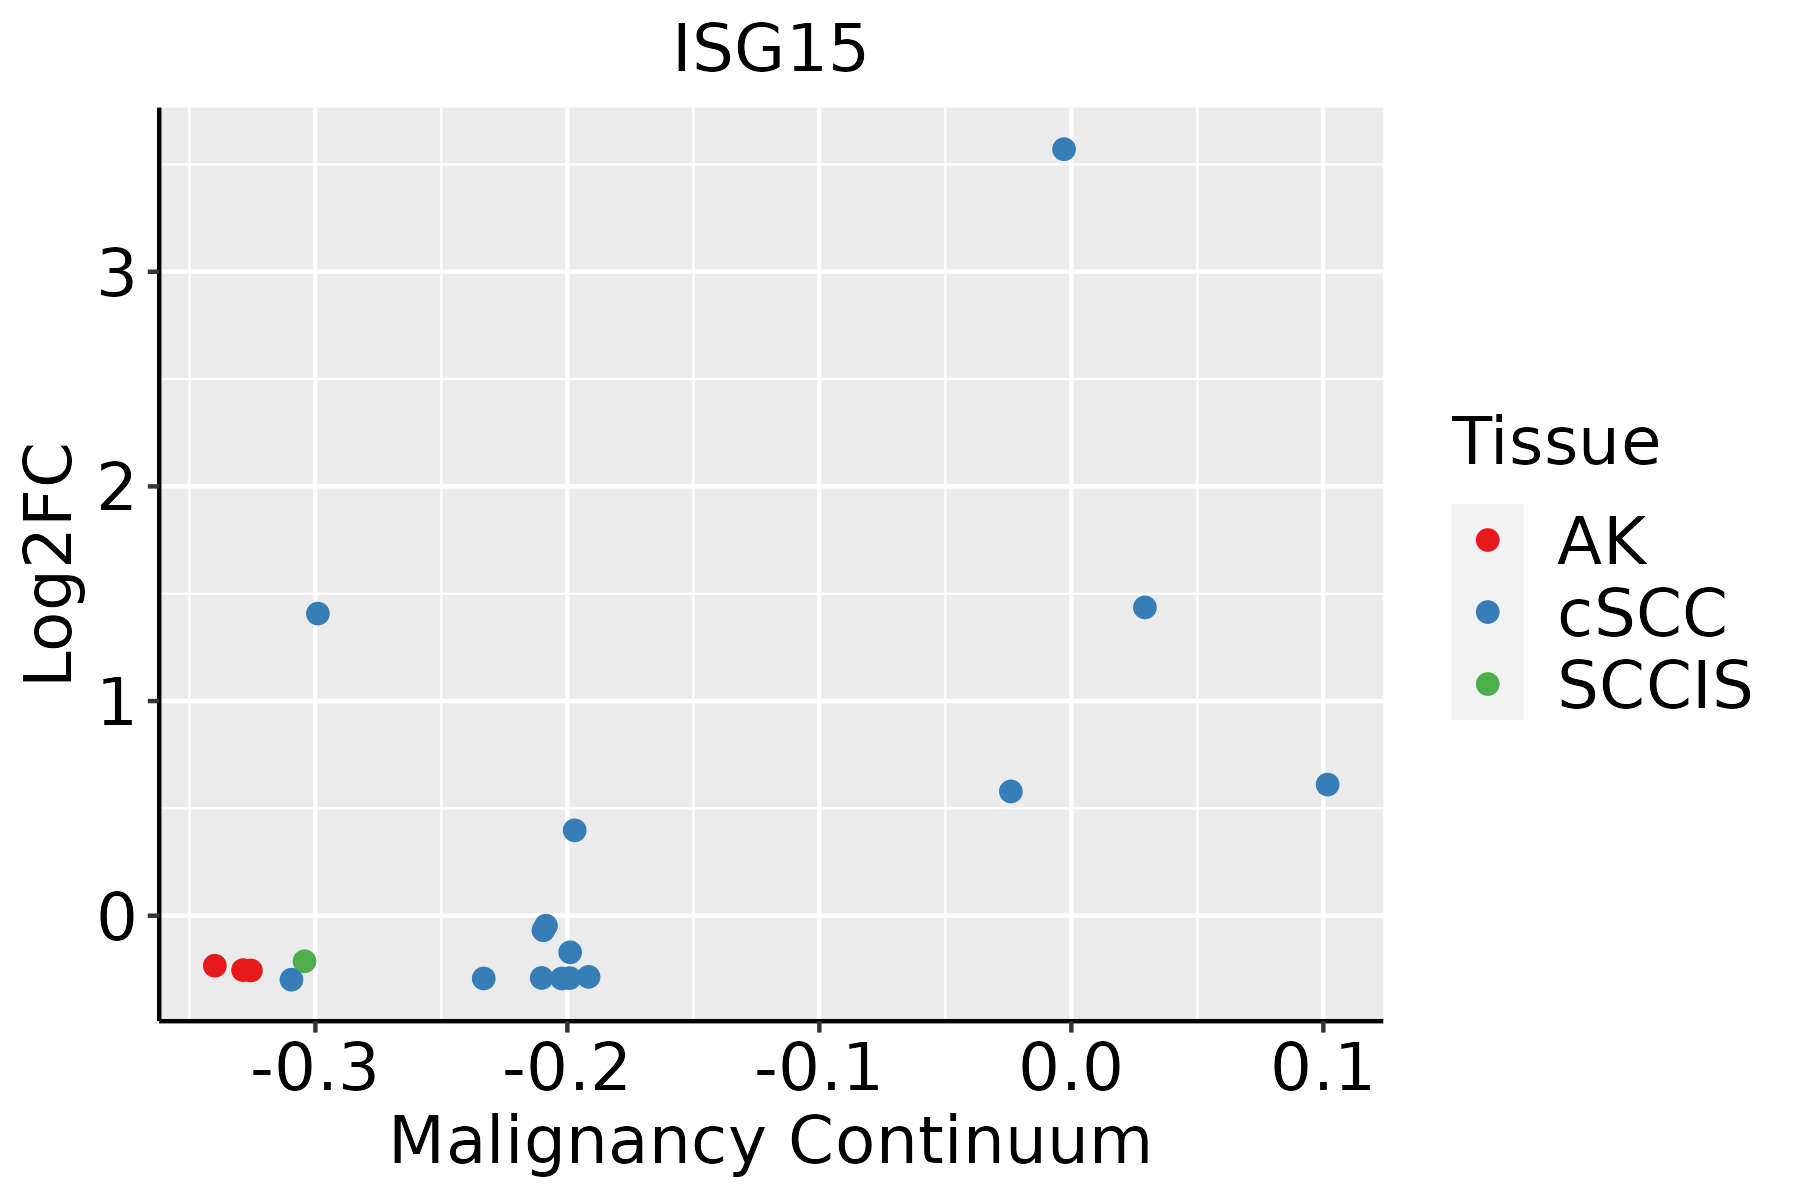 | AK: Actinic keratosis |
| cSCC: Cutaneous squamous cell carcinoma | ||
| SCCIS:squamous cell carcinoma in situ | ||
| Thyroid | 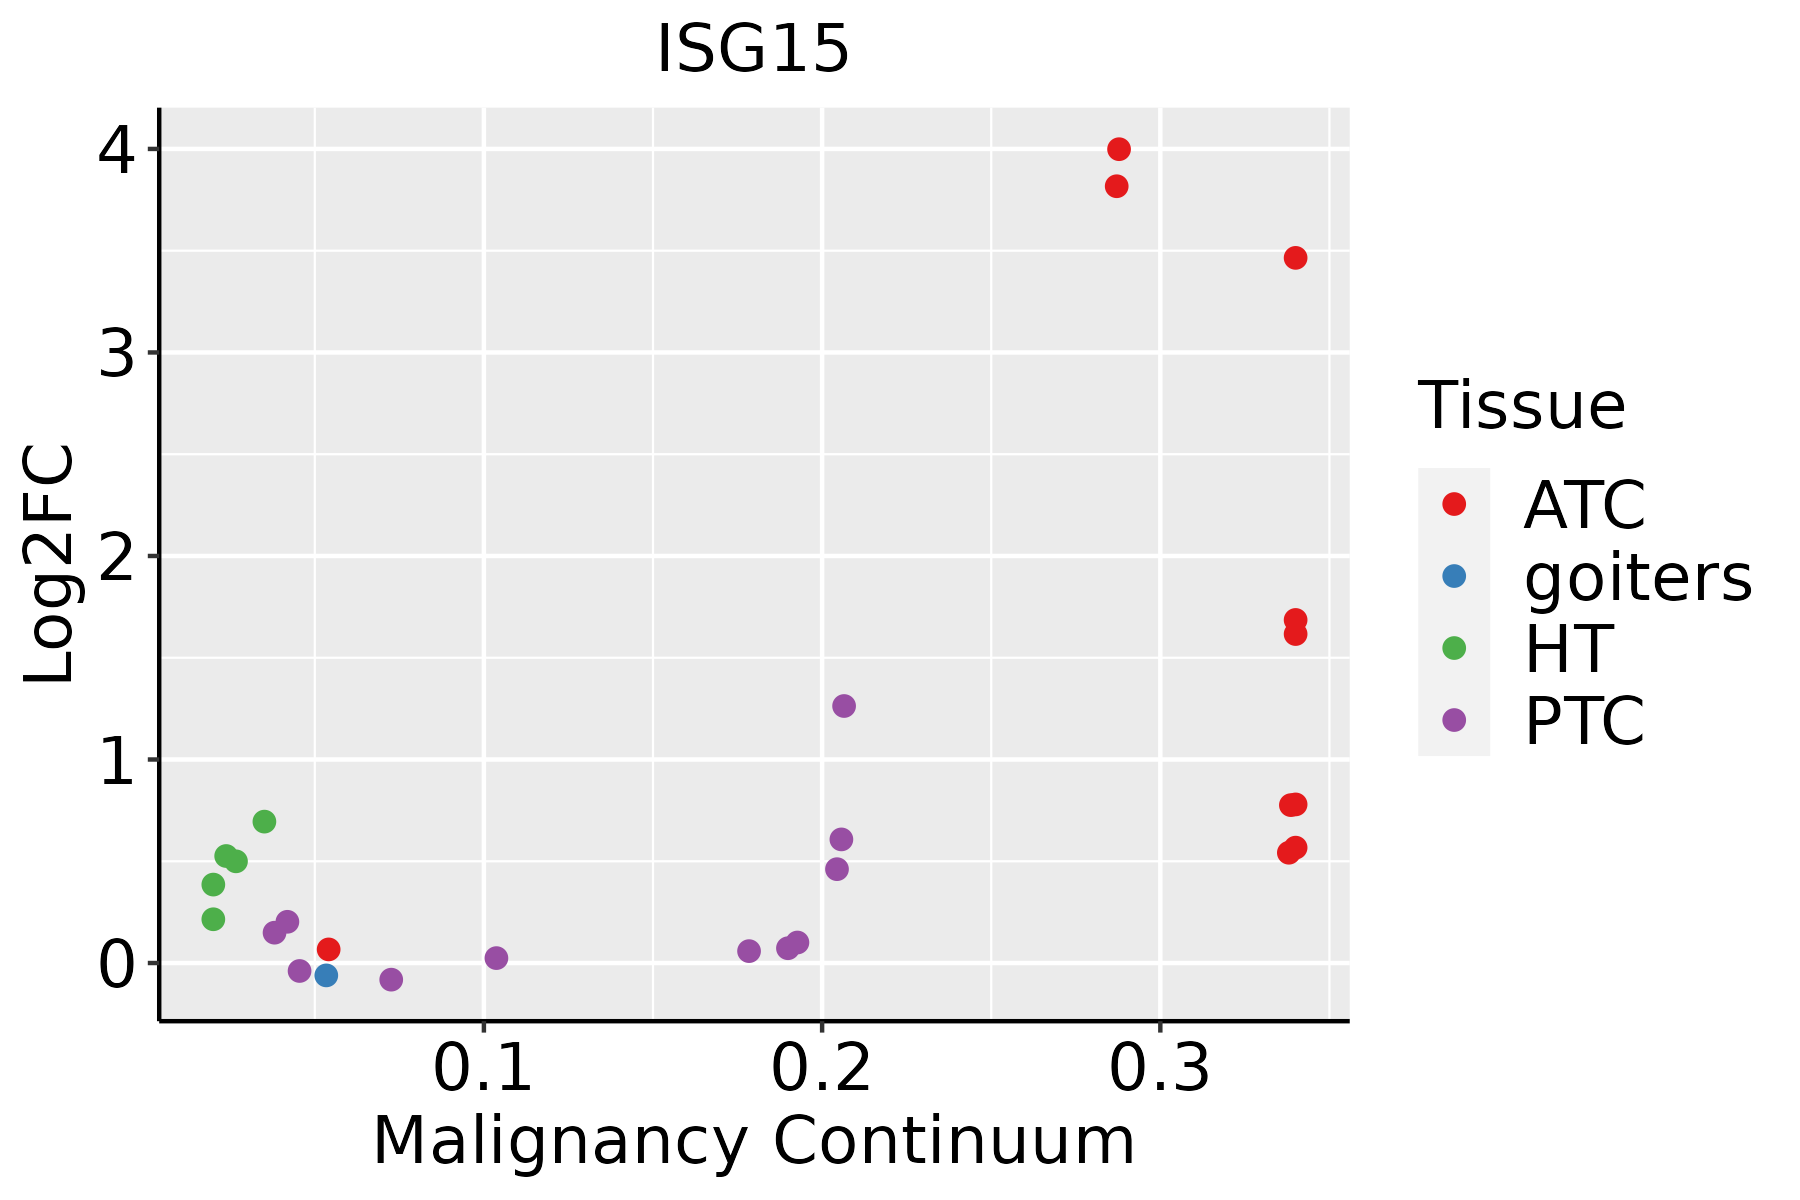 | ATC: Anaplastic thyroid cancer |
| HT: Hashimoto's thyroiditis | ||
| PTC: Papillary thyroid cancer |
| ∗log2FC in expression of this searched gene in stem-like cells from each diseased tissue sample relative to stem-like cells in normal samples in each tissue plotted against the malignancy continuum. Samples are colored based on if they are from different disease stage. |
Top |
Malignant transformation related pathway analysis |
| Find out the enriched GO biological processes and KEGG pathways involved in transition from healthy to precancer to cancer |
| Tissue | Disease Stage | Enriched GO biological Processes |
| Colorectum | AD |  |
| Colorectum | SER |  |
| Colorectum | MSS |  |
| Colorectum | MSI-H |  |
| Colorectum | FAP |  |
| ∗Top 15 enriched GO BP terms are showed in the bar plot of each disease state in each tissue. Each row represents a significant GO biological process which is colored according to the -log10(p.adjust). |
| Page: 1 2 3 4 5 6 7 8 9 |
| GO ID | Tissue | Disease Stage | Description | Gene Ratio | Bg Ratio | pvalue | p.adjust | Count |
| GO:00160329 | Breast | Precancer | viral process | 58/1080 | 415/18723 | 3.42e-10 | 3.16e-08 | 58 |
| GO:00190589 | Breast | Precancer | viral life cycle | 47/1080 | 317/18723 | 2.42e-09 | 1.99e-07 | 47 |
| GO:19033209 | Breast | Precancer | regulation of protein modification by small protein conjugation or removal | 38/1080 | 242/18723 | 1.71e-08 | 1.17e-06 | 38 |
| GO:19033219 | Breast | Precancer | negative regulation of protein modification by small protein conjugation or removal | 21/1080 | 95/18723 | 8.09e-08 | 4.61e-06 | 21 |
| GO:00313969 | Breast | Precancer | regulation of protein ubiquitination | 33/1080 | 210/18723 | 1.45e-07 | 7.82e-06 | 33 |
| GO:00313979 | Breast | Precancer | negative regulation of protein ubiquitination | 19/1080 | 83/18723 | 1.85e-07 | 9.54e-06 | 19 |
| GO:00022629 | Breast | Precancer | myeloid cell homeostasis | 27/1080 | 157/18723 | 3.10e-07 | 1.49e-05 | 27 |
| GO:00507929 | Breast | Precancer | regulation of viral process | 27/1080 | 164/18723 | 7.59e-07 | 3.05e-05 | 27 |
| GO:00341019 | Breast | Precancer | erythrocyte homeostasis | 23/1080 | 129/18723 | 1.20e-06 | 4.60e-05 | 23 |
| GO:00432549 | Breast | Precancer | regulation of protein-containing complex assembly | 50/1080 | 428/18723 | 1.63e-06 | 5.97e-05 | 50 |
| GO:00313349 | Breast | Precancer | positive regulation of protein-containing complex assembly | 33/1080 | 237/18723 | 2.39e-06 | 8.21e-05 | 33 |
| GO:00300999 | Breast | Precancer | myeloid cell differentiation | 45/1080 | 381/18723 | 4.00e-06 | 1.25e-04 | 45 |
| GO:00018196 | Breast | Precancer | positive regulation of cytokine production | 52/1080 | 467/18723 | 4.18e-06 | 1.29e-04 | 52 |
| GO:00190799 | Breast | Precancer | viral genome replication | 22/1080 | 131/18723 | 5.63e-06 | 1.66e-04 | 22 |
| GO:00705858 | Breast | Precancer | protein localization to mitochondrion | 21/1080 | 125/18723 | 9.07e-06 | 2.42e-04 | 21 |
| GO:19039009 | Breast | Precancer | regulation of viral life cycle | 23/1080 | 148/18723 | 1.31e-05 | 3.30e-04 | 23 |
| GO:00456379 | Breast | Precancer | regulation of myeloid cell differentiation | 28/1080 | 210/18723 | 3.05e-05 | 6.72e-04 | 28 |
| GO:19037069 | Breast | Precancer | regulation of hemopoiesis | 41/1080 | 367/18723 | 3.95e-05 | 8.52e-04 | 41 |
| GO:00488729 | Breast | Precancer | homeostasis of number of cells | 32/1080 | 272/18723 | 1.03e-04 | 1.89e-03 | 32 |
| GO:00302189 | Breast | Precancer | erythrocyte differentiation | 18/1080 | 120/18723 | 1.76e-04 | 2.87e-03 | 18 |
| Page: 1 2 3 4 5 6 7 8 9 10 11 12 13 14 15 16 17 18 19 20 21 22 23 24 25 26 27 28 29 30 31 32 33 34 35 36 37 38 39 40 41 42 43 44 45 46 47 48 49 50 51 52 53 54 |
| Pathway ID | Tissue | Disease Stage | Description | Gene Ratio | Bg Ratio | pvalue | p.adjust | qvalue | Count |
| hsa0517118 | Breast | Precancer | Coronavirus disease - COVID-19 | 81/684 | 232/8465 | 3.74e-32 | 2.36e-30 | 1.81e-30 | 81 |
| hsa0516918 | Breast | Precancer | Epstein-Barr virus infection | 35/684 | 202/8465 | 1.15e-05 | 1.26e-04 | 9.64e-05 | 35 |
| hsa0517119 | Breast | Precancer | Coronavirus disease - COVID-19 | 81/684 | 232/8465 | 3.74e-32 | 2.36e-30 | 1.81e-30 | 81 |
| hsa0516919 | Breast | Precancer | Epstein-Barr virus infection | 35/684 | 202/8465 | 1.15e-05 | 1.26e-04 | 9.64e-05 | 35 |
| hsa0517124 | Breast | IDC | Coronavirus disease - COVID-19 | 86/867 | 232/8465 | 1.50e-28 | 9.72e-27 | 7.27e-27 | 86 |
| hsa0516922 | Breast | IDC | Epstein-Barr virus infection | 45/867 | 202/8465 | 3.16e-07 | 6.05e-06 | 4.52e-06 | 45 |
| hsa0517134 | Breast | IDC | Coronavirus disease - COVID-19 | 86/867 | 232/8465 | 1.50e-28 | 9.72e-27 | 7.27e-27 | 86 |
| hsa0516932 | Breast | IDC | Epstein-Barr virus infection | 45/867 | 202/8465 | 3.16e-07 | 6.05e-06 | 4.52e-06 | 45 |
| hsa0517144 | Breast | DCIS | Coronavirus disease - COVID-19 | 86/846 | 232/8465 | 2.42e-29 | 1.56e-27 | 1.15e-27 | 86 |
| hsa0516941 | Breast | DCIS | Epstein-Barr virus infection | 46/846 | 202/8465 | 5.60e-08 | 1.13e-06 | 8.33e-07 | 46 |
| hsa0517154 | Breast | DCIS | Coronavirus disease - COVID-19 | 86/846 | 232/8465 | 2.42e-29 | 1.56e-27 | 1.15e-27 | 86 |
| hsa0516951 | Breast | DCIS | Epstein-Barr virus infection | 46/846 | 202/8465 | 5.60e-08 | 1.13e-06 | 8.33e-07 | 46 |
| hsa0517120 | Cervix | CC | Coronavirus disease - COVID-19 | 111/1267 | 232/8465 | 1.82e-33 | 5.90e-31 | 3.49e-31 | 111 |
| hsa0516920 | Cervix | CC | Epstein-Barr virus infection | 57/1267 | 202/8465 | 7.30e-07 | 7.39e-06 | 4.37e-06 | 57 |
| hsa051657 | Cervix | CC | Human papillomavirus infection | 74/1267 | 331/8465 | 1.70e-04 | 1.02e-03 | 6.03e-04 | 74 |
| hsa05171110 | Cervix | CC | Coronavirus disease - COVID-19 | 111/1267 | 232/8465 | 1.82e-33 | 5.90e-31 | 3.49e-31 | 111 |
| hsa05169110 | Cervix | CC | Epstein-Barr virus infection | 57/1267 | 202/8465 | 7.30e-07 | 7.39e-06 | 4.37e-06 | 57 |
| hsa0516512 | Cervix | CC | Human papillomavirus infection | 74/1267 | 331/8465 | 1.70e-04 | 1.02e-03 | 6.03e-04 | 74 |
| hsa0517125 | Cervix | HSIL_HPV | Coronavirus disease - COVID-19 | 91/459 | 232/8465 | 2.14e-56 | 3.13e-54 | 2.53e-54 | 91 |
| hsa0516923 | Cervix | HSIL_HPV | Epstein-Barr virus infection | 22/459 | 202/8465 | 1.35e-03 | 9.68e-03 | 7.82e-03 | 22 |
| Page: 1 2 3 4 5 6 |
Top |
Cell-cell communication analysis |
| Identification of potential cell-cell interactions between two cell types and their ligand-receptor pairs for different disease states |
| Ligand | Receptor | LRpair | Pathway | Tissue | Disease Stage |
| Page: 1 |
Top |
Single-cell gene regulatory network inference analysis |
| Find out the significant the regulons (TFs) and the target genes of each regulon across cell types for different disease states |
| TF | Cell Type | Tissue | Disease Stage | Target Gene | RSS | Regulon Activity |
| ∗The dot plots of a searched regulon are shown for all cell subpopulations in each disease state of each tissue based on the regulon specific score inferred using pySCENIC and by calculating the average expression. |
| Page: 1 |
Top |
Somatic mutation of malignant transformation related genes |
| Annotation of somatic variants for genes involved in malignant transformation |
| Hugo Symbol | Variant Class | Variant Classification | dbSNP RS | HGVSc | HGVSp | HGVSp Short | SWISSPROT | BIOTYPE | SIFT | PolyPhen | Tumor Sample Barcode | Tissue | Histology | Sex | Age | Stage | Therapy Types | Drugs | Outcome |
| ISG15 | SNV | Missense_Mutation | rs752866829 | c.109N>A | p.Gly37Ser | p.G37S | P05161 | protein_coding | deleterious(0.04) | benign(0.283) | TCGA-AD-A5EJ-01 | Colorectum | colon adenocarcinoma | Female | >=65 | I/II | Unknown | Unknown | SD |
| ISG15 | SNV | Missense_Mutation | c.131N>T | p.Arg44Leu | p.R44L | P05161 | protein_coding | tolerated(0.06) | benign(0.123) | TCGA-D5-6920-01 | Colorectum | colon adenocarcinoma | Female | >=65 | I/II | Unknown | Unknown | SD | |
| ISG15 | SNV | Missense_Mutation | rs368865539 | c.275N>A | p.Arg92His | p.R92H | P05161 | protein_coding | tolerated(0.13) | benign(0.115) | TCGA-AP-A1DK-01 | Endometrium | uterine corpus endometrioid carcinoma | Female | <65 | I/II | Unknown | Unknown | SD |
| ISG15 | SNV | Missense_Mutation | c.178N>A | p.Leu60Ile | p.L60I | P05161 | protein_coding | deleterious(0.01) | probably_damaging(0.999) | TCGA-BS-A0UL-01 | Endometrium | uterine corpus endometrioid carcinoma | Female | <65 | I/II | Unknown | Unknown | SD | |
| ISG15 | SNV | Missense_Mutation | rs148041041 | c.131N>A | p.Arg44His | p.R44H | P05161 | protein_coding | tolerated(0.1) | probably_damaging(0.952) | TCGA-EC-A24G-01 | Endometrium | uterine corpus endometrioid carcinoma | Female | <65 | I/II | Chemotherapy | doxorubicin | SD |
| ISG15 | deletion | Frame_Shift_Del | novel | c.411delN | p.Glu139SerfsTer7 | p.E139Sfs*7 | P05161 | protein_coding | TCGA-SL-A6JA-01 | Endometrium | uterine corpus endometrioid carcinoma | Female | >=65 | I/II | Unknown | Unknown | SD | ||
| ISG15 | SNV | Missense_Mutation | novel | c.464G>T | p.Arg155Leu | p.R155L | P05161 | protein_coding | deleterious(0) | probably_damaging(0.949) | TCGA-55-6981-01 | Lung | lung adenocarcinoma | Female | <65 | III/IV | Chemotherapy | chemo | CR |
| ISG15 | SNV | Missense_Mutation | rs748078443 | c.202G>A | p.Gly68Ser | p.G68S | P05161 | protein_coding | tolerated(0.14) | possibly_damaging(0.588) | TCGA-34-5928-01 | Lung | lung squamous cell carcinoma | Female | >=65 | I/II | Unknown | Unknown | SD |
| Page: 1 |
Top |
Related drugs of malignant transformation related genes |
| Identification of chemicals and drugs interact with genes involved in malignant transfromation |
| (DGIdb 4.0) |
| Entrez ID | Symbol | Category | Interaction Types | Drug Claim Name | Drug Name | PMIDs |
| 9636 | ISG15 | ENZYME, DRUGGABLE GENOME | inhibitor | IRINOTECAN | IRINOTECAN |
| Page: 1 |

Copyright 2023-Present -The University of Texas Health Science Center at Houston |