
|
|||||
|
 | |
| |
| |
| |
| |
| |
|
Gene: HIST3H2A |
Gene summary for HIST3H2A |
| Gene information | Species | Human | Gene symbol | HIST3H2A | Gene ID | 92815 |
| Gene name | H2A.W histone | |
| Gene Alias | HIST3H2A | |
| Cytomap | 1q42.13 | |
| Gene Type | protein-coding | GO ID | GO:0006139 | UniProtAcc | Q7L7L0 |
Top |
Malignant transformation analysis |
| Identification of the aberrant gene expression in precancerous and cancerous lesions by comparing the gene expression of stem-like cells in diseased tissues with normal stem cells |
| Entrez ID | Symbol | Replicates | Species | Organ | Tissue | Adj P-value | Log2FC | Malignancy |
| 92815 | HIST3H2A | P65T-E | Human | Esophagus | ESCC | 7.36e-26 | 7.68e-01 | 0.0978 |
| 92815 | HIST3H2A | P74T-E | Human | Esophagus | ESCC | 7.47e-40 | 1.47e+00 | 0.1479 |
| 92815 | HIST3H2A | P75T-E | Human | Esophagus | ESCC | 8.96e-49 | 1.19e+00 | 0.1125 |
| 92815 | HIST3H2A | P76T-E | Human | Esophagus | ESCC | 2.11e-34 | 8.94e-01 | 0.1207 |
| 92815 | HIST3H2A | P79T-E | Human | Esophagus | ESCC | 8.26e-44 | 1.25e+00 | 0.1154 |
| 92815 | HIST3H2A | P80T-E | Human | Esophagus | ESCC | 8.91e-32 | 1.15e+00 | 0.155 |
| 92815 | HIST3H2A | P82T-E | Human | Esophagus | ESCC | 1.29e-22 | 1.67e+00 | 0.1072 |
| 92815 | HIST3H2A | P83T-E | Human | Esophagus | ESCC | 8.36e-41 | 2.04e+00 | 0.1738 |
| 92815 | HIST3H2A | P84T-E | Human | Esophagus | ESCC | 9.31e-15 | 1.78e+00 | 0.0933 |
| 92815 | HIST3H2A | P89T-E | Human | Esophagus | ESCC | 6.70e-24 | 2.07e+00 | 0.1752 |
| 92815 | HIST3H2A | P91T-E | Human | Esophagus | ESCC | 1.24e-10 | 1.30e+00 | 0.1828 |
| 92815 | HIST3H2A | P107T-E | Human | Esophagus | ESCC | 1.39e-31 | 1.17e+00 | 0.171 |
| 92815 | HIST3H2A | P126T-E | Human | Esophagus | ESCC | 3.22e-07 | 1.17e+00 | 0.1125 |
| 92815 | HIST3H2A | P127T-E | Human | Esophagus | ESCC | 3.55e-22 | 7.46e-01 | 0.0826 |
| 92815 | HIST3H2A | P128T-E | Human | Esophagus | ESCC | 1.67e-27 | 1.09e+00 | 0.1241 |
| 92815 | HIST3H2A | P130T-E | Human | Esophagus | ESCC | 2.30e-53 | 1.59e+00 | 0.1676 |
| 92815 | HIST3H2A | HCC2_Meng | Human | Liver | HCC | 1.95e-06 | 3.79e-02 | 0.0107 |
| 92815 | HIST3H2A | S014 | Human | Liver | HCC | 3.67e-16 | 7.28e-01 | 0.2254 |
| 92815 | HIST3H2A | S015 | Human | Liver | HCC | 9.55e-16 | 6.70e-01 | 0.2375 |
| 92815 | HIST3H2A | S016 | Human | Liver | HCC | 2.21e-12 | 8.28e-01 | 0.2243 |
| Page: 1 2 3 4 5 |
| Tissue | Expression Dynamics | Abbreviation |
| Breast | 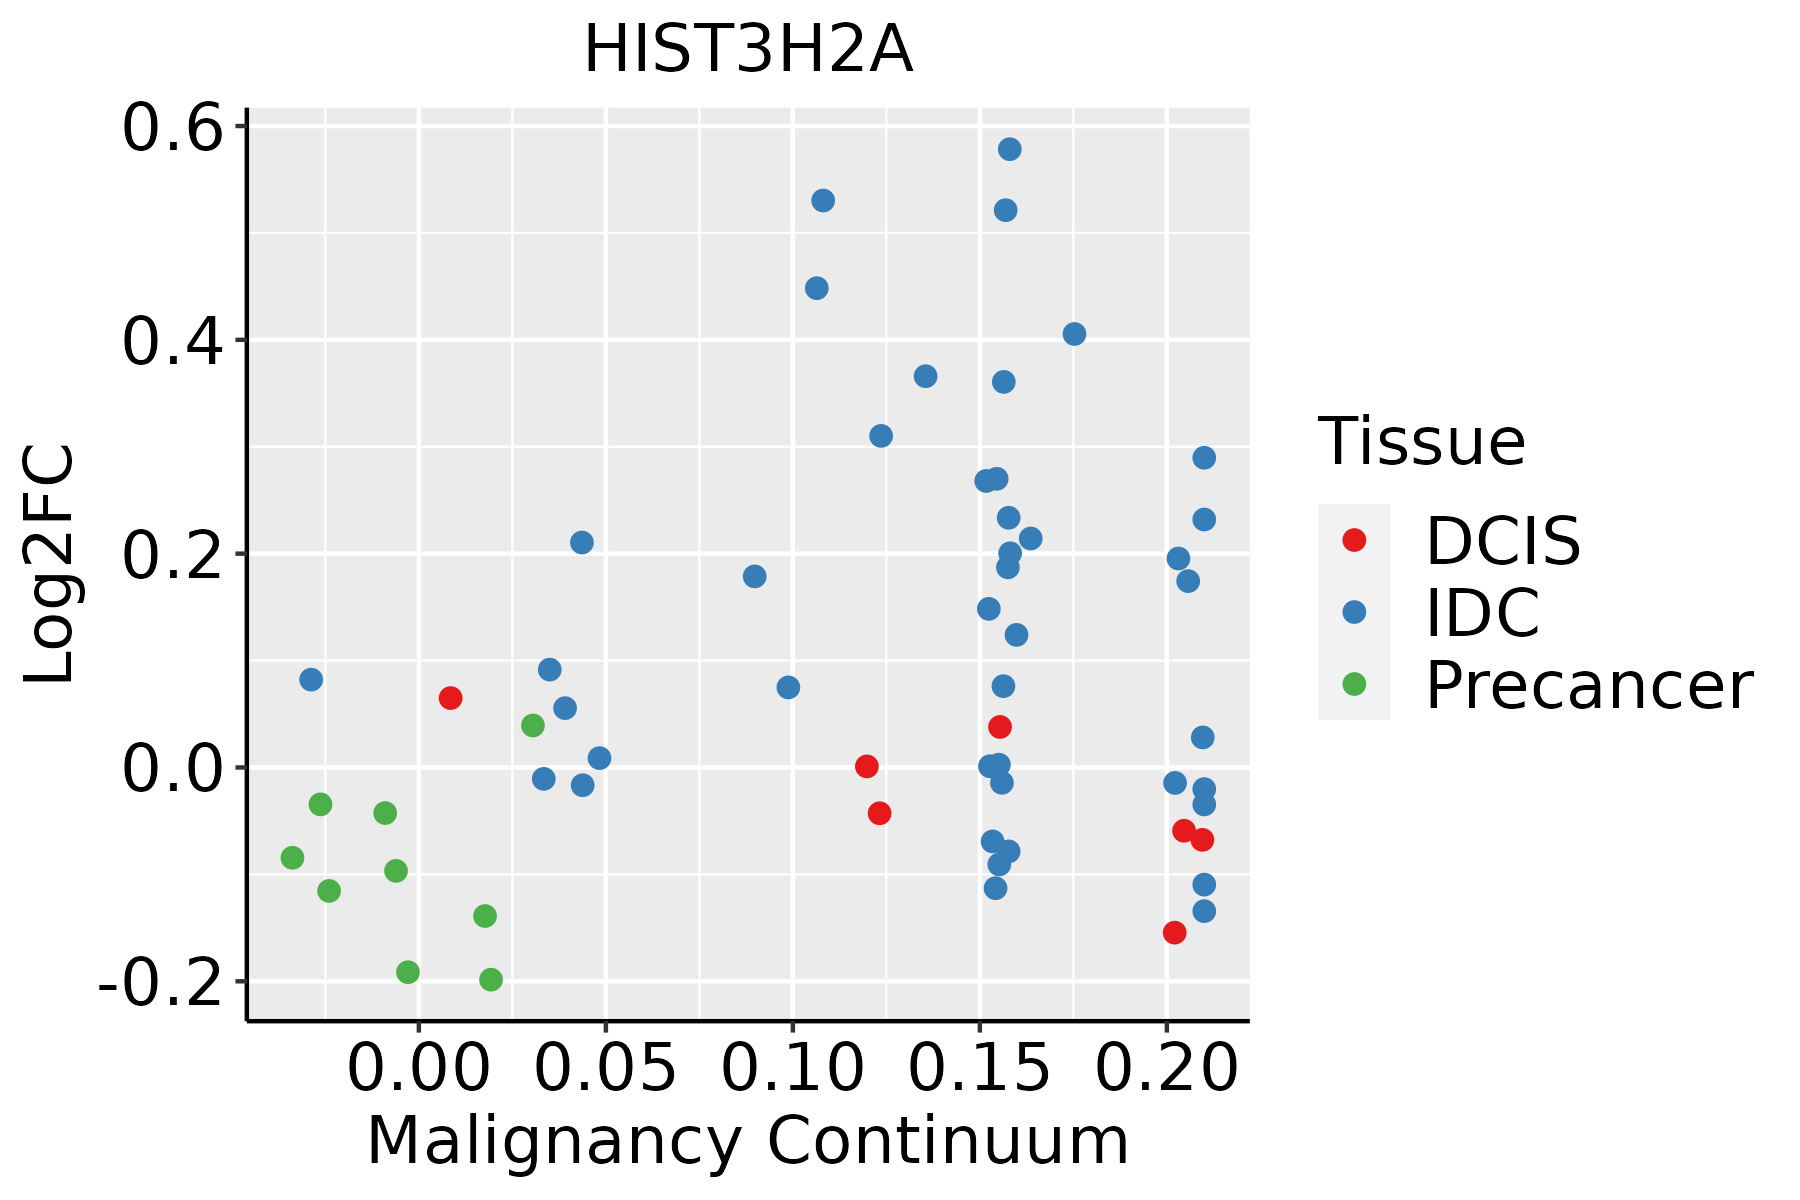 | IDC: Invasive ductal carcinoma |
| DCIS: Ductal carcinoma in situ | ||
| Precancer(BRCA1-mut): Precancerous lesion from BRCA1 mutation carriers | ||
| Esophagus | 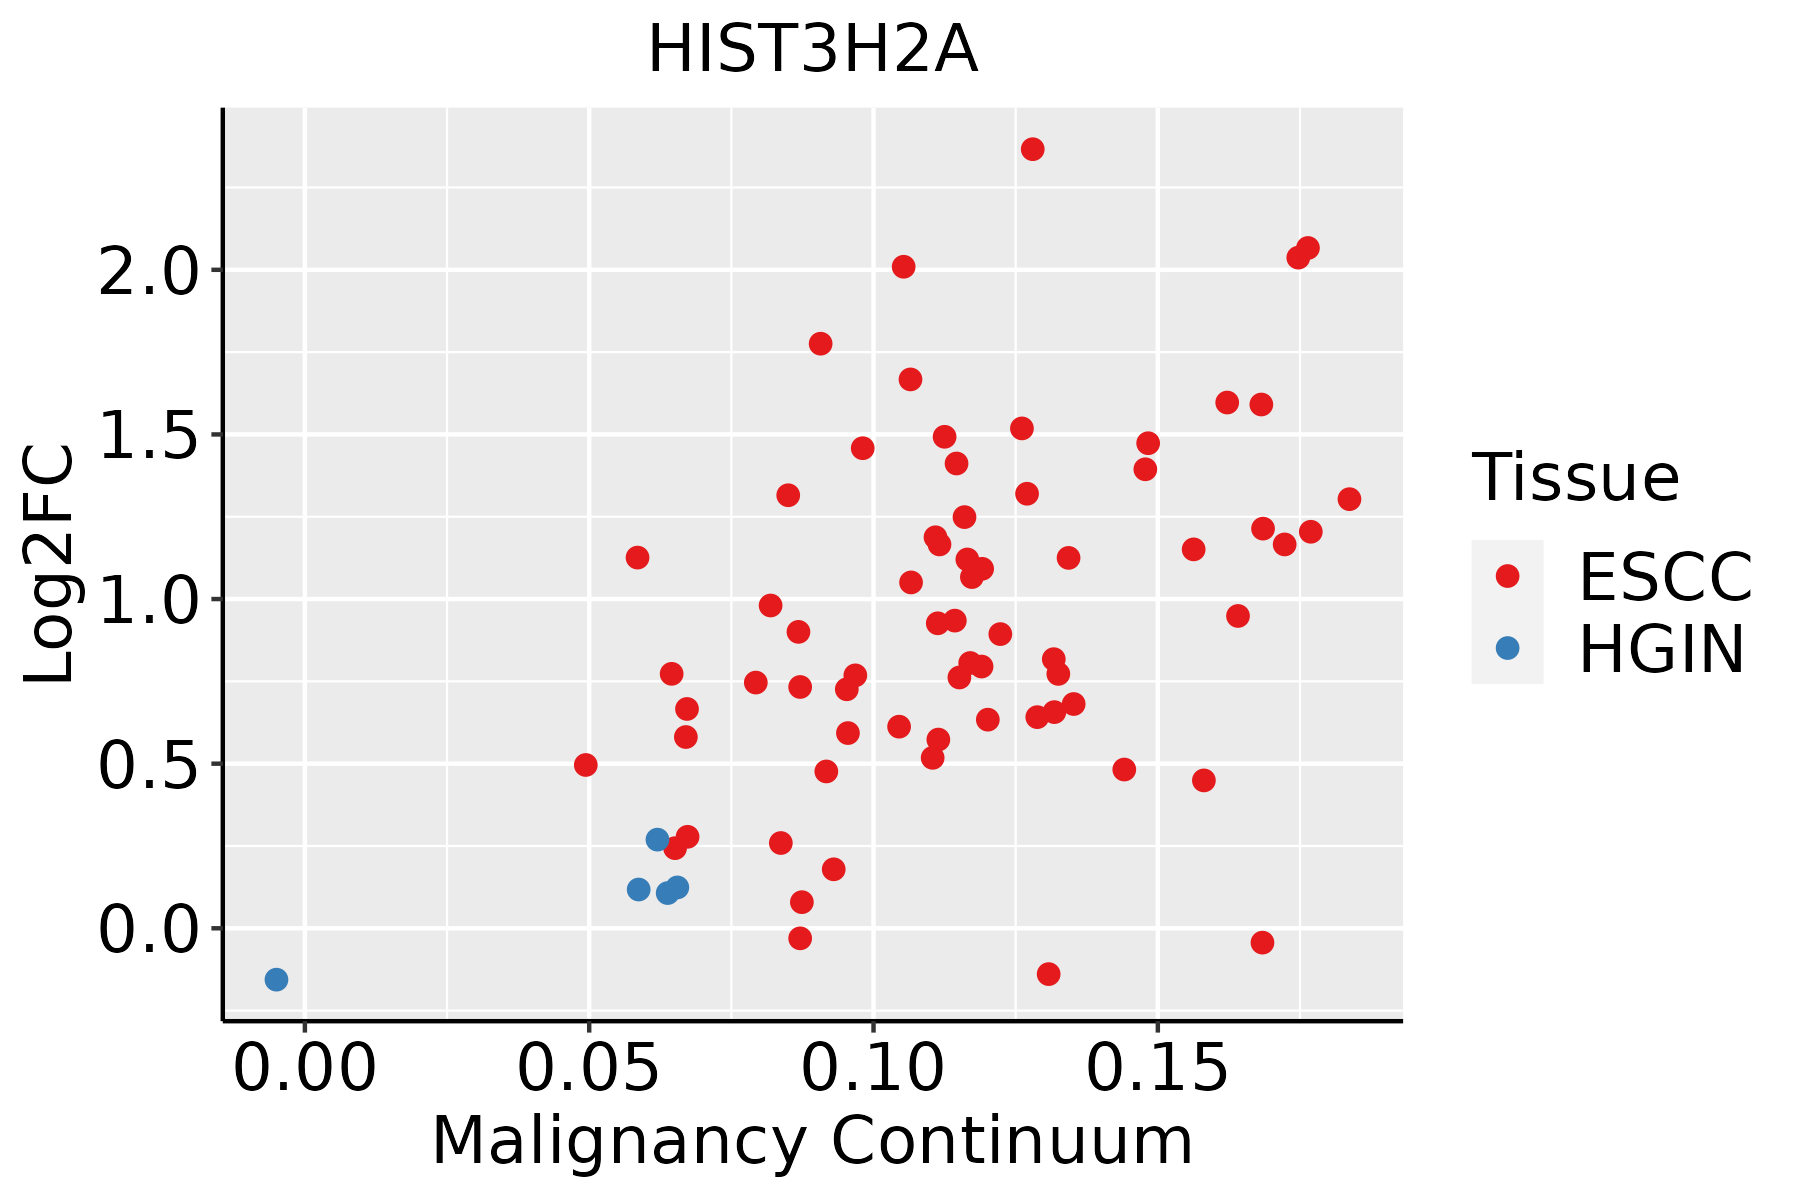 | ESCC: Esophageal squamous cell carcinoma |
| HGIN: High-grade intraepithelial neoplasias | ||
| LGIN: Low-grade intraepithelial neoplasias | ||
| Liver |  | HCC: Hepatocellular carcinoma |
| NAFLD: Non-alcoholic fatty liver disease | ||
| Oral Cavity | 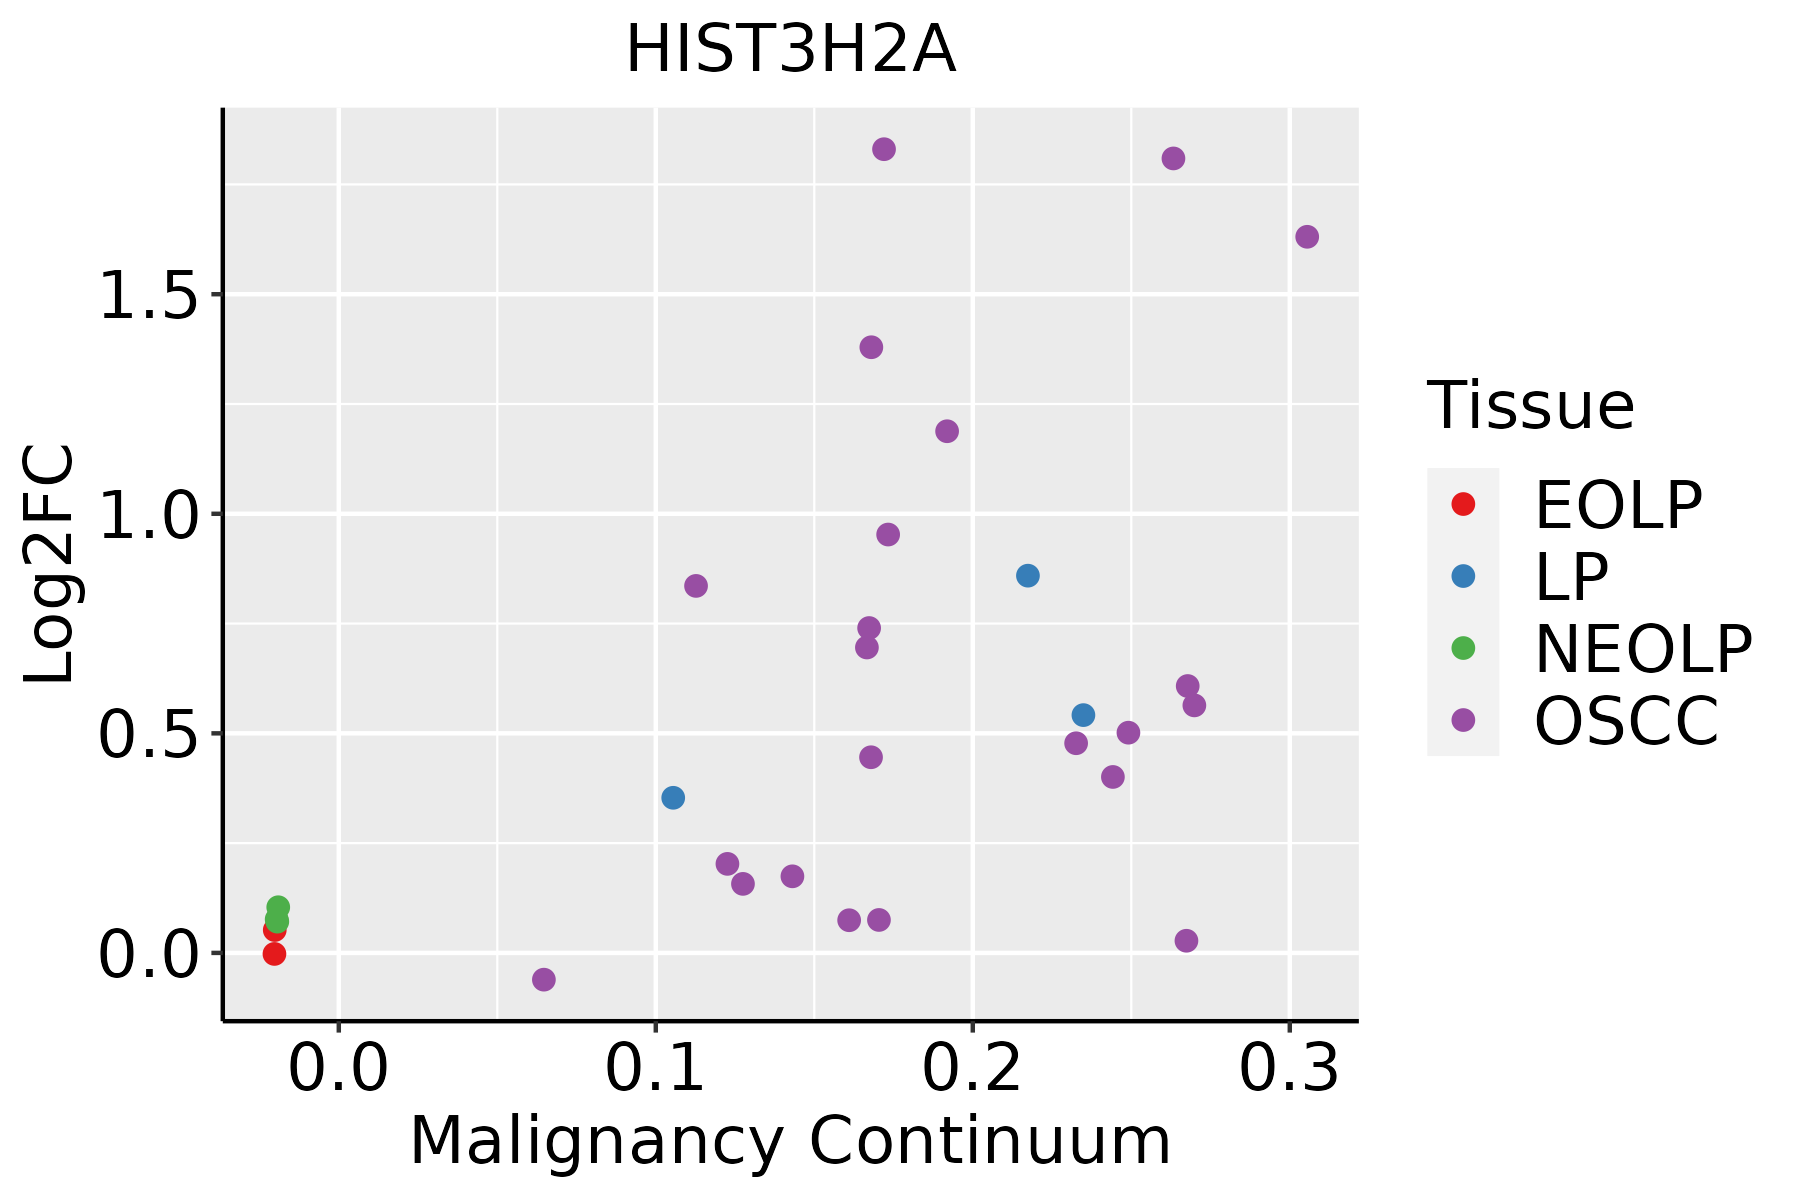 | EOLP: Erosive Oral lichen planus |
| LP: leukoplakia | ||
| NEOLP: Non-erosive oral lichen planus | ||
| OSCC: Oral squamous cell carcinoma | ||
| Prostate |  | BPH: Benign Prostatic Hyperplasia |
| ∗log2FC in expression of this searched gene in stem-like cells from each diseased tissue sample relative to stem-like cells in normal samples in each tissue plotted against the malignancy continuum. Samples are colored based on if they are from different disease stage. |
Top |
Malignant transformation related pathway analysis |
| Find out the enriched GO biological processes and KEGG pathways involved in transition from healthy to precancer to cancer |
| Tissue | Disease Stage | Enriched GO biological Processes |
| Colorectum | AD |  |
| Colorectum | SER |  |
| Colorectum | MSS |  |
| Colorectum | MSI-H |  |
| Colorectum | FAP |  |
| ∗Top 15 enriched GO BP terms are showed in the bar plot of each disease state in each tissue. Each row represents a significant GO biological process which is colored according to the -log10(p.adjust). |
| Page: 1 2 3 4 5 6 7 8 9 |
| GO ID | Tissue | Disease Stage | Description | Gene Ratio | Bg Ratio | pvalue | p.adjust | Count |
| Page: 1 |
| Pathway ID | Tissue | Disease Stage | Description | Gene Ratio | Bg Ratio | pvalue | p.adjust | qvalue | Count |
| Page: 1 |
Top |
Cell-cell communication analysis |
| Identification of potential cell-cell interactions between two cell types and their ligand-receptor pairs for different disease states |
| Ligand | Receptor | LRpair | Pathway | Tissue | Disease Stage |
| Page: 1 |
Top |
Single-cell gene regulatory network inference analysis |
| Find out the significant the regulons (TFs) and the target genes of each regulon across cell types for different disease states |
| TF | Cell Type | Tissue | Disease Stage | Target Gene | RSS | Regulon Activity |
| ∗The dot plots of a searched regulon are shown for all cell subpopulations in each disease state of each tissue based on the regulon specific score inferred using pySCENIC and by calculating the average expression. |
| Page: 1 |
Top |
Somatic mutation of malignant transformation related genes |
| Annotation of somatic variants for genes involved in malignant transformation |
| Hugo Symbol | Variant Class | Variant Classification | dbSNP RS | HGVSc | HGVSp | HGVSp Short | SWISSPROT | BIOTYPE | SIFT | PolyPhen | Tumor Sample Barcode | Tissue | Histology | Sex | Age | Stage | Therapy Types | Drugs | Outcome |
| HIST3H2A | SNV | Missense_Mutation | c.169G>C | p.Glu57Gln | p.E57Q | Q7L7L0 | protein_coding | deleterious_low_confidence(0) | probably_damaging(1) | TCGA-AC-A23H-01 | Breast | breast invasive carcinoma | Female | >=65 | I/II | Unknown | Unknown | PD | |
| HIST3H2A | SNV | Missense_Mutation | novel | c.316G>T | p.Gly106Cys | p.G106C | Q7L7L0 | protein_coding | deleterious_low_confidence(0) | probably_damaging(0.999) | TCGA-EA-A5ZF-01 | Cervix | cervical & endocervical cancer | Female | <65 | I/II | Unknown | Unknown | PD |
| HIST3H2A | SNV | Missense_Mutation | c.122C>G | p.Ser41Trp | p.S41W | Q7L7L0 | protein_coding | deleterious_low_confidence(0) | probably_damaging(0.995) | TCGA-IR-A3LK-01 | Cervix | cervical & endocervical cancer | Female | >=65 | I/II | Chemotherapy | cisplatin | PD | |
| HIST3H2A | SNV | Missense_Mutation | c.228G>C | p.Lys76Asn | p.K76N | Q7L7L0 | protein_coding | deleterious_low_confidence(0.01) | probably_damaging(0.994) | TCGA-Q1-A73O-01 | Cervix | cervical & endocervical cancer | Female | <65 | I/II | Chemotherapy | cisplatin | CR | |
| HIST3H2A | SNV | Missense_Mutation | c.169N>C | p.Glu57Gln | p.E57Q | Q7L7L0 | protein_coding | deleterious_low_confidence(0) | probably_damaging(1) | TCGA-F5-6813-01 | Colorectum | rectum adenocarcinoma | Male | >=65 | III/IV | Unknown | Unknown | PD | |
| HIST3H2A | SNV | Missense_Mutation | rs373301076 | c.142G>A | p.Ala48Thr | p.A48T | Q7L7L0 | protein_coding | deleterious_low_confidence(0.02) | possibly_damaging(0.55) | TCGA-AX-A2HC-01 | Endometrium | uterine corpus endometrioid carcinoma | Female | <65 | III/IV | Chemotherapy | paclitaxel | PD |
| HIST3H2A | SNV | Missense_Mutation | c.13G>T | p.Gly5Cys | p.G5C | Q7L7L0 | protein_coding | deleterious_low_confidence(0) | benign(0.057) | TCGA-B5-A11Y-01 | Endometrium | uterine corpus endometrioid carcinoma | Female | <65 | I/II | Unknown | Unknown | SD | |
| HIST3H2A | SNV | Missense_Mutation | novel | c.79N>T | p.Pro27Ser | p.P27S | Q7L7L0 | protein_coding | deleterious_low_confidence(0.04) | possibly_damaging(0.835) | TCGA-EO-A22U-01 | Endometrium | uterine corpus endometrioid carcinoma | Female | >=65 | I/II | Unknown | Unknown | SD |
| HIST3H2A | SNV | Missense_Mutation | c.228N>C | p.Lys76Asn | p.K76N | Q7L7L0 | protein_coding | deleterious_low_confidence(0.01) | probably_damaging(0.994) | TCGA-EY-A4KR-01 | Endometrium | uterine corpus endometrioid carcinoma | Female | <65 | III/IV | Chemotherapy | carboplatin | PD | |
| HIST3H2A | SNV | Missense_Mutation | novel | c.59C>T | p.Ser20Leu | p.S20L | Q7L7L0 | protein_coding | deleterious_low_confidence(0.02) | probably_damaging(0.941) | TCGA-CC-A8HT-01 | Liver | liver hepatocellular carcinoma | Male | >=65 | III/IV | Unknown | Unknown | PD |
| Page: 1 2 |
Top |
Related drugs of malignant transformation related genes |
| Identification of chemicals and drugs interact with genes involved in malignant transfromation |
| (DGIdb 4.0) |
| Entrez ID | Symbol | Category | Interaction Types | Drug Claim Name | Drug Name | PMIDs |
| Page: 1 |

Copyright 2023-Present -The University of Texas Health Science Center at Houston |