
|
|||||
|
 | |
| |
| |
| |
| |
| |
|
Gene: HIST1H3H |
Gene summary for HIST1H3H |
| Gene information | Species | Human | Gene symbol | HIST1H3H | Gene ID | 8357 |
| Gene name | H3 clustered histone 10 | |
| Gene Alias | H3/k | |
| Cytomap | 6p22.1 | |
| Gene Type | protein-coding | GO ID | GO:0006323 | UniProtAcc | P68431 |
Top |
Malignant transformation analysis |
| Identification of the aberrant gene expression in precancerous and cancerous lesions by comparing the gene expression of stem-like cells in diseased tissues with normal stem cells |
| Entrez ID | Symbol | Replicates | Species | Organ | Tissue | Adj P-value | Log2FC | Malignancy |
| 8357 | HIST1H3H | P94T-E | Human | Esophagus | ESCC | 6.05e-03 | 5.78e-01 | 0.0879 |
| 8357 | HIST1H3H | P104T-E | Human | Esophagus | ESCC | 1.51e-11 | 3.96e-01 | 0.0931 |
| 8357 | HIST1H3H | P107T-E | Human | Esophagus | ESCC | 4.67e-06 | 1.57e-01 | 0.171 |
| 8357 | HIST1H3H | P127T-E | Human | Esophagus | ESCC | 3.57e-35 | 7.71e-01 | 0.0826 |
| 8357 | HIST1H3H | P128T-E | Human | Esophagus | ESCC | 1.37e-04 | 1.96e-01 | 0.1241 |
| 8357 | HIST1H3H | P130T-E | Human | Esophagus | ESCC | 5.79e-16 | 3.85e-01 | 0.1676 |
| 8357 | HIST1H3H | C04 | Human | Oral cavity | OSCC | 1.10e-08 | 6.36e-01 | 0.2633 |
| 8357 | HIST1H3H | C30 | Human | Oral cavity | OSCC | 2.57e-10 | 6.10e-01 | 0.3055 |
| 8357 | HIST1H3H | SYSMH2 | Human | Oral cavity | OSCC | 3.14e-08 | 3.97e-01 | 0.2326 |
| 8357 | HIST1H3H | SYSMH3 | Human | Oral cavity | OSCC | 6.92e-05 | 3.41e-01 | 0.2442 |
| Page: 1 2 3 4 |
| Tissue | Expression Dynamics | Abbreviation |
| Esophagus | 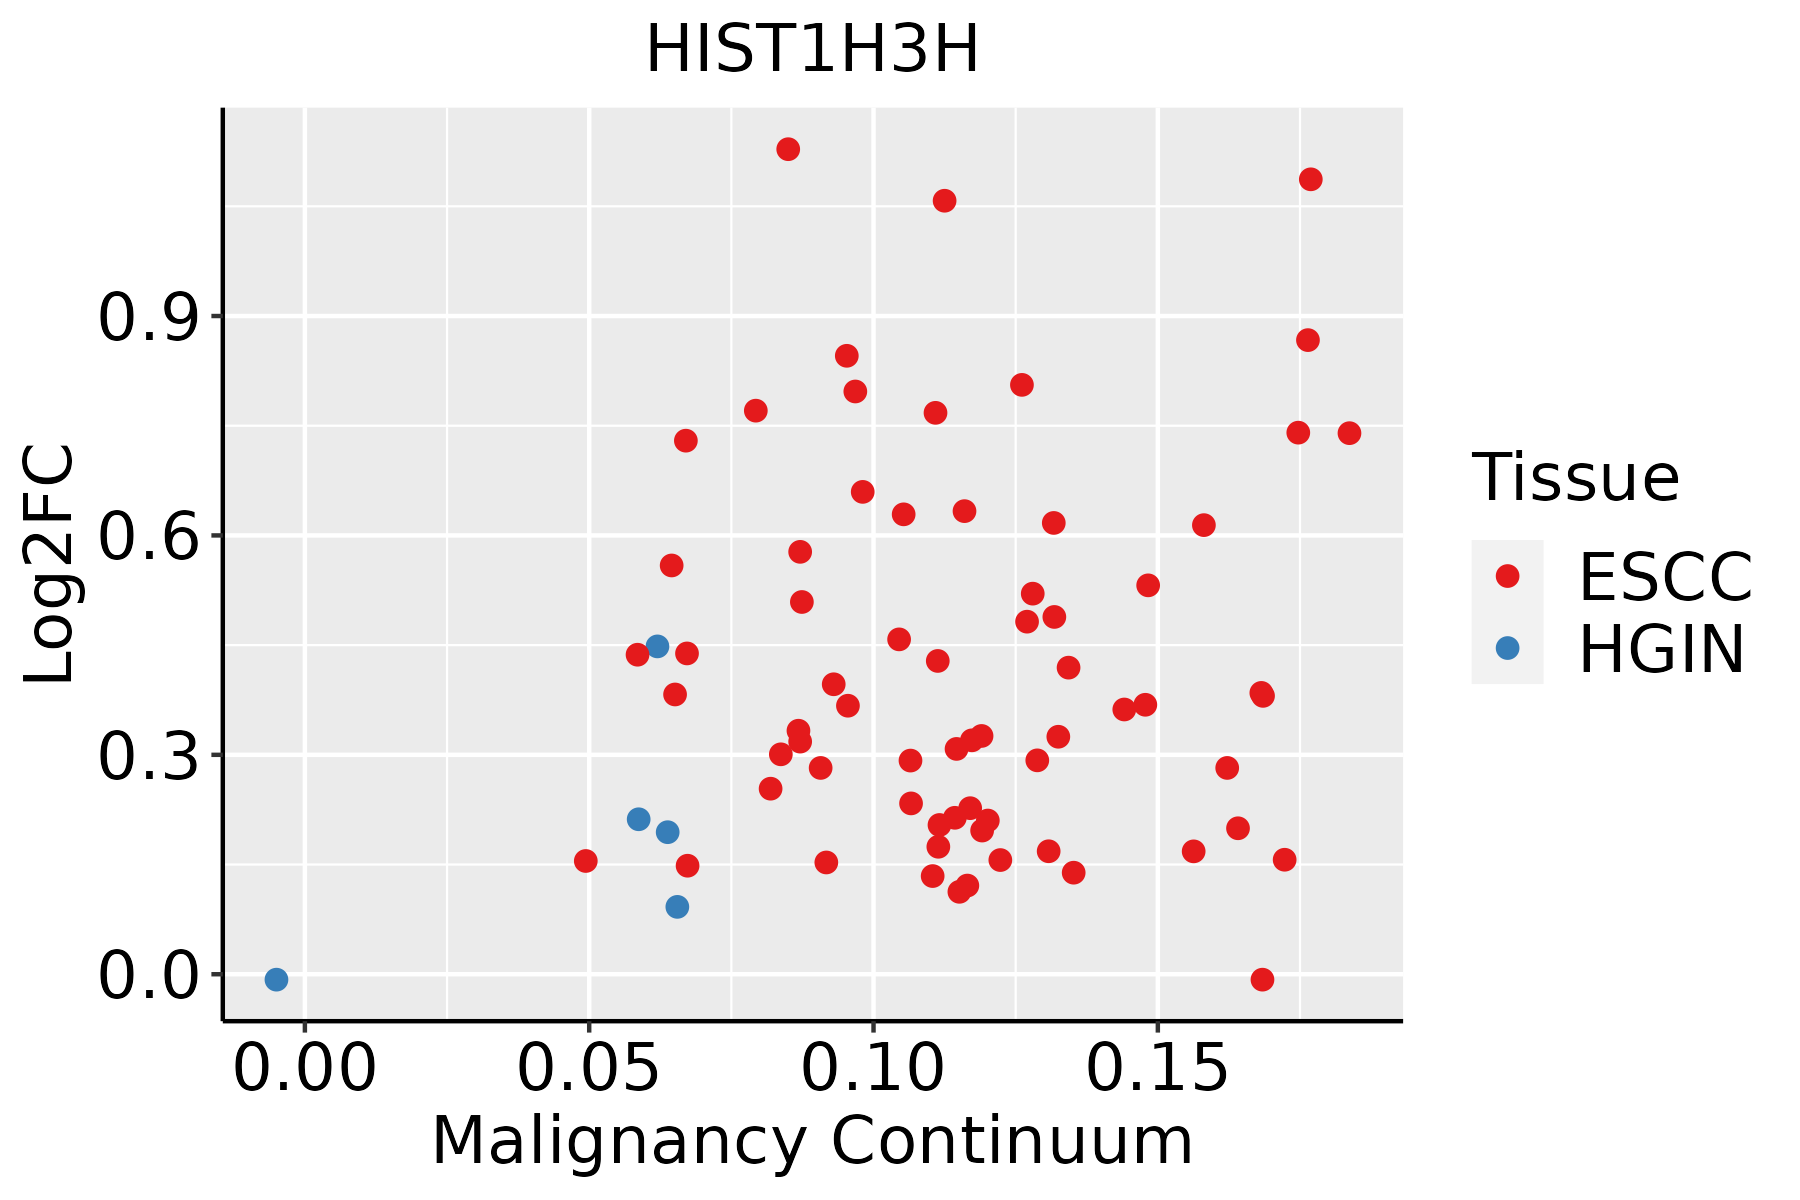 | ESCC: Esophageal squamous cell carcinoma |
| HGIN: High-grade intraepithelial neoplasias | ||
| LGIN: Low-grade intraepithelial neoplasias | ||
| Oral Cavity | 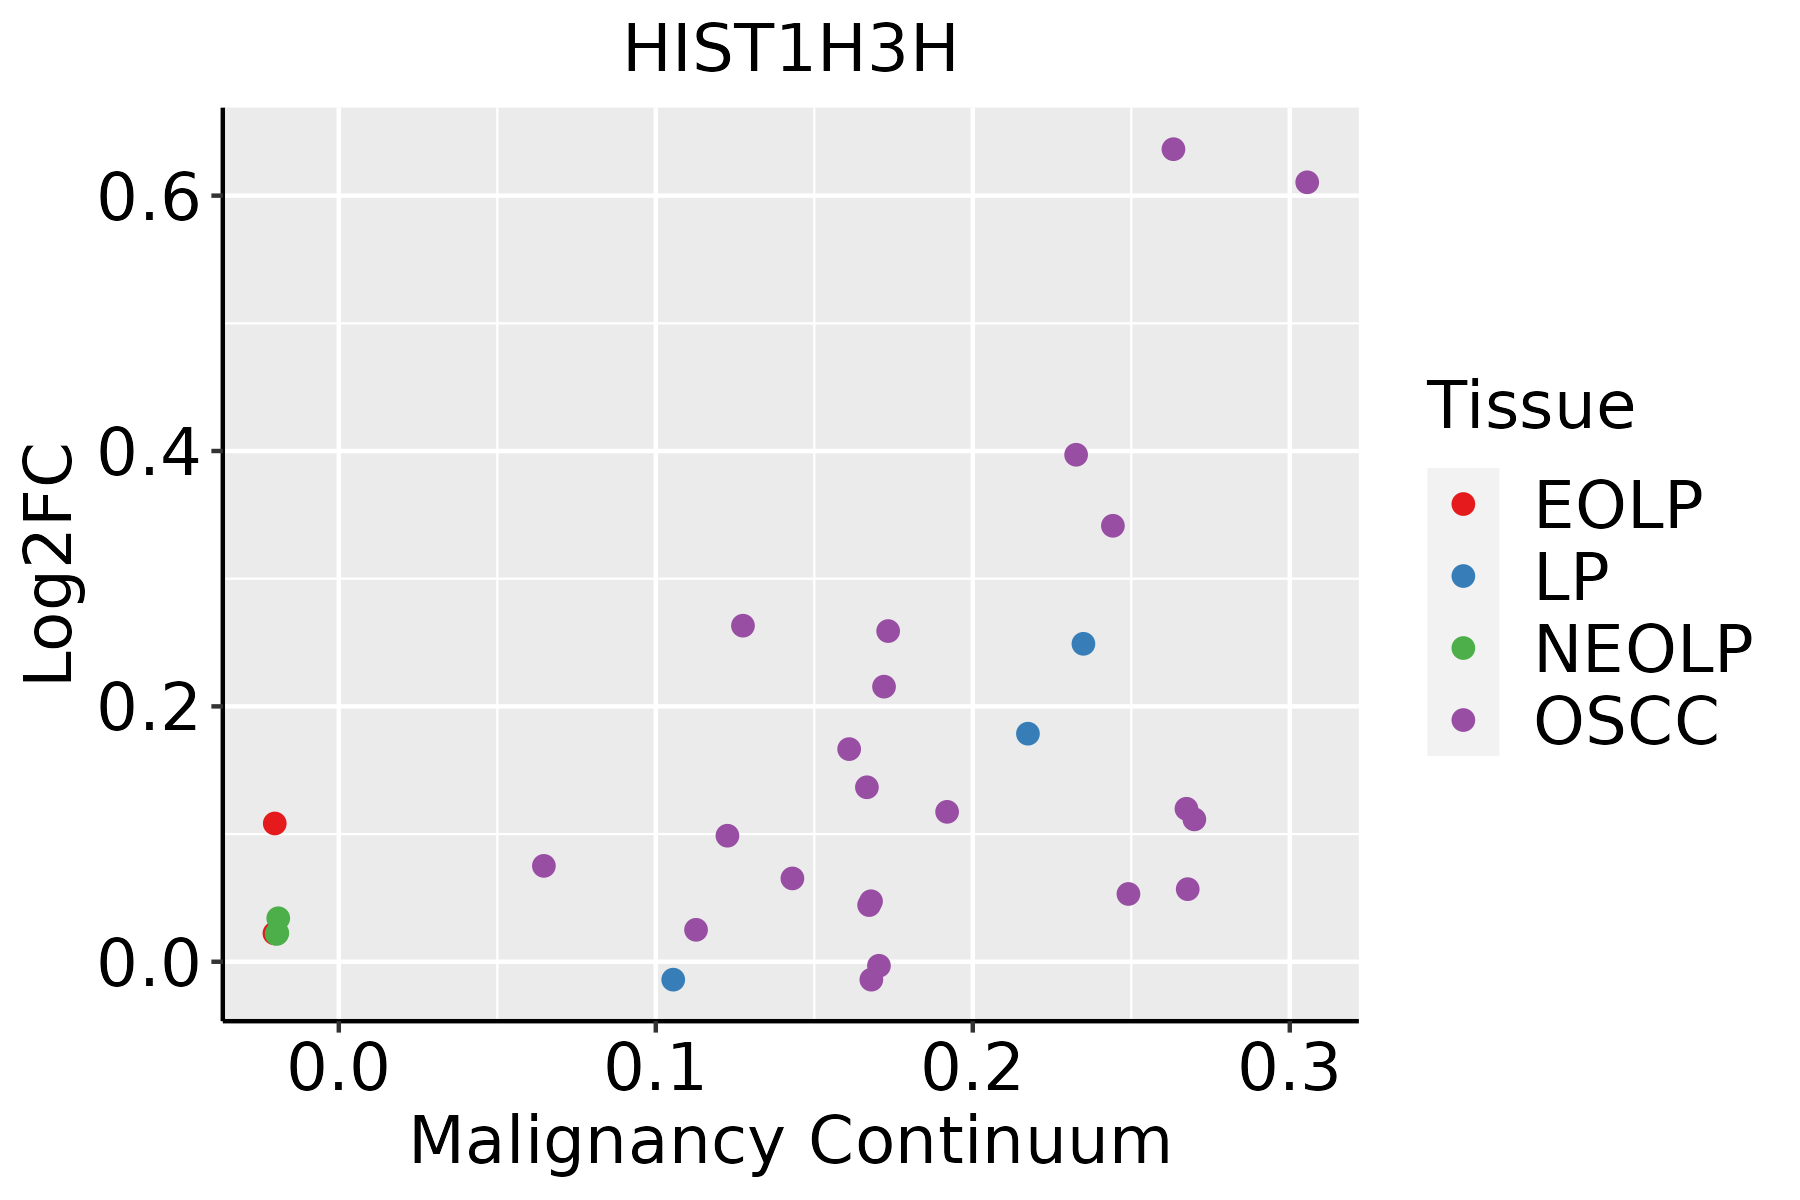 | EOLP: Erosive Oral lichen planus |
| LP: leukoplakia | ||
| NEOLP: Non-erosive oral lichen planus | ||
| OSCC: Oral squamous cell carcinoma |
| ∗log2FC in expression of this searched gene in stem-like cells from each diseased tissue sample relative to stem-like cells in normal samples in each tissue plotted against the malignancy continuum. Samples are colored based on if they are from different disease stage. |
Top |
Malignant transformation related pathway analysis |
| Find out the enriched GO biological processes and KEGG pathways involved in transition from healthy to precancer to cancer |
| Tissue | Disease Stage | Enriched GO biological Processes |
| Colorectum | AD |  |
| Colorectum | SER |  |
| Colorectum | MSS |  |
| Colorectum | MSI-H |  |
| Colorectum | FAP |  |
| ∗Top 15 enriched GO BP terms are showed in the bar plot of each disease state in each tissue. Each row represents a significant GO biological process which is colored according to the -log10(p.adjust). |
| Page: 1 2 3 4 5 6 7 8 9 |
| GO ID | Tissue | Disease Stage | Description | Gene Ratio | Bg Ratio | pvalue | p.adjust | Count |
| Page: 1 |
| Pathway ID | Tissue | Disease Stage | Description | Gene Ratio | Bg Ratio | pvalue | p.adjust | qvalue | Count |
| Page: 1 |
Top |
Cell-cell communication analysis |
| Identification of potential cell-cell interactions between two cell types and their ligand-receptor pairs for different disease states |
| Ligand | Receptor | LRpair | Pathway | Tissue | Disease Stage |
| Page: 1 |
Top |
Single-cell gene regulatory network inference analysis |
| Find out the significant the regulons (TFs) and the target genes of each regulon across cell types for different disease states |
| TF | Cell Type | Tissue | Disease Stage | Target Gene | RSS | Regulon Activity |
| ∗The dot plots of a searched regulon are shown for all cell subpopulations in each disease state of each tissue based on the regulon specific score inferred using pySCENIC and by calculating the average expression. |
| Page: 1 |
Top |
Somatic mutation of malignant transformation related genes |
| Annotation of somatic variants for genes involved in malignant transformation |
| Hugo Symbol | Variant Class | Variant Classification | dbSNP RS | HGVSc | HGVSp | HGVSp Short | SWISSPROT | BIOTYPE | SIFT | PolyPhen | Tumor Sample Barcode | Tissue | Histology | Sex | Age | Stage | Therapy Types | Drugs | Outcome |
| HIST1H3H | SNV | Missense_Mutation | novel | c.215T>G | p.Val72Gly | p.V72G | P68431 | protein_coding | deleterious_low_confidence(0.01) | probably_damaging(0.91) | TCGA-C8-A273-01 | Breast | breast invasive carcinoma | Female | <65 | I/II | Hormone Therapy | tamoxiphen | SD |
| HIST1H3H | SNV | Missense_Mutation | c.292G>A | p.Glu98Lys | p.E98K | P68431 | protein_coding | deleterious_low_confidence(0.02) | possibly_damaging(0.904) | TCGA-Q1-A73O-01 | Cervix | cervical & endocervical cancer | Female | <65 | I/II | Chemotherapy | cisplatin | CR | |
| HIST1H3H | insertion | Frame_Shift_Ins | novel | c.54_55insA | p.Gln20AlafsTer55 | p.Q20Afs*55 | P68431 | protein_coding | TCGA-G4-6588-01 | Colorectum | colon adenocarcinoma | Female | <65 | I/II | Unknown | Unknown | SD | ||
| HIST1H3H | SNV | Missense_Mutation | novel | c.268N>A | p.Val90Met | p.V90M | P68431 | protein_coding | tolerated_low_confidence(0.05) | benign(0.189) | TCGA-A5-A0G2-01 | Endometrium | uterine corpus endometrioid carcinoma | Female | <65 | III/IV | Unknown | Unknown | SD |
| HIST1H3H | SNV | Missense_Mutation | novel | c.404N>T | p.Arg135Met | p.R135M | P68431 | protein_coding | deleterious_low_confidence(0) | benign(0.155) | TCGA-A5-A0G2-01 | Endometrium | uterine corpus endometrioid carcinoma | Female | <65 | III/IV | Unknown | Unknown | SD |
| HIST1H3H | SNV | Missense_Mutation | novel | c.111G>T | p.Lys37Asn | p.K37N | P68431 | protein_coding | deleterious_low_confidence(0.03) | possibly_damaging(0.876) | TCGA-AJ-A3EK-01 | Endometrium | uterine corpus endometrioid carcinoma | Female | <65 | I/II | Chemotherapy | carboplatin | CR |
| HIST1H3H | SNV | Missense_Mutation | novel | c.40N>T | p.Gly14Cys | p.G14C | P68431 | protein_coding | deleterious_low_confidence(0) | benign(0.021) | TCGA-AX-A1C4-01 | Endometrium | uterine corpus endometrioid carcinoma | Female | <65 | I/II | Unknown | Unknown | SD |
| HIST1H3H | SNV | Missense_Mutation | novel | c.128G>A | p.Arg43Gln | p.R43Q | P68431 | protein_coding | deleterious_low_confidence(0) | benign(0.285) | TCGA-CC-A9FS-01 | Liver | liver hepatocellular carcinoma | Male | <65 | I/II | Unknown | Unknown | PD |
| HIST1H3H | SNV | Missense_Mutation | c.406G>T | p.Ala136Ser | p.A136S | P68431 | protein_coding | tolerated_low_confidence(0.08) | benign(0.028) | TCGA-64-5778-01 | Lung | lung adenocarcinoma | Male | <65 | I/II | Targeted Molecular therapy | tarceva | PD | |
| HIST1H3H | SNV | Missense_Mutation | c.382N>C | p.Ala128Pro | p.A128P | P68431 | protein_coding | deleterious_low_confidence(0.01) | probably_damaging(0.981) | TCGA-80-5611-01 | Lung | lung adenocarcinoma | Male | Unknown | I/II | Unknown | Unknown | SD |
| Page: 1 2 |
Top |
Related drugs of malignant transformation related genes |
| Identification of chemicals and drugs interact with genes involved in malignant transfromation |
| (DGIdb 4.0) |
| Entrez ID | Symbol | Category | Interaction Types | Drug Claim Name | Drug Name | PMIDs |
| Page: 1 |

Copyright 2023-Present -The University of Texas Health Science Center at Houston |