
|
|||||
|
 | |
| |
| |
| |
| |
| |
|
Gene: GTPBP10 |
Gene summary for GTPBP10 |
| Gene information | Species | Human | Gene symbol | GTPBP10 | Gene ID | 85865 |
| Gene name | GTP binding protein 10 | |
| Gene Alias | ObgH2 | |
| Cytomap | 7q21.13 | |
| Gene Type | protein-coding | GO ID | GO:0008150 | UniProtAcc | A4D1E9 |
Top |
Malignant transformation analysis |
| Identification of the aberrant gene expression in precancerous and cancerous lesions by comparing the gene expression of stem-like cells in diseased tissues with normal stem cells |
| Entrez ID | Symbol | Replicates | Species | Organ | Tissue | Adj P-value | Log2FC | Malignancy |
| 85865 | GTPBP10 | S41 | Human | Liver | Cirrhotic | 1.70e-03 | 3.46e-01 | -0.0343 |
| 85865 | GTPBP10 | HCC1_Meng | Human | Liver | HCC | 1.56e-31 | -1.63e-03 | 0.0246 |
| 85865 | GTPBP10 | HCC2_Meng | Human | Liver | HCC | 1.49e-06 | 2.10e-02 | 0.0107 |
| 85865 | GTPBP10 | HCC1 | Human | Liver | HCC | 4.26e-06 | 2.59e+00 | 0.5336 |
| 85865 | GTPBP10 | HCC2 | Human | Liver | HCC | 6.76e-29 | 3.70e+00 | 0.5341 |
| 85865 | GTPBP10 | HCC5 | Human | Liver | HCC | 1.75e-16 | 1.09e+00 | 0.4932 |
| 85865 | GTPBP10 | S014 | Human | Liver | HCC | 2.01e-07 | 3.38e-01 | 0.2254 |
| 85865 | GTPBP10 | S015 | Human | Liver | HCC | 7.73e-12 | 5.47e-01 | 0.2375 |
| 85865 | GTPBP10 | S016 | Human | Liver | HCC | 3.11e-13 | 4.66e-01 | 0.2243 |
| 85865 | GTPBP10 | S028 | Human | Liver | HCC | 8.36e-04 | 3.72e-01 | 0.2503 |
| 85865 | GTPBP10 | S029 | Human | Liver | HCC | 1.35e-06 | 3.93e-01 | 0.2581 |
| 85865 | GTPBP10 | male-WTA | Human | Thyroid | PTC | 9.54e-11 | 5.81e-02 | 0.1037 |
| 85865 | GTPBP10 | PTC01 | Human | Thyroid | PTC | 2.99e-04 | 2.83e-02 | 0.1899 |
| 85865 | GTPBP10 | PTC04 | Human | Thyroid | PTC | 5.06e-10 | 6.36e-02 | 0.1927 |
| 85865 | GTPBP10 | PTC05 | Human | Thyroid | PTC | 6.33e-08 | 1.63e-01 | 0.2065 |
| 85865 | GTPBP10 | PTC06 | Human | Thyroid | PTC | 2.98e-15 | 2.89e-01 | 0.2057 |
| 85865 | GTPBP10 | PTC07 | Human | Thyroid | PTC | 6.77e-09 | 1.53e-01 | 0.2044 |
| 85865 | GTPBP10 | ATC12 | Human | Thyroid | ATC | 6.14e-05 | 1.88e-02 | 0.34 |
| 85865 | GTPBP10 | ATC13 | Human | Thyroid | ATC | 4.92e-69 | 1.23e+00 | 0.34 |
| 85865 | GTPBP10 | ATC2 | Human | Thyroid | ATC | 8.82e-08 | 5.58e-01 | 0.34 |
| Page: 1 2 3 4 5 |
| Tissue | Expression Dynamics | Abbreviation |
| Esophagus |  | ESCC: Esophageal squamous cell carcinoma |
| HGIN: High-grade intraepithelial neoplasias | ||
| LGIN: Low-grade intraepithelial neoplasias | ||
| Liver | 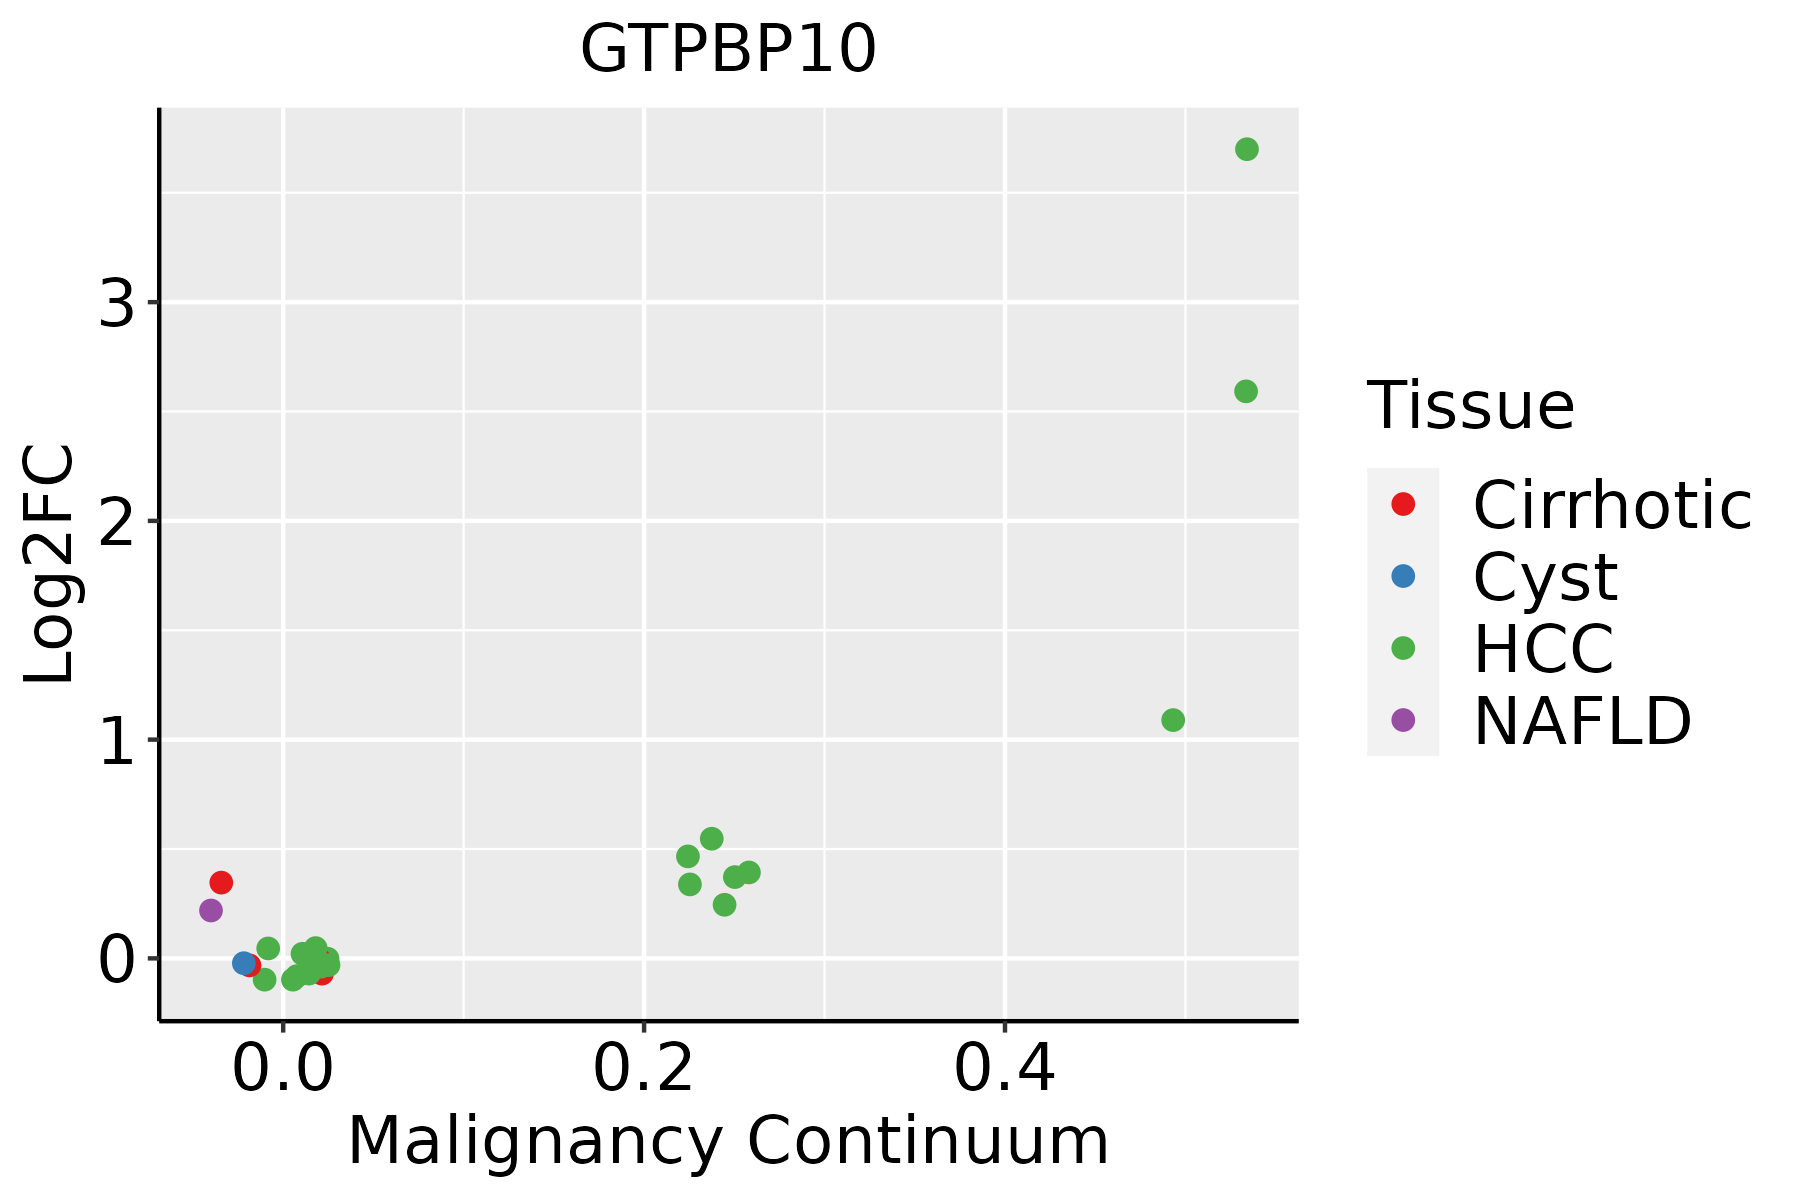 | HCC: Hepatocellular carcinoma |
| NAFLD: Non-alcoholic fatty liver disease | ||
| Thyroid |  | ATC: Anaplastic thyroid cancer |
| HT: Hashimoto's thyroiditis | ||
| PTC: Papillary thyroid cancer |
| ∗log2FC in expression of this searched gene in stem-like cells from each diseased tissue sample relative to stem-like cells in normal samples in each tissue plotted against the malignancy continuum. Samples are colored based on if they are from different disease stage. |
Top |
Malignant transformation related pathway analysis |
| Find out the enriched GO biological processes and KEGG pathways involved in transition from healthy to precancer to cancer |
| Tissue | Disease Stage | Enriched GO biological Processes |
| Colorectum | AD |  |
| Colorectum | SER |  |
| Colorectum | MSS |  |
| Colorectum | MSI-H |  |
| Colorectum | FAP |  |
| ∗Top 15 enriched GO BP terms are showed in the bar plot of each disease state in each tissue. Each row represents a significant GO biological process which is colored according to the -log10(p.adjust). |
| Page: 1 2 3 4 5 6 7 8 9 |
| GO ID | Tissue | Disease Stage | Description | Gene Ratio | Bg Ratio | pvalue | p.adjust | Count |
| GO:0022613111 | Esophagus | ESCC | ribonucleoprotein complex biogenesis | 365/8552 | 463/18723 | 1.74e-49 | 1.11e-45 | 365 |
| GO:0042254111 | Esophagus | ESCC | ribosome biogenesis | 252/8552 | 299/18723 | 3.27e-44 | 1.04e-40 | 252 |
| GO:002261312 | Liver | Cirrhotic | ribonucleoprotein complex biogenesis | 231/4634 | 463/18723 | 3.28e-32 | 6.86e-29 | 231 |
| GO:004225412 | Liver | Cirrhotic | ribosome biogenesis | 154/4634 | 299/18723 | 1.18e-23 | 6.72e-21 | 154 |
| GO:002261322 | Liver | HCC | ribonucleoprotein complex biogenesis | 355/7958 | 463/18723 | 7.76e-52 | 4.92e-48 | 355 |
| GO:004225422 | Liver | HCC | ribosome biogenesis | 246/7958 | 299/18723 | 4.99e-46 | 1.58e-42 | 246 |
| GO:0022613113 | Thyroid | PTC | ribonucleoprotein complex biogenesis | 292/5968 | 463/18723 | 3.24e-44 | 2.05e-40 | 292 |
| GO:0042254113 | Thyroid | PTC | ribosome biogenesis | 202/5968 | 299/18723 | 3.47e-37 | 5.47e-34 | 202 |
| GO:002261334 | Thyroid | ATC | ribonucleoprotein complex biogenesis | 292/6293 | 463/18723 | 3.05e-39 | 9.63e-36 | 292 |
| GO:004225434 | Thyroid | ATC | ribosome biogenesis | 203/6293 | 299/18723 | 3.63e-34 | 4.59e-31 | 203 |
| Page: 1 |
| Pathway ID | Tissue | Disease Stage | Description | Gene Ratio | Bg Ratio | pvalue | p.adjust | qvalue | Count |
| Page: 1 |
Top |
Cell-cell communication analysis |
| Identification of potential cell-cell interactions between two cell types and their ligand-receptor pairs for different disease states |
| Ligand | Receptor | LRpair | Pathway | Tissue | Disease Stage |
| Page: 1 |
Top |
Single-cell gene regulatory network inference analysis |
| Find out the significant the regulons (TFs) and the target genes of each regulon across cell types for different disease states |
| TF | Cell Type | Tissue | Disease Stage | Target Gene | RSS | Regulon Activity |
| ∗The dot plots of a searched regulon are shown for all cell subpopulations in each disease state of each tissue based on the regulon specific score inferred using pySCENIC and by calculating the average expression. |
| Page: 1 |
Top |
Somatic mutation of malignant transformation related genes |
| Annotation of somatic variants for genes involved in malignant transformation |
| Hugo Symbol | Variant Class | Variant Classification | dbSNP RS | HGVSc | HGVSp | HGVSp Short | SWISSPROT | BIOTYPE | SIFT | PolyPhen | Tumor Sample Barcode | Tissue | Histology | Sex | Age | Stage | Therapy Types | Drugs | Outcome |
| GTPBP10 | SNV | Missense_Mutation | novel | c.475N>T | p.Ala159Ser | p.A159S | A4D1E9 | protein_coding | deleterious(0) | probably_damaging(0.986) | TCGA-5T-A9QA-01 | Breast | breast invasive carcinoma | Female | <65 | I/II | Chemotherapy | taxol | SD |
| GTPBP10 | SNV | Missense_Mutation | rs139533783 | c.190C>T | p.Arg64Trp | p.R64W | A4D1E9 | protein_coding | deleterious(0.01) | possibly_damaging(0.72) | TCGA-AN-A046-01 | Breast | breast invasive carcinoma | Female | >=65 | I/II | Unknown | Unknown | SD |
| GTPBP10 | SNV | Missense_Mutation | novel | c.836A>C | p.Lys279Thr | p.K279T | A4D1E9 | protein_coding | deleterious(0) | probably_damaging(1) | TCGA-AN-A046-01 | Breast | breast invasive carcinoma | Female | >=65 | I/II | Unknown | Unknown | SD |
| GTPBP10 | SNV | Missense_Mutation | c.1008N>C | p.Lys336Asn | p.K336N | A4D1E9 | protein_coding | deleterious(0) | possibly_damaging(0.901) | TCGA-BH-A0B6-01 | Breast | breast invasive carcinoma | Female | <65 | I/II | Unknown | Unknown | SD | |
| GTPBP10 | SNV | Missense_Mutation | c.56N>C | p.Leu19Pro | p.L19P | A4D1E9 | protein_coding | deleterious(0) | probably_damaging(0.988) | TCGA-D8-A1JJ-01 | Breast | breast invasive carcinoma | Female | <65 | I/II | Chemotherapy | doxorubicine | SD | |
| GTPBP10 | SNV | Missense_Mutation | c.835N>G | p.Lys279Glu | p.K279E | A4D1E9 | protein_coding | deleterious(0) | probably_damaging(1) | TCGA-Q1-A5R2-01 | Cervix | cervical & endocervical cancer | Female | <65 | I/II | Chemotherapy | cisplatin | PR | |
| GTPBP10 | SNV | Missense_Mutation | c.1008N>T | p.Lys336Asn | p.K336N | A4D1E9 | protein_coding | deleterious(0) | possibly_damaging(0.901) | TCGA-A6-6141-01 | Colorectum | colon adenocarcinoma | Male | <65 | I/II | Chemotherapy | 5-fu | SD | |
| GTPBP10 | SNV | Missense_Mutation | novel | c.1028T>C | p.Leu343Pro | p.L343P | A4D1E9 | protein_coding | deleterious(0) | probably_damaging(0.976) | TCGA-AA-3947-01 | Colorectum | colon adenocarcinoma | Female | <65 | I/II | Unknown | Unknown | SD |
| GTPBP10 | SNV | Missense_Mutation | novel | c.19G>A | p.Val7Met | p.V7M | A4D1E9 | protein_coding | tolerated(0.07) | benign(0.006) | TCGA-AA-A01K-01 | Colorectum | colon adenocarcinoma | Female | >=65 | III/IV | Chemotherapy | folinic | CR |
| GTPBP10 | SNV | Missense_Mutation | rs774098926 | c.416N>A | p.Arg139Gln | p.R139Q | A4D1E9 | protein_coding | tolerated(0.16) | benign(0.067) | TCGA-AZ-4315-01 | Colorectum | colon adenocarcinoma | Male | <65 | I/II | Unknown | Unknown | SD |
| Page: 1 2 3 4 5 |
Top |
Related drugs of malignant transformation related genes |
| Identification of chemicals and drugs interact with genes involved in malignant transfromation |
| (DGIdb 4.0) |
| Entrez ID | Symbol | Category | Interaction Types | Drug Claim Name | Drug Name | PMIDs |
| Page: 1 |

Copyright 2023-Present -The University of Texas Health Science Center at Houston |