| Tissue | Expression Dynamics | Abbreviation |
| Colorectum (GSE201348) |  | FAP: Familial adenomatous polyposis |
| CRC: Colorectal cancer |
| Colorectum (HTA11) | 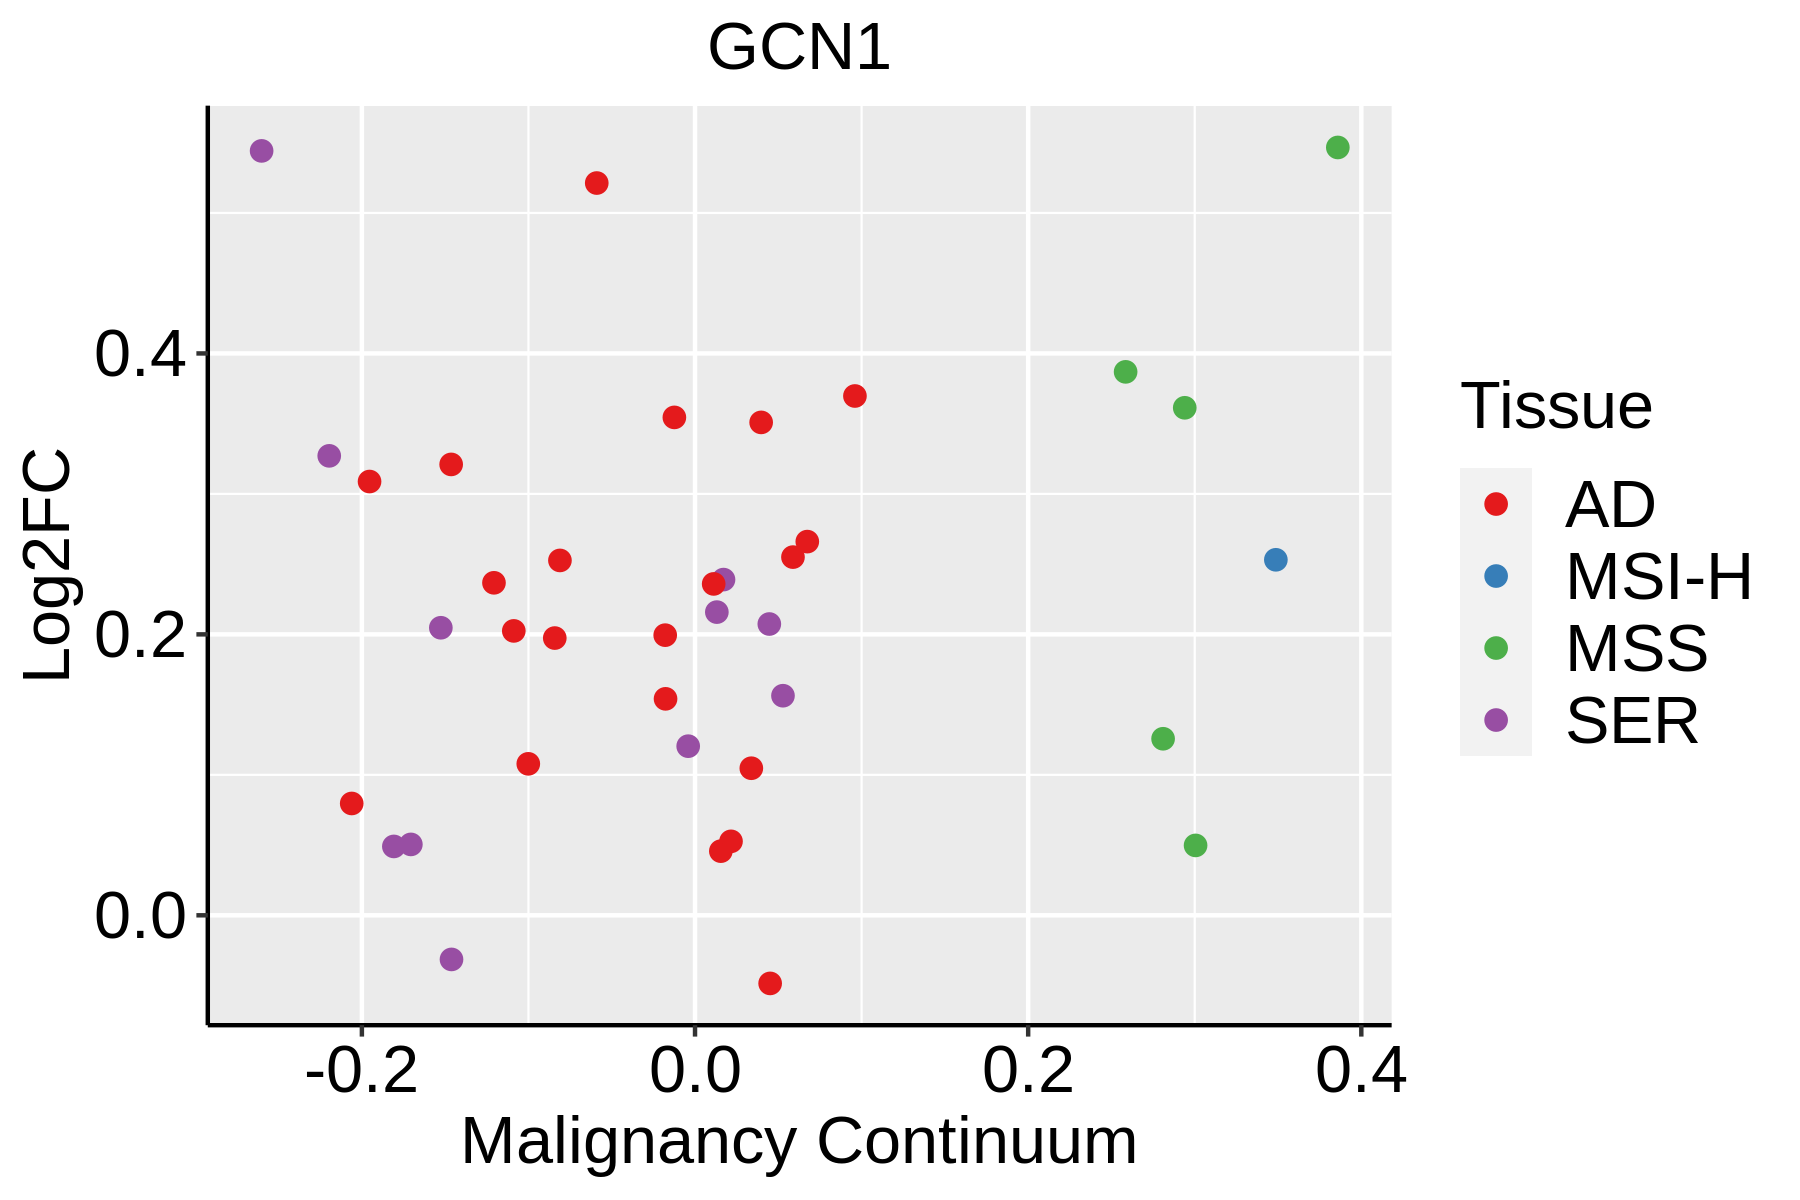 | AD: Adenomas |
| SER: Sessile serrated lesions |
| MSI-H: Microsatellite-high colorectal cancer |
| MSS: Microsatellite stable colorectal cancer |
| Esophagus |  | ESCC: Esophageal squamous cell carcinoma |
| HGIN: High-grade intraepithelial neoplasias |
| LGIN: Low-grade intraepithelial neoplasias |
| Liver | 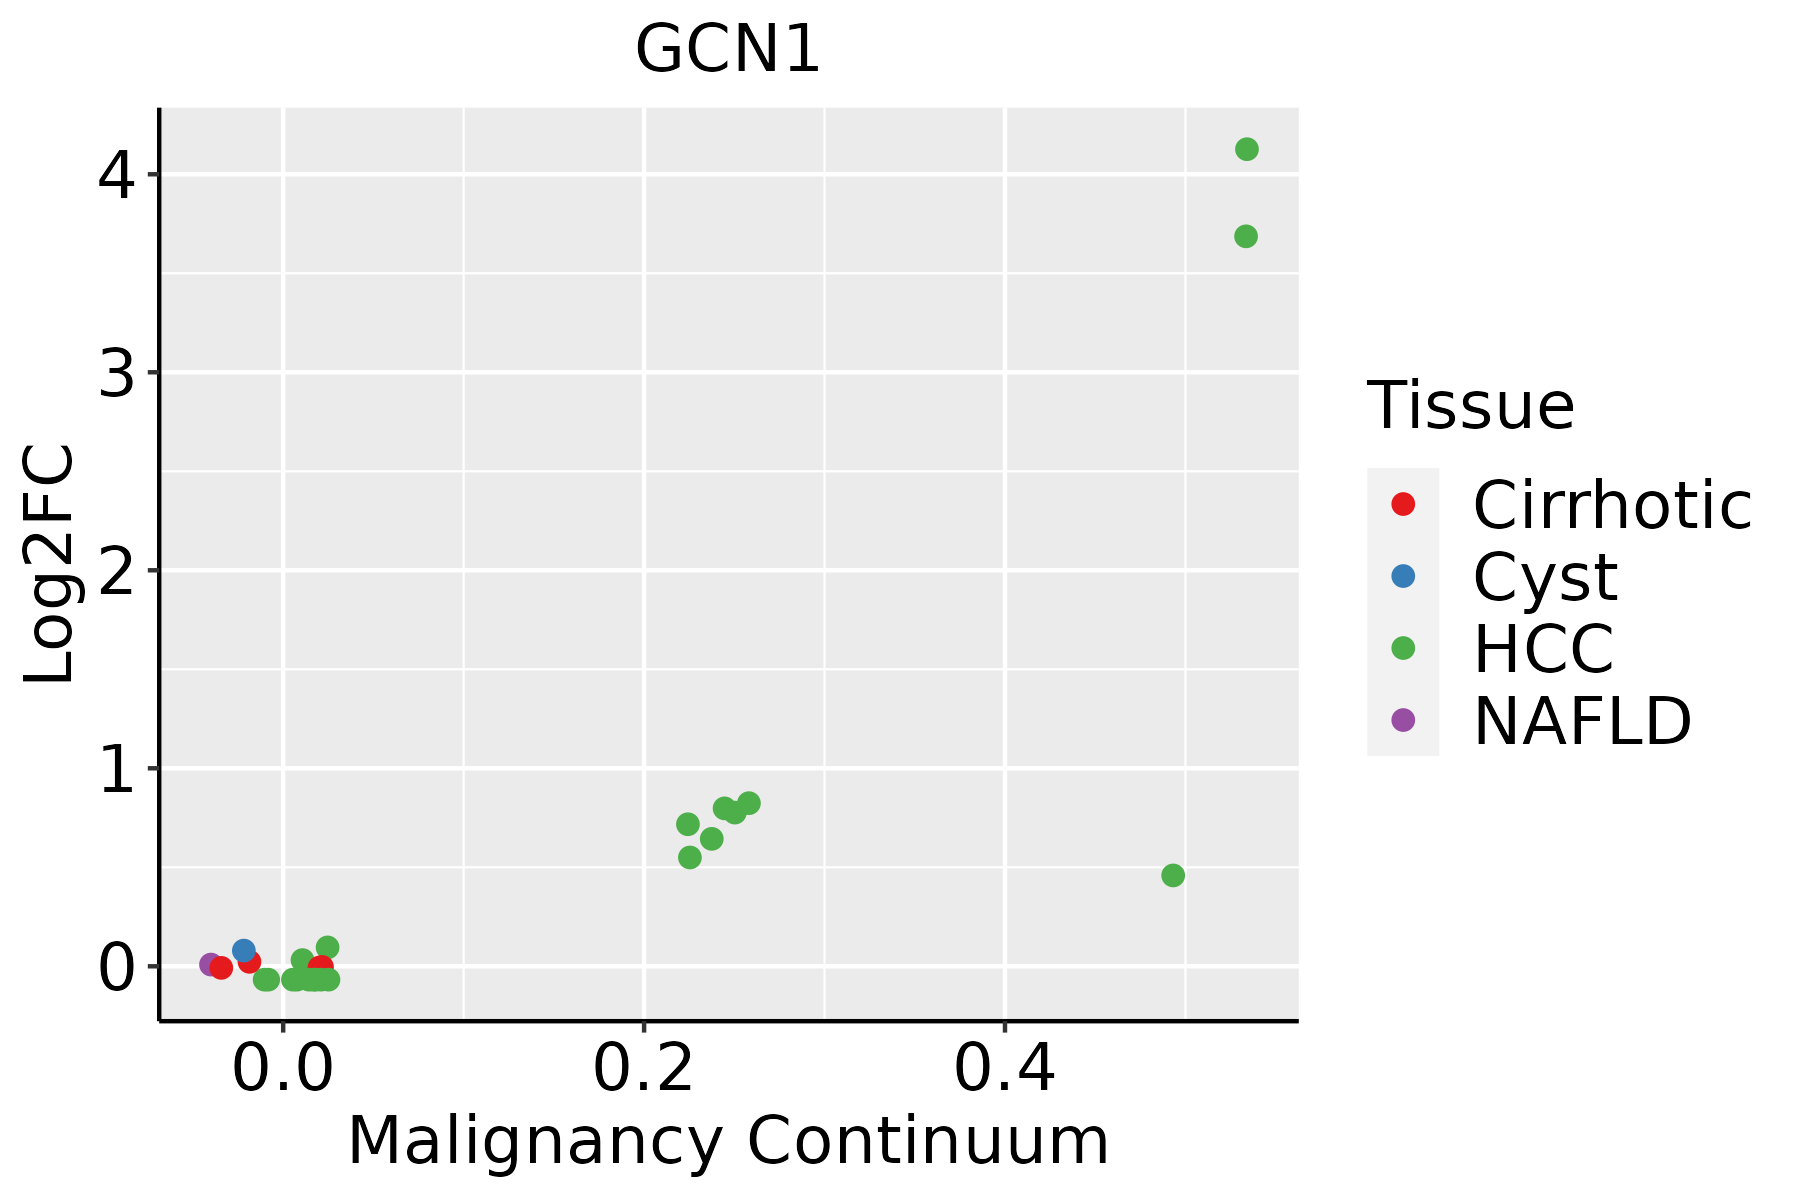 | HCC: Hepatocellular carcinoma |
| NAFLD: Non-alcoholic fatty liver disease |
| Oral Cavity | 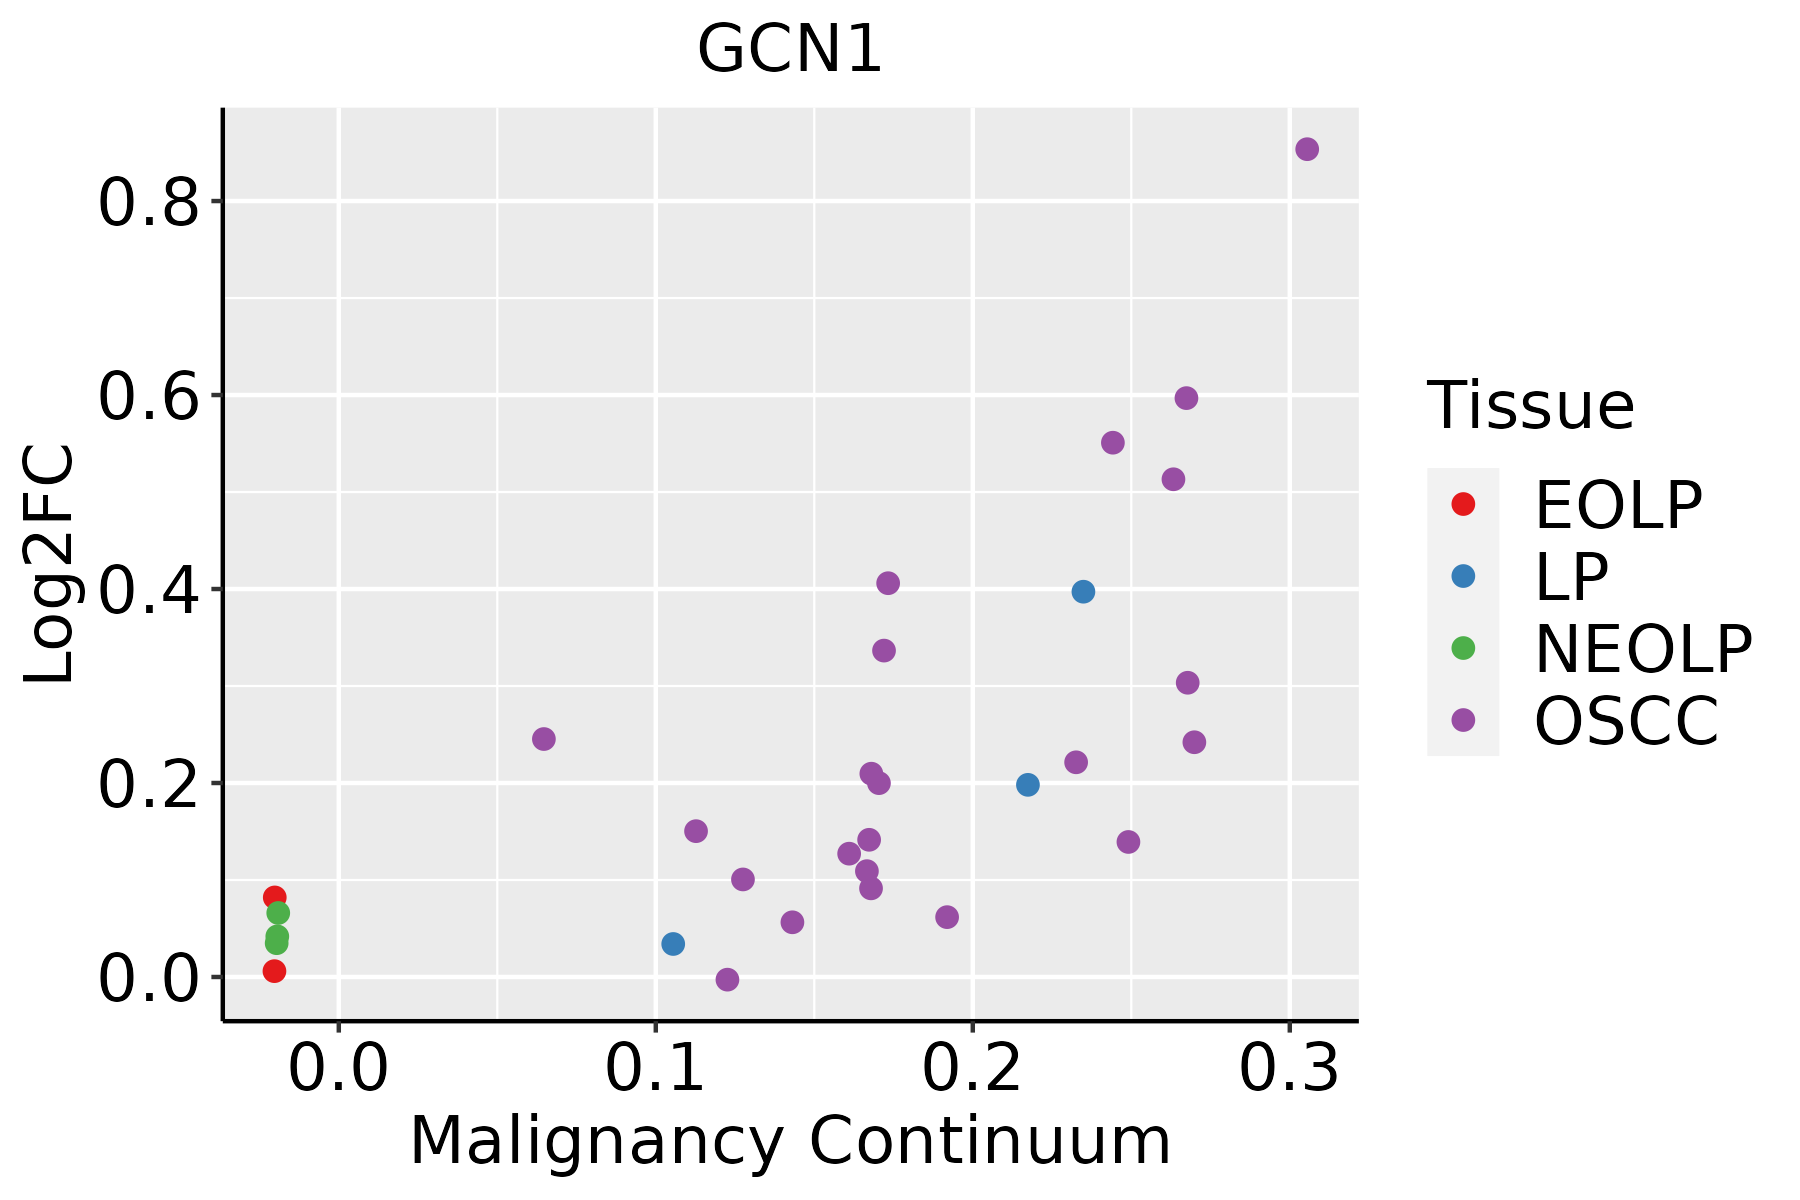 | EOLP: Erosive Oral lichen planus |
| LP: leukoplakia |
| NEOLP: Non-erosive oral lichen planus |
| OSCC: Oral squamous cell carcinoma |
| GO ID | Tissue | Disease Stage | Description | Gene Ratio | Bg Ratio | pvalue | p.adjust | Count |
| GO:0006417 | Colorectum | AD | regulation of translation | 141/3918 | 468/18723 | 1.32e-06 | 4.22e-05 | 141 |
| GO:0031667 | Colorectum | AD | response to nutrient levels | 138/3918 | 474/18723 | 1.22e-05 | 2.68e-04 | 138 |
| GO:0033674 | Colorectum | AD | positive regulation of kinase activity | 131/3918 | 467/18723 | 1.28e-04 | 1.85e-03 | 131 |
| GO:0042594 | Colorectum | AD | response to starvation | 63/3918 | 197/18723 | 1.77e-04 | 2.38e-03 | 63 |
| GO:0043620 | Colorectum | AD | regulation of DNA-templated transcription in response to stress | 23/3918 | 53/18723 | 1.86e-04 | 2.49e-03 | 23 |
| GO:0071496 | Colorectum | AD | cellular response to external stimulus | 94/3918 | 320/18723 | 1.98e-04 | 2.64e-03 | 94 |
| GO:0036003 | Colorectum | AD | positive regulation of transcription from RNA polymerase II promoter in response to stress | 13/3918 | 24/18723 | 3.45e-04 | 4.03e-03 | 13 |
| GO:0009267 | Colorectum | AD | cellular response to starvation | 51/3918 | 156/18723 | 3.90e-04 | 4.44e-03 | 51 |
| GO:0043618 | Colorectum | AD | regulation of transcription from RNA polymerase II promoter in response to stress | 20/3918 | 47/18723 | 6.54e-04 | 6.75e-03 | 20 |
| GO:0031668 | Colorectum | AD | cellular response to extracellular stimulus | 71/3918 | 246/18723 | 1.86e-03 | 1.52e-02 | 71 |
| GO:0031669 | Colorectum | AD | cellular response to nutrient levels | 63/3918 | 215/18723 | 2.19e-03 | 1.73e-02 | 63 |
| GO:00064172 | Colorectum | MSS | regulation of translation | 134/3467 | 468/18723 | 4.43e-08 | 2.38e-06 | 134 |
| GO:00316672 | Colorectum | MSS | response to nutrient levels | 125/3467 | 474/18723 | 1.24e-05 | 2.88e-04 | 125 |
| GO:00336742 | Colorectum | MSS | positive regulation of kinase activity | 122/3467 | 467/18723 | 2.50e-05 | 5.21e-04 | 122 |
| GO:00425942 | Colorectum | MSS | response to starvation | 56/3467 | 197/18723 | 4.25e-04 | 5.21e-03 | 56 |
| GO:00360032 | Colorectum | MSS | positive regulation of transcription from RNA polymerase II promoter in response to stress | 12/3467 | 24/18723 | 4.68e-04 | 5.50e-03 | 12 |
| GO:00436202 | Colorectum | MSS | regulation of DNA-templated transcription in response to stress | 20/3467 | 53/18723 | 7.91e-04 | 8.36e-03 | 20 |
| GO:00714962 | Colorectum | MSS | cellular response to external stimulus | 82/3467 | 320/18723 | 9.30e-04 | 9.44e-03 | 82 |
| GO:00436181 | Colorectum | MSS | regulation of transcription from RNA polymerase II promoter in response to stress | 18/3467 | 47/18723 | 1.17e-03 | 1.13e-02 | 18 |
| GO:00092672 | Colorectum | MSS | cellular response to starvation | 44/3467 | 156/18723 | 1.96e-03 | 1.69e-02 | 44 |
| Hugo Symbol | Variant Class | Variant Classification | dbSNP RS | HGVSc | HGVSp | HGVSp Short | SWISSPROT | BIOTYPE | SIFT | PolyPhen | Tumor Sample Barcode | Tissue | Histology | Sex | Age | Stage | Therapy Types | Drugs | Outcome |
| GCN1 | SNV | Missense_Mutation | | c.4039G>T | p.Ala1347Ser | p.A1347S | Q92616 | protein_coding | deleterious(0.04) | probably_damaging(0.929) | TCGA-A8-A07L-01 | Breast | breast invasive carcinoma | Female | <65 | III/IV | Chemotherapy | | CR |
| GCN1 | SNV | Missense_Mutation | | c.2092N>T | p.Pro698Ser | p.P698S | Q92616 | protein_coding | tolerated(0.17) | benign(0.079) | TCGA-AC-A23H-01 | Breast | breast invasive carcinoma | Female | >=65 | I/II | Unknown | Unknown | PD |
| GCN1 | SNV | Missense_Mutation | | c.3985N>G | p.His1329Asp | p.H1329D | Q92616 | protein_coding | deleterious(0) | probably_damaging(0.999) | TCGA-AO-A03T-01 | Breast | breast invasive carcinoma | Female | <65 | I/II | Chemotherapy | cyclophosphamide | SD |
| GCN1 | SNV | Missense_Mutation | novel | c.2132N>T | p.Pro711Leu | p.P711L | Q92616 | protein_coding | tolerated(0.21) | benign(0.098) | TCGA-AO-A0JB-01 | Breast | breast invasive carcinoma | Female | <65 | III/IV | Chemotherapy | cyclophosphamide | SD |
| GCN1 | SNV | Missense_Mutation | rs770357732 | c.7949N>A | p.Arg2650Lys | p.R2650K | Q92616 | protein_coding | tolerated(1) | benign(0.062) | TCGA-AO-A124-01 | Breast | breast invasive carcinoma | Female | <65 | I/II | Chemotherapy | doxorubicin | SD |
| GCN1 | SNV | Missense_Mutation | | c.1711G>A | p.Ala571Thr | p.A571T | Q92616 | protein_coding | tolerated(0.39) | benign(0.013) | TCGA-AR-A251-01 | Breast | breast invasive carcinoma | Female | <65 | III/IV | Chemotherapy | doxorubicin | SD |
| GCN1 | SNV | Missense_Mutation | | c.1175N>T | p.Pro392Leu | p.P392L | Q92616 | protein_coding | deleterious(0.05) | benign(0.015) | TCGA-BH-A0HF-01 | Breast | breast invasive carcinoma | Female | >=65 | I/II | Hormone Therapy | arimidex | SD |
| GCN1 | SNV | Missense_Mutation | novel | c.221N>C | p.Ile74Thr | p.I74T | Q92616 | protein_coding | deleterious(0) | possibly_damaging(0.599) | TCGA-BH-A18G-01 | Breast | breast invasive carcinoma | Female | >=65 | I/II | Unknown | Unknown | SD |
| GCN1 | SNV | Missense_Mutation | | c.3531N>T | p.Gln1177His | p.Q1177H | Q92616 | protein_coding | tolerated(0.05) | benign(0.082) | TCGA-D8-A1Y1-01 | Breast | breast invasive carcinoma | Female | >=65 | III/IV | Hormone Therapy | tamoxiphen | PD |
| GCN1 | SNV | Missense_Mutation | | c.3528N>T | p.Arg1176Ser | p.R1176S | Q92616 | protein_coding | deleterious(0.03) | probably_damaging(0.994) | TCGA-E2-A1L6-01 | Breast | breast invasive carcinoma | Female | <65 | I/II | Chemotherapy | cyclophosphamide | SD |


