
|
|||||
|
 | |
| |
| |
| |
| |
| |
|
Gene: GATAD1 |
Gene summary for GATAD1 |
| Gene information | Species | Human | Gene symbol | GATAD1 | Gene ID | 57798 |
| Gene name | GATA zinc finger domain containing 1 | |
| Gene Alias | CMD2B | |
| Cytomap | 7q21.2 | |
| Gene Type | protein-coding | GO ID | GO:0006139 | UniProtAcc | Q8WUU5 |
Top |
Malignant transformation analysis |
| Identification of the aberrant gene expression in precancerous and cancerous lesions by comparing the gene expression of stem-like cells in diseased tissues with normal stem cells |
| Entrez ID | Symbol | Replicates | Species | Organ | Tissue | Adj P-value | Log2FC | Malignancy |
| 57798 | GATAD1 | HCC1 | Human | Liver | HCC | 1.68e-09 | 2.77e+00 | 0.5336 |
| 57798 | GATAD1 | HCC2 | Human | Liver | HCC | 8.95e-28 | 4.77e+00 | 0.5341 |
| 57798 | GATAD1 | HCC5 | Human | Liver | HCC | 3.99e-17 | 2.74e+00 | 0.4932 |
| 57798 | GATAD1 | Pt13.b | Human | Liver | HCC | 5.55e-03 | -5.34e-02 | 0.0251 |
| 57798 | GATAD1 | S014 | Human | Liver | HCC | 5.94e-06 | 5.29e-01 | 0.2254 |
| 57798 | GATAD1 | S015 | Human | Liver | HCC | 9.33e-06 | 6.06e-01 | 0.2375 |
| 57798 | GATAD1 | S016 | Human | Liver | HCC | 2.07e-05 | 5.12e-01 | 0.2243 |
| 57798 | GATAD1 | S027 | Human | Liver | HCC | 2.89e-02 | 5.57e-01 | 0.2446 |
| 57798 | GATAD1 | S028 | Human | Liver | HCC | 1.05e-08 | 6.19e-01 | 0.2503 |
| 57798 | GATAD1 | S029 | Human | Liver | HCC | 7.90e-03 | 4.38e-01 | 0.2581 |
| 57798 | GATAD1 | C04 | Human | Oral cavity | OSCC | 3.86e-03 | 3.23e-01 | 0.2633 |
| 57798 | GATAD1 | C21 | Human | Oral cavity | OSCC | 7.04e-05 | 3.23e-01 | 0.2678 |
| 57798 | GATAD1 | C30 | Human | Oral cavity | OSCC | 2.12e-14 | 6.79e-01 | 0.3055 |
| 57798 | GATAD1 | C38 | Human | Oral cavity | OSCC | 1.90e-02 | 5.05e-01 | 0.172 |
| 57798 | GATAD1 | C46 | Human | Oral cavity | OSCC | 1.03e-06 | 3.06e-01 | 0.1673 |
| 57798 | GATAD1 | C51 | Human | Oral cavity | OSCC | 1.24e-02 | 2.09e-01 | 0.2674 |
| 57798 | GATAD1 | C57 | Human | Oral cavity | OSCC | 4.35e-06 | 2.75e-01 | 0.1679 |
| 57798 | GATAD1 | C08 | Human | Oral cavity | OSCC | 4.18e-24 | 4.55e-01 | 0.1919 |
| 57798 | GATAD1 | C09 | Human | Oral cavity | OSCC | 4.00e-03 | 2.18e-01 | 0.1431 |
| 57798 | GATAD1 | SYSMH1 | Human | Oral cavity | OSCC | 3.17e-26 | 6.46e-01 | 0.1127 |
| Page: 1 2 3 4 5 6 |
| Tissue | Expression Dynamics | Abbreviation |
| Esophagus | 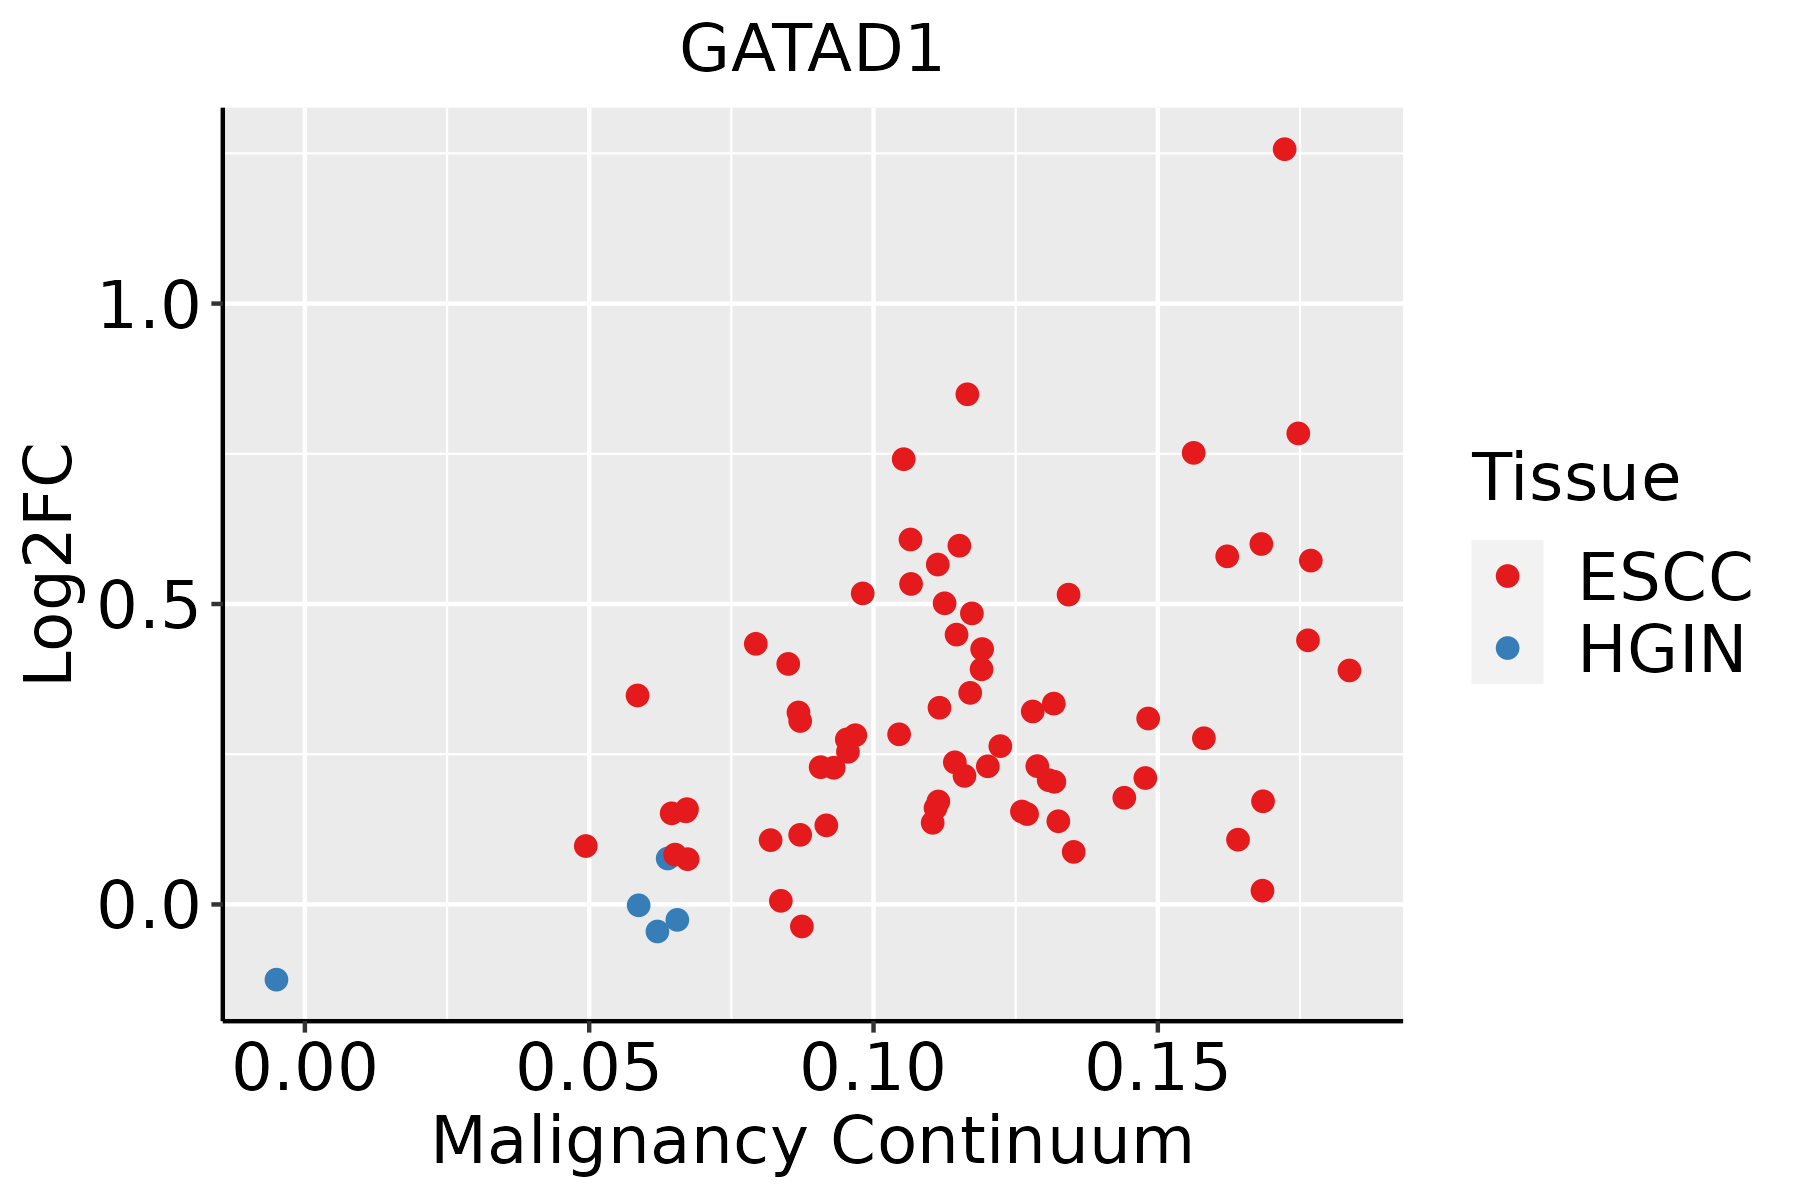 | ESCC: Esophageal squamous cell carcinoma |
| HGIN: High-grade intraepithelial neoplasias | ||
| LGIN: Low-grade intraepithelial neoplasias | ||
| Liver | 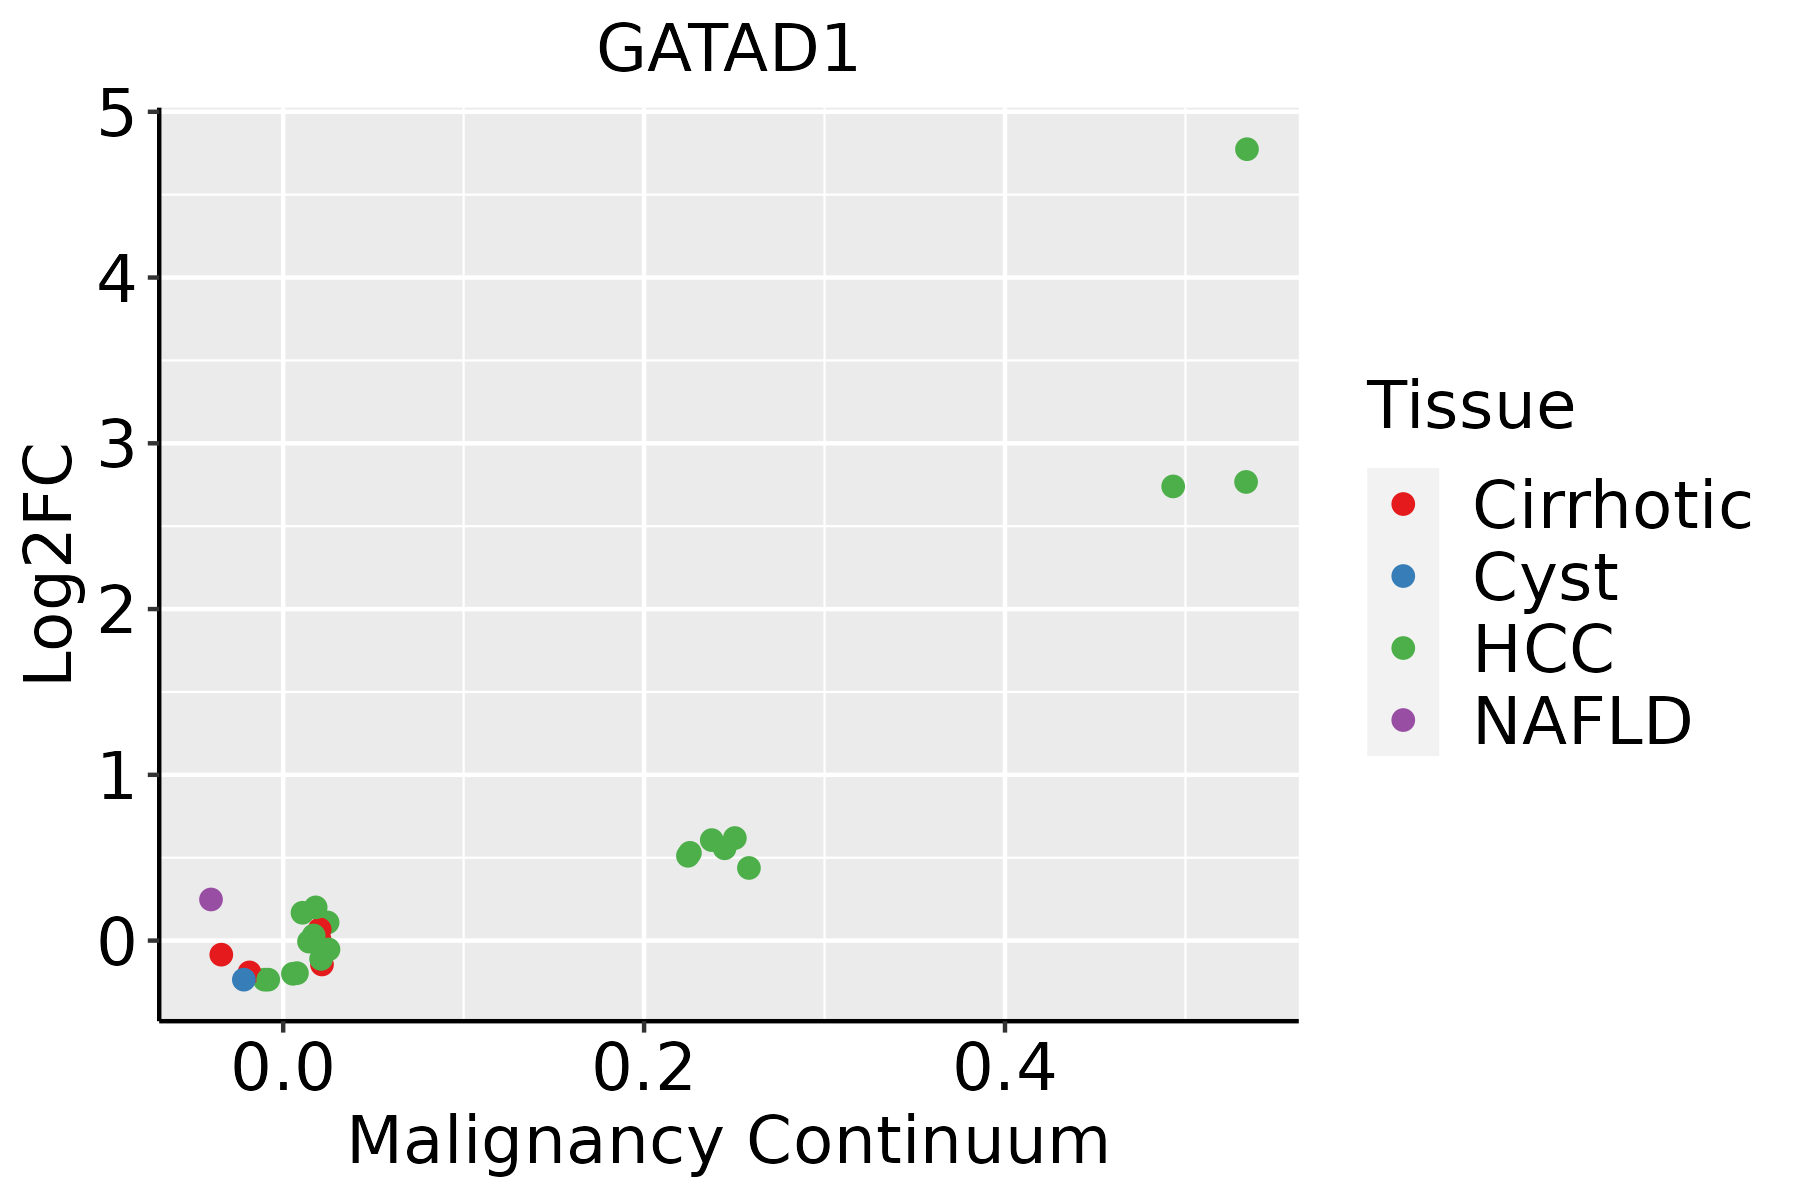 | HCC: Hepatocellular carcinoma |
| NAFLD: Non-alcoholic fatty liver disease | ||
| Oral Cavity |  | EOLP: Erosive Oral lichen planus |
| LP: leukoplakia | ||
| NEOLP: Non-erosive oral lichen planus | ||
| OSCC: Oral squamous cell carcinoma | ||
| Thyroid | 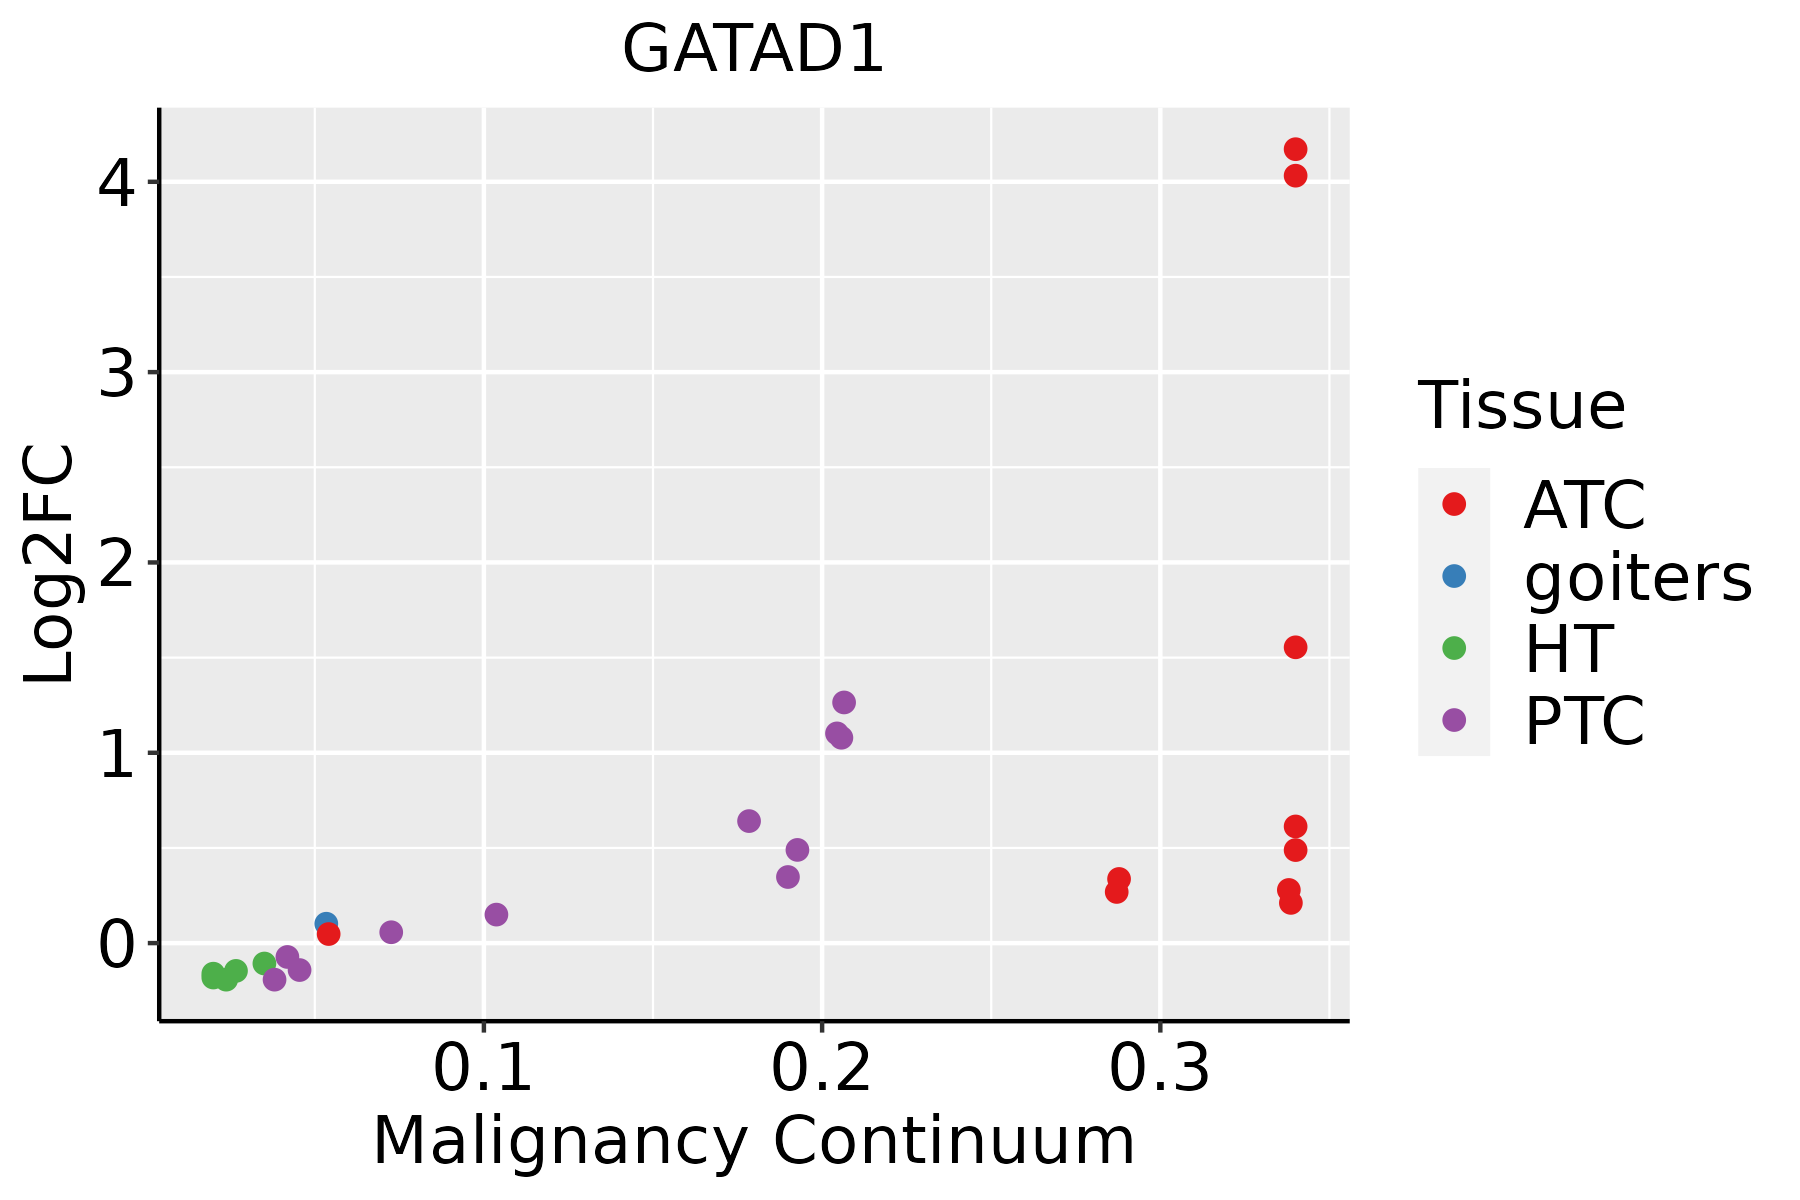 | ATC: Anaplastic thyroid cancer |
| HT: Hashimoto's thyroiditis | ||
| PTC: Papillary thyroid cancer |
| ∗log2FC in expression of this searched gene in stem-like cells from each diseased tissue sample relative to stem-like cells in normal samples in each tissue plotted against the malignancy continuum. Samples are colored based on if they are from different disease stage. |
Top |
Malignant transformation related pathway analysis |
| Find out the enriched GO biological processes and KEGG pathways involved in transition from healthy to precancer to cancer |
| Tissue | Disease Stage | Enriched GO biological Processes |
| Colorectum | AD |  |
| Colorectum | SER |  |
| Colorectum | MSS |  |
| Colorectum | MSI-H |  |
| Colorectum | FAP |  |
| ∗Top 15 enriched GO BP terms are showed in the bar plot of each disease state in each tissue. Each row represents a significant GO biological process which is colored according to the -log10(p.adjust). |
| Page: 1 2 3 4 5 6 7 8 9 |
| GO ID | Tissue | Disease Stage | Description | Gene Ratio | Bg Ratio | pvalue | p.adjust | Count |
| GO:000632517 | Esophagus | ESCC | chromatin organization | 240/8552 | 409/18723 | 6.52e-08 | 1.14e-06 | 240 |
| GO:000632511 | Liver | HCC | chromatin organization | 206/7958 | 409/18723 | 7.23e-04 | 4.41e-03 | 206 |
| GO:000632510 | Oral cavity | OSCC | chromatin organization | 190/7305 | 409/18723 | 1.17e-03 | 5.97e-03 | 190 |
| GO:000632520 | Thyroid | PTC | chromatin organization | 183/5968 | 409/18723 | 2.55e-08 | 5.70e-07 | 183 |
| GO:00063385 | Thyroid | PTC | chromatin remodeling | 106/5968 | 255/18723 | 6.56e-04 | 4.13e-03 | 106 |
| GO:0006325110 | Thyroid | ATC | chromatin organization | 189/6293 | 409/18723 | 6.40e-08 | 1.13e-06 | 189 |
| GO:000633813 | Thyroid | ATC | chromatin remodeling | 109/6293 | 255/18723 | 1.38e-03 | 7.15e-03 | 109 |
| Page: 1 |
| Pathway ID | Tissue | Disease Stage | Description | Gene Ratio | Bg Ratio | pvalue | p.adjust | qvalue | Count |
| Page: 1 |
Top |
Cell-cell communication analysis |
| Identification of potential cell-cell interactions between two cell types and their ligand-receptor pairs for different disease states |
| Ligand | Receptor | LRpair | Pathway | Tissue | Disease Stage |
| Page: 1 |
Top |
Single-cell gene regulatory network inference analysis |
| Find out the significant the regulons (TFs) and the target genes of each regulon across cell types for different disease states |
| TF | Cell Type | Tissue | Disease Stage | Target Gene | RSS | Regulon Activity |
| ∗The dot plots of a searched regulon are shown for all cell subpopulations in each disease state of each tissue based on the regulon specific score inferred using pySCENIC and by calculating the average expression. |
| Page: 1 |
Top |
Somatic mutation of malignant transformation related genes |
| Annotation of somatic variants for genes involved in malignant transformation |
| Hugo Symbol | Variant Class | Variant Classification | dbSNP RS | HGVSc | HGVSp | HGVSp Short | SWISSPROT | BIOTYPE | SIFT | PolyPhen | Tumor Sample Barcode | Tissue | Histology | Sex | Age | Stage | Therapy Types | Drugs | Outcome |
| GATAD1 | SNV | Missense_Mutation | c.505C>G | p.Gln169Glu | p.Q169E | Q8WUU5 | protein_coding | deleterious(0) | probably_damaging(0.952) | TCGA-AN-A0XW-01 | Breast | breast invasive carcinoma | Female | <65 | III/IV | Unknown | Unknown | SD | |
| GATAD1 | deletion | Frame_Shift_Del | novel | c.665_671delNNNNNNN | p.Cys223HisfsTer35 | p.C223Hfs*35 | Q8WUU5 | protein_coding | TCGA-Q1-A5R2-01 | Cervix | cervical & endocervical cancer | Female | <65 | I/II | Chemotherapy | cisplatin | PR | ||
| GATAD1 | SNV | Missense_Mutation | c.305C>T | p.Ser102Phe | p.S102F | Q8WUU5 | protein_coding | deleterious(0.05) | probably_damaging(0.979) | TCGA-DM-A285-01 | Colorectum | colon adenocarcinoma | Female | >=65 | III/IV | Unknown | Unknown | SD | |
| GATAD1 | insertion | Frame_Shift_Ins | novel | c.598_599insGTAATAT | p.Asp200GlyfsTer31 | p.D200Gfs*31 | Q8WUU5 | protein_coding | TCGA-AM-5820-01 | Colorectum | colon adenocarcinoma | Female | <65 | I/II | Unknown | Unknown | SD | ||
| GATAD1 | SNV | Missense_Mutation | novel | c.467C>A | p.Ser156Tyr | p.S156Y | Q8WUU5 | protein_coding | deleterious(0) | possibly_damaging(0.656) | TCGA-A5-A2K5-01 | Endometrium | uterine corpus endometrioid carcinoma | Female | >=65 | I/II | Unknown | Unknown | SD |
| GATAD1 | SNV | Missense_Mutation | novel | c.688T>G | p.Phe230Val | p.F230V | Q8WUU5 | protein_coding | deleterious(0) | possibly_damaging(0.446) | TCGA-BK-A6W3-01 | Endometrium | uterine corpus endometrioid carcinoma | Female | <65 | I/II | Unknown | Unknown | SD |
| GATAD1 | SNV | Missense_Mutation | rs780188711 | c.578N>G | p.Ser193Cys | p.S193C | Q8WUU5 | protein_coding | deleterious(0.01) | benign(0.219) | TCGA-05-4382-01 | Lung | lung adenocarcinoma | Male | >=65 | I/II | Unknown | Unknown | PD |
| GATAD1 | SNV | Missense_Mutation | c.381N>G | p.Ile127Met | p.I127M | Q8WUU5 | protein_coding | tolerated(0.09) | possibly_damaging(0.809) | TCGA-05-4430-01 | Lung | lung adenocarcinoma | Female | <65 | I/II | Unknown | Unknown | SD | |
| GATAD1 | SNV | Missense_Mutation | novel | c.604N>T | p.Ala202Ser | p.A202S | Q8WUU5 | protein_coding | tolerated(0.36) | benign(0.015) | TCGA-69-8255-01 | Lung | lung adenocarcinoma | Male | >=65 | I/II | Unknown | Unknown | SD |
| GATAD1 | SNV | Missense_Mutation | novel | c.690C>G | p.Phe230Leu | p.F230L | Q8WUU5 | protein_coding | deleterious(0.01) | benign(0.056) | TCGA-CR-7388-01 | Oral cavity | head & neck squamous cell carcinoma | Female | >=65 | I/II | Chemotherapy | carboplatin | PD |
| Page: 1 2 |
Top |
Related drugs of malignant transformation related genes |
| Identification of chemicals and drugs interact with genes involved in malignant transfromation |
| (DGIdb 4.0) |
| Entrez ID | Symbol | Category | Interaction Types | Drug Claim Name | Drug Name | PMIDs |
| Page: 1 |

Copyright 2023-Present -The University of Texas Health Science Center at Houston |