
|
|||||
|
 | |
| |
| |
| |
| |
| |
|
Gene: FTSJ3 |
Gene summary for FTSJ3 |
| Gene information | Species | Human | Gene symbol | FTSJ3 | Gene ID | 117246 |
| Gene name | FtsJ RNA 2'-O-methyltransferase 3 | |
| Gene Alias | EPCS3 | |
| Cytomap | 17q23.3 | |
| Gene Type | protein-coding | GO ID | GO:0000154 | UniProtAcc | Q8IY81 |
Top |
Malignant transformation analysis |
| Identification of the aberrant gene expression in precancerous and cancerous lesions by comparing the gene expression of stem-like cells in diseased tissues with normal stem cells |
| Entrez ID | Symbol | Replicates | Species | Organ | Tissue | Adj P-value | Log2FC | Malignancy |
| 117246 | FTSJ3 | P128T-E | Human | Esophagus | ESCC | 3.54e-43 | 1.19e+00 | 0.1241 |
| 117246 | FTSJ3 | P130T-E | Human | Esophagus | ESCC | 1.54e-47 | 9.98e-01 | 0.1676 |
| 117246 | FTSJ3 | HCC1_Meng | Human | Liver | HCC | 6.72e-49 | 6.26e-02 | 0.0246 |
| 117246 | FTSJ3 | HCC2_Meng | Human | Liver | HCC | 4.53e-11 | 1.97e-02 | 0.0107 |
| 117246 | FTSJ3 | HCC1 | Human | Liver | HCC | 2.53e-04 | 3.33e+00 | 0.5336 |
| 117246 | FTSJ3 | HCC2 | Human | Liver | HCC | 3.28e-11 | 3.48e+00 | 0.5341 |
| 117246 | FTSJ3 | S014 | Human | Liver | HCC | 1.12e-20 | 7.59e-01 | 0.2254 |
| 117246 | FTSJ3 | S015 | Human | Liver | HCC | 8.07e-12 | 7.61e-01 | 0.2375 |
| 117246 | FTSJ3 | S016 | Human | Liver | HCC | 7.57e-18 | 7.46e-01 | 0.2243 |
| 117246 | FTSJ3 | S027 | Human | Liver | HCC | 1.24e-07 | 8.86e-01 | 0.2446 |
| 117246 | FTSJ3 | S028 | Human | Liver | HCC | 2.36e-21 | 9.15e-01 | 0.2503 |
| 117246 | FTSJ3 | S029 | Human | Liver | HCC | 1.04e-16 | 8.28e-01 | 0.2581 |
| 117246 | FTSJ3 | C04 | Human | Oral cavity | OSCC | 2.23e-09 | 4.70e-01 | 0.2633 |
| 117246 | FTSJ3 | C21 | Human | Oral cavity | OSCC | 2.58e-25 | 7.70e-01 | 0.2678 |
| 117246 | FTSJ3 | C30 | Human | Oral cavity | OSCC | 2.08e-37 | 1.35e+00 | 0.3055 |
| 117246 | FTSJ3 | C38 | Human | Oral cavity | OSCC | 3.34e-04 | 8.11e-01 | 0.172 |
| 117246 | FTSJ3 | C43 | Human | Oral cavity | OSCC | 1.87e-25 | 5.40e-01 | 0.1704 |
| 117246 | FTSJ3 | C46 | Human | Oral cavity | OSCC | 1.59e-15 | 4.57e-01 | 0.1673 |
| 117246 | FTSJ3 | C51 | Human | Oral cavity | OSCC | 1.21e-12 | 6.04e-01 | 0.2674 |
| 117246 | FTSJ3 | C57 | Human | Oral cavity | OSCC | 6.01e-03 | 2.32e-01 | 0.1679 |
| Page: 1 2 3 4 5 |
| Tissue | Expression Dynamics | Abbreviation |
| Esophagus |  | ESCC: Esophageal squamous cell carcinoma |
| HGIN: High-grade intraepithelial neoplasias | ||
| LGIN: Low-grade intraepithelial neoplasias | ||
| Liver | 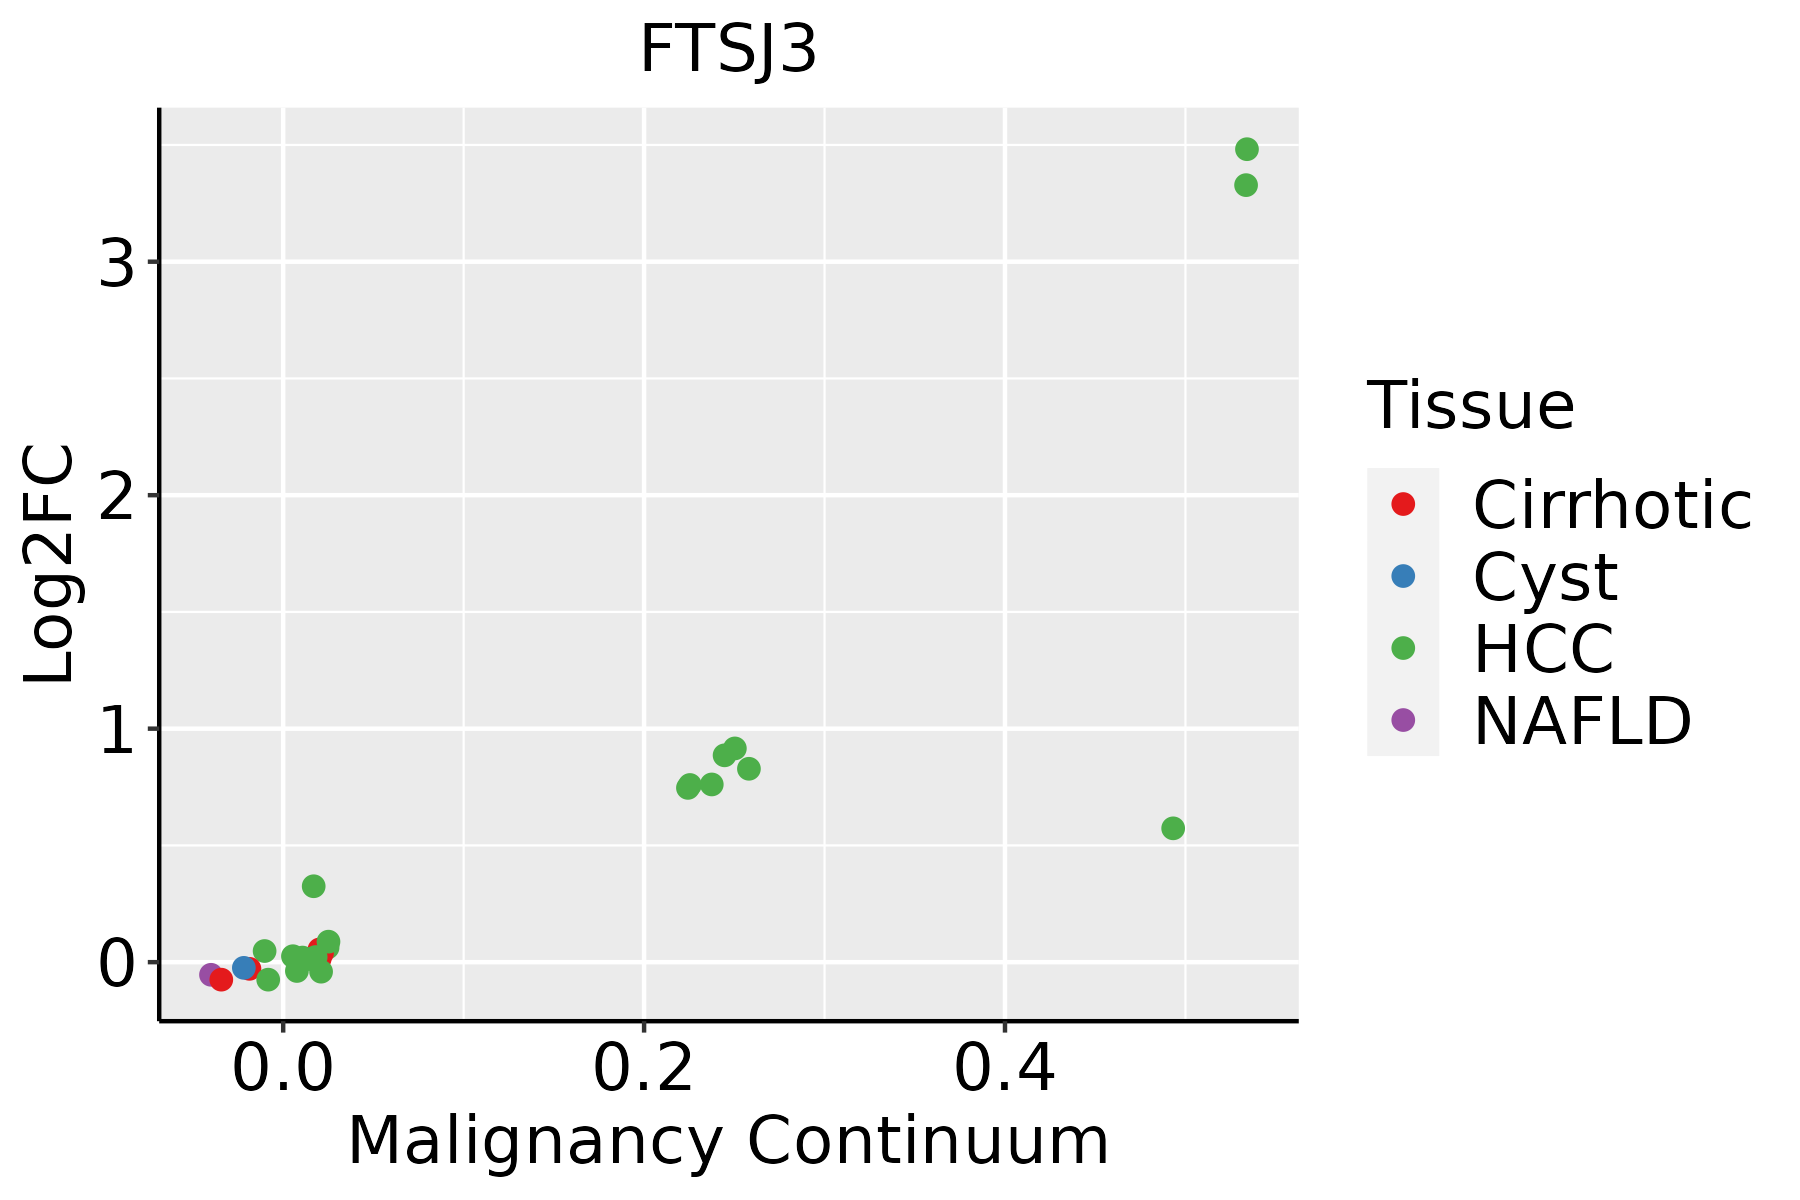 | HCC: Hepatocellular carcinoma |
| NAFLD: Non-alcoholic fatty liver disease | ||
| Oral Cavity |  | EOLP: Erosive Oral lichen planus |
| LP: leukoplakia | ||
| NEOLP: Non-erosive oral lichen planus | ||
| OSCC: Oral squamous cell carcinoma | ||
| Skin | 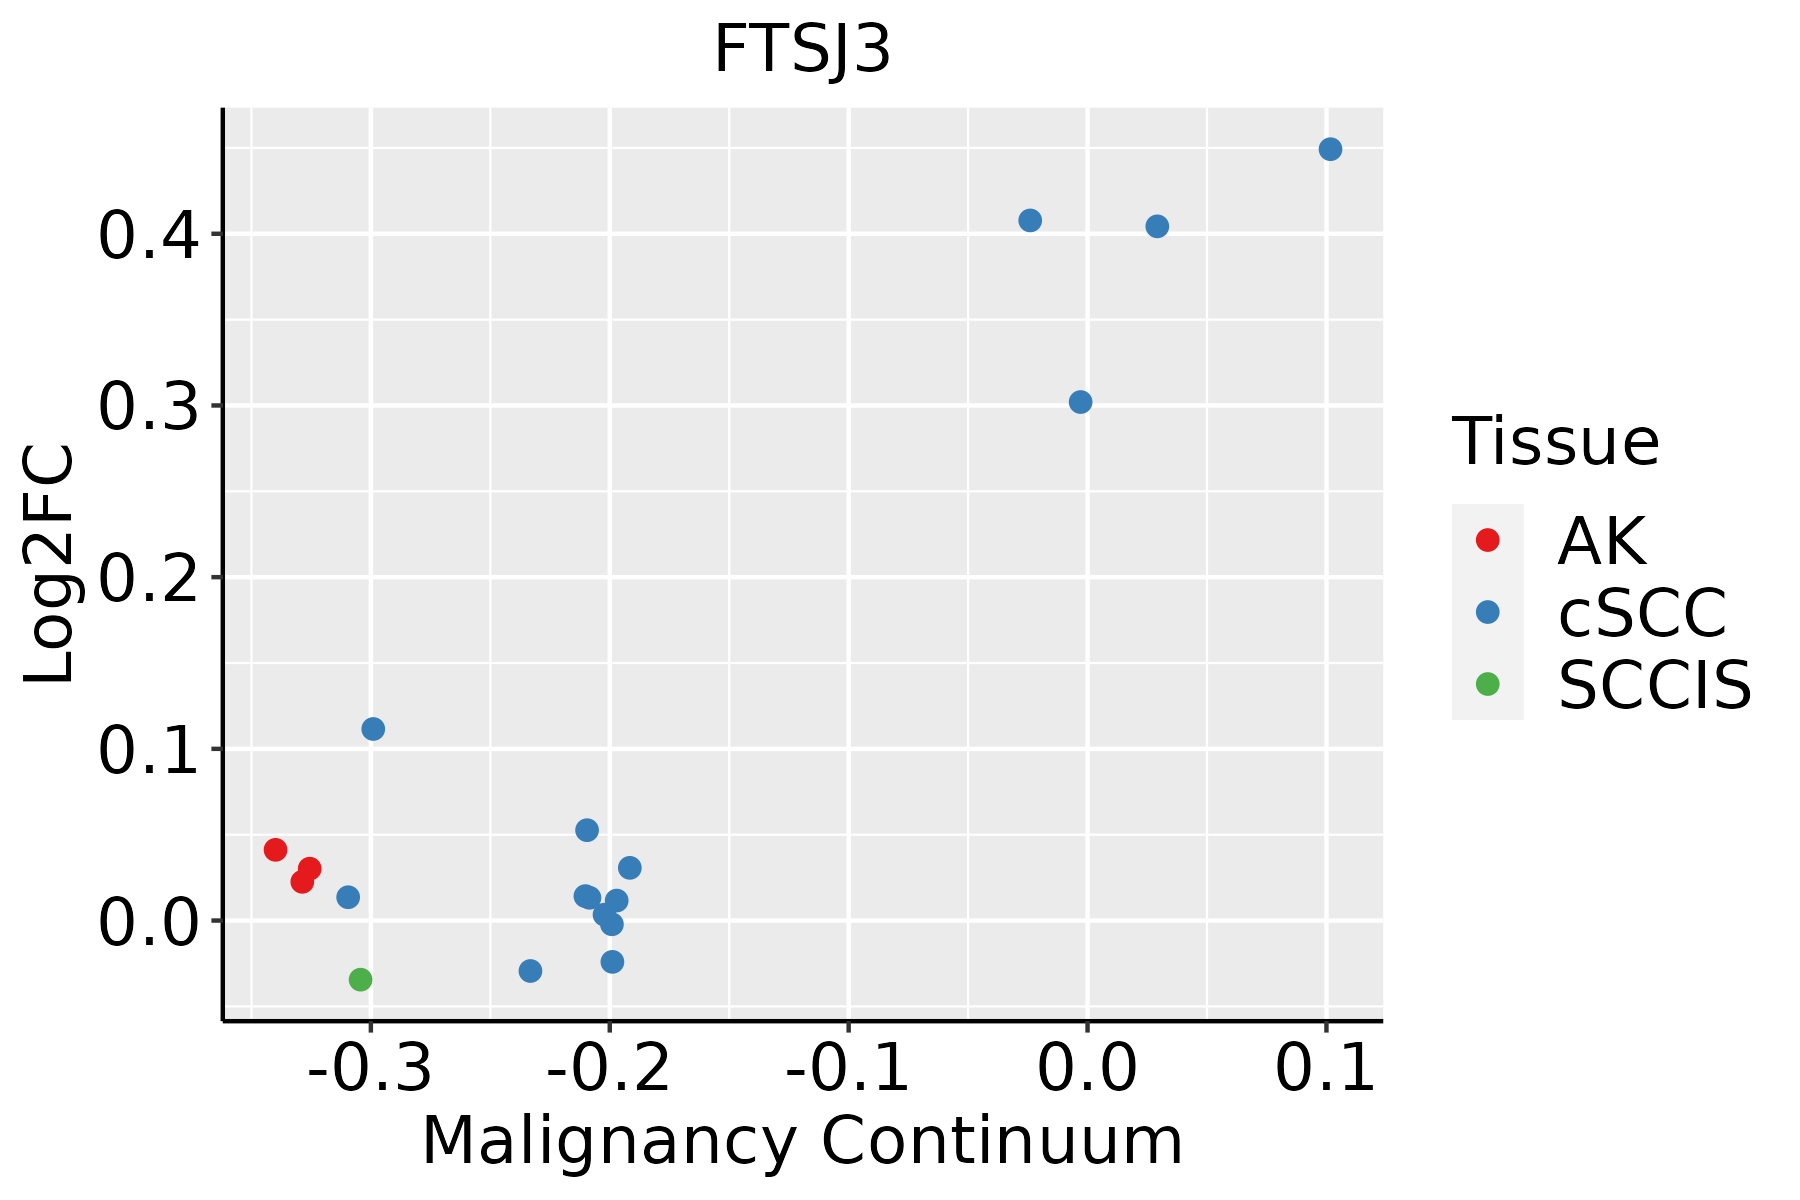 | AK: Actinic keratosis |
| cSCC: Cutaneous squamous cell carcinoma | ||
| SCCIS:squamous cell carcinoma in situ |
| ∗log2FC in expression of this searched gene in stem-like cells from each diseased tissue sample relative to stem-like cells in normal samples in each tissue plotted against the malignancy continuum. Samples are colored based on if they are from different disease stage. |
Top |
Malignant transformation related pathway analysis |
| Find out the enriched GO biological processes and KEGG pathways involved in transition from healthy to precancer to cancer |
| Tissue | Disease Stage | Enriched GO biological Processes |
| Colorectum | AD |  |
| Colorectum | SER |  |
| Colorectum | MSS |  |
| Colorectum | MSI-H |  |
| Colorectum | FAP |  |
| ∗Top 15 enriched GO BP terms are showed in the bar plot of each disease state in each tissue. Each row represents a significant GO biological process which is colored according to the -log10(p.adjust). |
| Page: 1 2 3 4 5 6 7 8 9 |
| GO ID | Tissue | Disease Stage | Description | Gene Ratio | Bg Ratio | pvalue | p.adjust | Count |
| GO:0022613111 | Esophagus | ESCC | ribonucleoprotein complex biogenesis | 365/8552 | 463/18723 | 1.74e-49 | 1.11e-45 | 365 |
| GO:0042254111 | Esophagus | ESCC | ribosome biogenesis | 252/8552 | 299/18723 | 3.27e-44 | 1.04e-40 | 252 |
| GO:003447015 | Esophagus | ESCC | ncRNA processing | 300/8552 | 395/18723 | 3.09e-35 | 3.26e-32 | 300 |
| GO:0016072110 | Esophagus | ESCC | rRNA metabolic process | 197/8552 | 236/18723 | 1.31e-33 | 1.18e-30 | 197 |
| GO:0006364110 | Esophagus | ESCC | rRNA processing | 189/8552 | 225/18723 | 4.88e-33 | 3.87e-30 | 189 |
| GO:003466012 | Esophagus | ESCC | ncRNA metabolic process | 346/8552 | 485/18723 | 4.35e-31 | 2.51e-28 | 346 |
| GO:0042273111 | Esophagus | ESCC | ribosomal large subunit biogenesis | 65/8552 | 72/18723 | 1.53e-15 | 9.82e-14 | 65 |
| GO:00434143 | Esophagus | ESCC | macromolecule methylation | 199/8552 | 316/18723 | 3.44e-10 | 9.57e-09 | 199 |
| GO:00322592 | Esophagus | ESCC | methylation | 222/8552 | 364/18723 | 2.26e-09 | 5.09e-08 | 222 |
| GO:00094512 | Esophagus | ESCC | RNA modification | 114/8552 | 167/18723 | 2.76e-09 | 6.04e-08 | 114 |
| GO:000047016 | Esophagus | ESCC | maturation of LSU-rRNA | 27/8552 | 28/18723 | 9.94e-09 | 2.00e-07 | 27 |
| GO:00004603 | Esophagus | ESCC | maturation of 5.8S rRNA | 30/8552 | 35/18723 | 1.07e-06 | 1.34e-05 | 30 |
| GO:00015101 | Esophagus | ESCC | RNA methylation | 58/8552 | 83/18723 | 6.87e-06 | 6.94e-05 | 58 |
| GO:00004634 | Esophagus | ESCC | maturation of LSU-rRNA from tricistronic rRNA transcript (SSU-rRNA, 5.8S rRNA, LSU-rRNA) | 15/8552 | 15/18723 | 7.81e-06 | 7.69e-05 | 15 |
| GO:00004663 | Esophagus | ESCC | maturation of 5.8S rRNA from tricistronic rRNA transcript (SSU-rRNA, 5.8S rRNA, LSU-rRNA) | 21/8552 | 24/18723 | 2.57e-05 | 2.17e-04 | 21 |
| GO:0000154 | Esophagus | ESCC | rRNA modification | 26/8552 | 37/18723 | 2.16e-03 | 9.62e-03 | 26 |
| GO:002261322 | Liver | HCC | ribonucleoprotein complex biogenesis | 355/7958 | 463/18723 | 7.76e-52 | 4.92e-48 | 355 |
| GO:004225422 | Liver | HCC | ribosome biogenesis | 246/7958 | 299/18723 | 4.99e-46 | 1.58e-42 | 246 |
| GO:00344702 | Liver | HCC | ncRNA processing | 293/7958 | 395/18723 | 4.26e-38 | 6.76e-35 | 293 |
| GO:001607212 | Liver | HCC | rRNA metabolic process | 193/7958 | 236/18723 | 1.26e-35 | 1.14e-32 | 193 |
| Page: 1 2 3 |
| Pathway ID | Tissue | Disease Stage | Description | Gene Ratio | Bg Ratio | pvalue | p.adjust | qvalue | Count |
| Page: 1 |
Top |
Cell-cell communication analysis |
| Identification of potential cell-cell interactions between two cell types and their ligand-receptor pairs for different disease states |
| Ligand | Receptor | LRpair | Pathway | Tissue | Disease Stage |
| Page: 1 |
Top |
Single-cell gene regulatory network inference analysis |
| Find out the significant the regulons (TFs) and the target genes of each regulon across cell types for different disease states |
| TF | Cell Type | Tissue | Disease Stage | Target Gene | RSS | Regulon Activity |
| ∗The dot plots of a searched regulon are shown for all cell subpopulations in each disease state of each tissue based on the regulon specific score inferred using pySCENIC and by calculating the average expression. |
| Page: 1 |
Top |
Somatic mutation of malignant transformation related genes |
| Annotation of somatic variants for genes involved in malignant transformation |
| Hugo Symbol | Variant Class | Variant Classification | dbSNP RS | HGVSc | HGVSp | HGVSp Short | SWISSPROT | BIOTYPE | SIFT | PolyPhen | Tumor Sample Barcode | Tissue | Histology | Sex | Age | Stage | Therapy Types | Drugs | Outcome |
| FTSJ3 | SNV | Missense_Mutation | rs148527553 | c.1426N>C | p.Glu476Gln | p.E476Q | Q8IY81 | protein_coding | deleterious(0.02) | benign(0.177) | TCGA-3C-AALI-01 | Breast | breast invasive carcinoma | Female | <65 | I/II | Unspecific | Poly E | Complete Response |
| FTSJ3 | SNV | Missense_Mutation | novel | c.2069N>G | p.Asn690Ser | p.N690S | Q8IY81 | protein_coding | tolerated(0.14) | benign(0.001) | TCGA-A2-A0EX-01 | Breast | breast invasive carcinoma | Female | <65 | I/II | Hormone Therapy | tamoxiphen | SD |
| FTSJ3 | SNV | Missense_Mutation | c.1871N>T | p.Ser624Ile | p.S624I | Q8IY81 | protein_coding | tolerated(0.12) | probably_damaging(0.925) | TCGA-A2-A1G1-01 | Breast | breast invasive carcinoma | Female | >=65 | I/II | Unknown | Unknown | SD | |
| FTSJ3 | SNV | Missense_Mutation | rs776780004 | c.2348N>A | p.Arg783Gln | p.R783Q | Q8IY81 | protein_coding | tolerated(0.07) | benign(0.02) | TCGA-A8-A09D-01 | Breast | breast invasive carcinoma | Female | <65 | I/II | Chemotherapy | doxorubicin | CR |
| FTSJ3 | SNV | Missense_Mutation | c.1019N>C | p.Asp340Ala | p.D340A | Q8IY81 | protein_coding | tolerated(0.09) | benign(0.089) | TCGA-BH-A18G-01 | Breast | breast invasive carcinoma | Female | >=65 | I/II | Unknown | Unknown | SD | |
| FTSJ3 | SNV | Missense_Mutation | c.1804G>C | p.Glu602Gln | p.E602Q | Q8IY81 | protein_coding | tolerated(0.27) | benign(0.01) | TCGA-C8-A27B-01 | Breast | breast invasive carcinoma | Female | <65 | I/II | Chemotherapy | 5-fluorouracil | CR | |
| FTSJ3 | SNV | Missense_Mutation | c.431N>G | p.Ala144Gly | p.A144G | Q8IY81 | protein_coding | deleterious(0.03) | possibly_damaging(0.651) | TCGA-D8-A147-01 | Breast | breast invasive carcinoma | Female | <65 | I/II | Chemotherapy | doxorubicine | SD | |
| FTSJ3 | SNV | Missense_Mutation | c.2382N>C | p.Glu794Asp | p.E794D | Q8IY81 | protein_coding | tolerated(0.08) | probably_damaging(0.967) | TCGA-D8-A1JA-01 | Breast | breast invasive carcinoma | Female | <65 | III/IV | Chemotherapy | adriamycin | PD | |
| FTSJ3 | SNV | Missense_Mutation | novel | c.1454A>G | p.Gln485Arg | p.Q485R | Q8IY81 | protein_coding | tolerated(0.19) | benign(0) | TCGA-D8-A1XK-01 | Breast | breast invasive carcinoma | Female | <65 | I/II | Chemotherapy | doxorubicine+cyclophosphamide | SD |
| FTSJ3 | insertion | In_Frame_Ins | novel | c.1086_1087insACACAGGCTCAGGTTTCCTTCCCAGCTCTACCACCTGGAGCT | p.Glu362_Glu363insThrGlnAlaGlnValSerPheProAlaLeuProProGlyAla | p.E362_E363insTQAQVSFPALPPGA | Q8IY81 | protein_coding | TCGA-AO-A0J9-01 | Breast | breast invasive carcinoma | Female | <65 | III/IV | Chemotherapy | cyclophosphamide | PD |
| Page: 1 2 3 4 5 6 7 8 |
Top |
Related drugs of malignant transformation related genes |
| Identification of chemicals and drugs interact with genes involved in malignant transfromation |
| (DGIdb 4.0) |
| Entrez ID | Symbol | Category | Interaction Types | Drug Claim Name | Drug Name | PMIDs |
| Page: 1 |

Copyright 2023-Present -The University of Texas Health Science Center at Houston |