
|
|||||
|
 | |
| |
| |
| |
| |
| |
|
Gene: FRA10AC1 |
Gene summary for FRA10AC1 |
| Gene information | Species | Human | Gene symbol | FRA10AC1 | Gene ID | 118924 |
| Gene name | FRA10A associated CGG repeat 1 | |
| Gene Alias | C10orf4 | |
| Cytomap | 10q23.33 | |
| Gene Type | protein-coding | GO ID | GO:0006793 | UniProtAcc | Q70Z53 |
Top |
Malignant transformation analysis |
| Identification of the aberrant gene expression in precancerous and cancerous lesions by comparing the gene expression of stem-like cells in diseased tissues with normal stem cells |
| Entrez ID | Symbol | Replicates | Species | Organ | Tissue | Adj P-value | Log2FC | Malignancy |
| 118924 | FRA10AC1 | P130T-E | Human | Esophagus | ESCC | 7.94e-40 | 7.55e-01 | 0.1676 |
| 118924 | FRA10AC1 | S43 | Human | Liver | Cirrhotic | 1.02e-02 | -1.89e-01 | -0.0187 |
| 118924 | FRA10AC1 | HCC1_Meng | Human | Liver | HCC | 4.59e-68 | 1.02e-02 | 0.0246 |
| 118924 | FRA10AC1 | HCC2_Meng | Human | Liver | HCC | 7.02e-21 | -2.42e-02 | 0.0107 |
| 118924 | FRA10AC1 | cirrhotic1 | Human | Liver | Cirrhotic | 2.43e-05 | 1.42e-01 | 0.0202 |
| 118924 | FRA10AC1 | cirrhotic2 | Human | Liver | Cirrhotic | 2.22e-03 | 8.66e-02 | 0.0201 |
| 118924 | FRA10AC1 | cirrhotic3 | Human | Liver | Cirrhotic | 6.12e-03 | -1.46e-02 | 0.0215 |
| 118924 | FRA10AC1 | HCC1 | Human | Liver | HCC | 6.12e-16 | 4.38e+00 | 0.5336 |
| 118924 | FRA10AC1 | HCC2 | Human | Liver | HCC | 2.51e-20 | 4.15e+00 | 0.5341 |
| 118924 | FRA10AC1 | Pt13.b | Human | Liver | HCC | 4.18e-09 | 2.30e-02 | 0.0251 |
| 118924 | FRA10AC1 | Pt14.a | Human | Liver | HCC | 3.78e-04 | 2.34e-01 | 0.0169 |
| 118924 | FRA10AC1 | Pt14.b | Human | Liver | HCC | 2.40e-04 | 1.80e-01 | 0.018 |
| 118924 | FRA10AC1 | S014 | Human | Liver | HCC | 4.92e-08 | 3.10e-01 | 0.2254 |
| 118924 | FRA10AC1 | S015 | Human | Liver | HCC | 4.55e-09 | 6.60e-01 | 0.2375 |
| 118924 | FRA10AC1 | S016 | Human | Liver | HCC | 1.32e-07 | 4.00e-01 | 0.2243 |
| 118924 | FRA10AC1 | S028 | Human | Liver | HCC | 2.31e-04 | 2.42e-01 | 0.2503 |
| 118924 | FRA10AC1 | S029 | Human | Liver | HCC | 3.59e-07 | 5.29e-01 | 0.2581 |
| 118924 | FRA10AC1 | C04 | Human | Oral cavity | OSCC | 9.71e-17 | 9.00e-01 | 0.2633 |
| 118924 | FRA10AC1 | C21 | Human | Oral cavity | OSCC | 7.96e-18 | 7.68e-01 | 0.2678 |
| 118924 | FRA10AC1 | C30 | Human | Oral cavity | OSCC | 2.15e-24 | 1.15e+00 | 0.3055 |
| Page: 1 2 3 4 5 6 |
| Tissue | Expression Dynamics | Abbreviation |
| Esophagus | 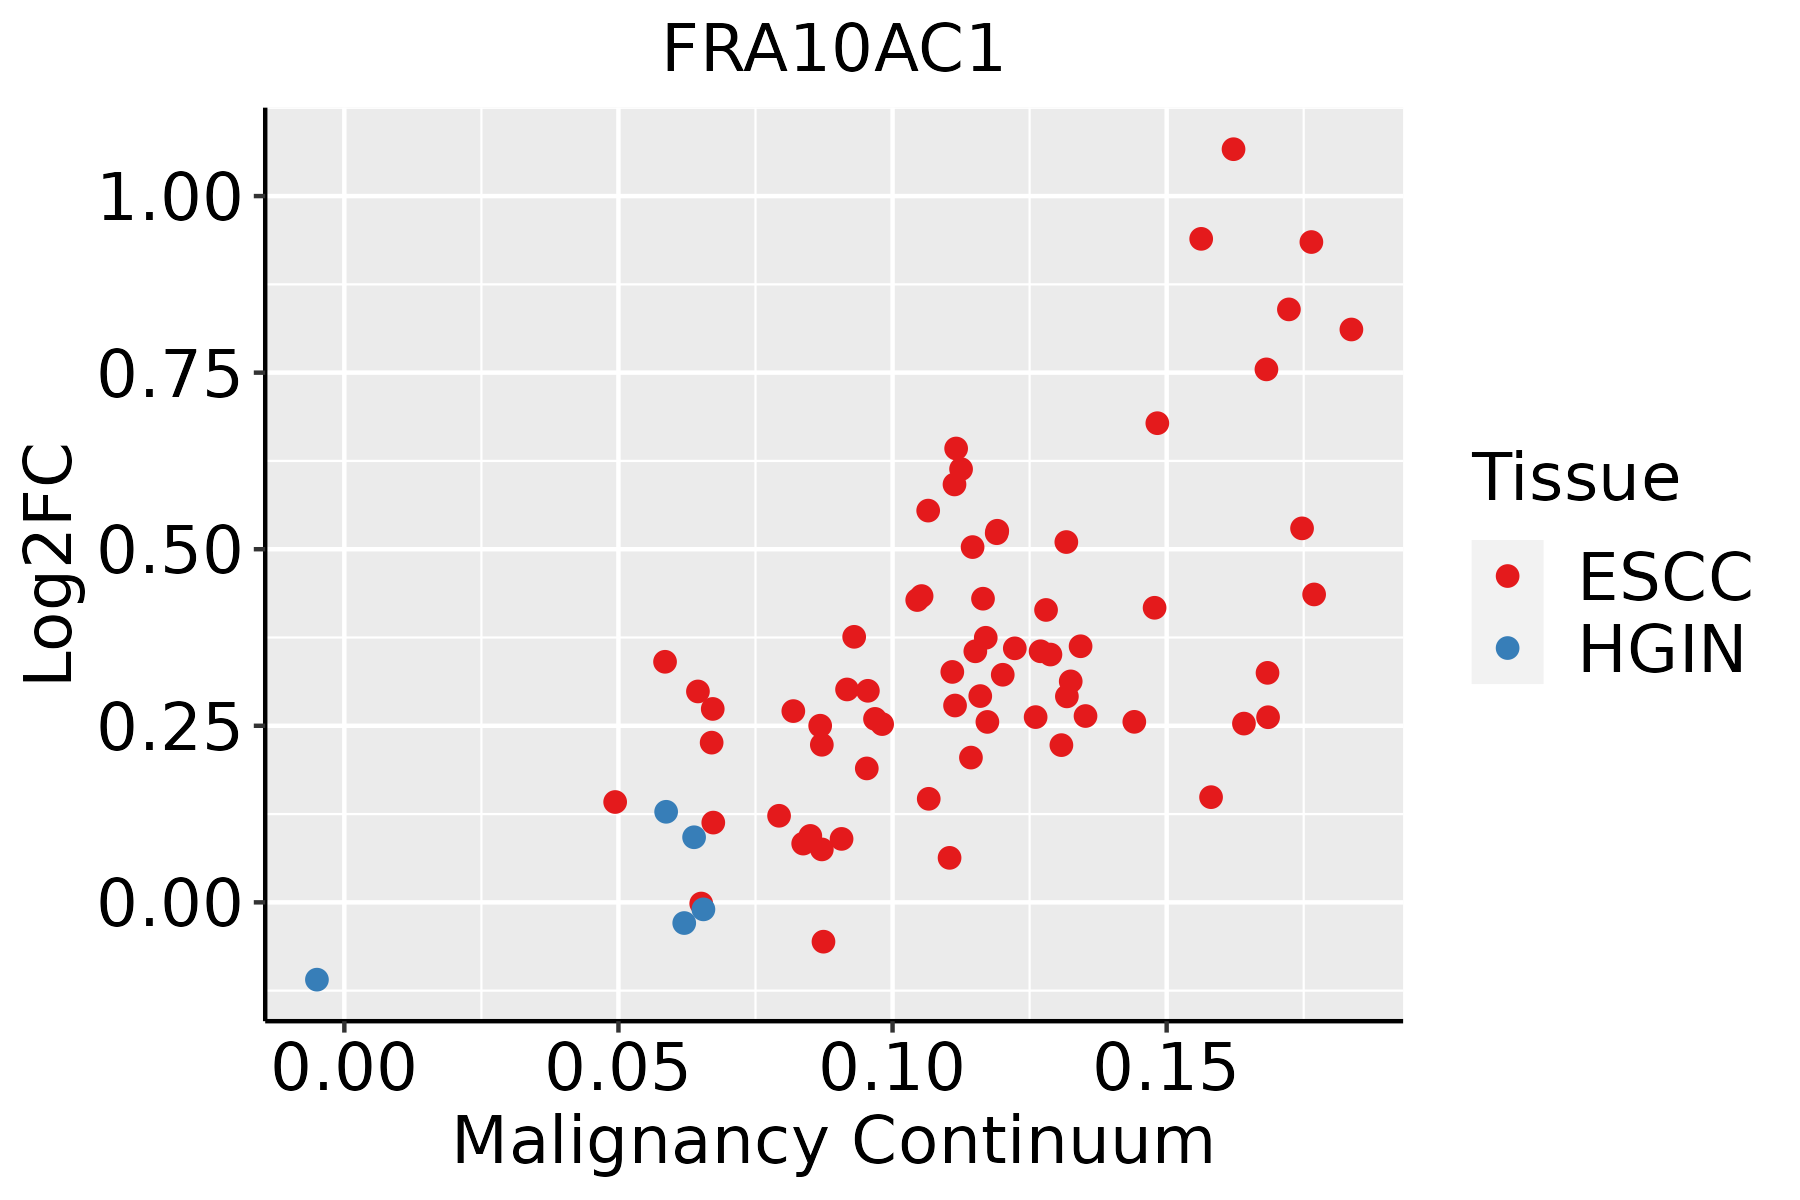 | ESCC: Esophageal squamous cell carcinoma |
| HGIN: High-grade intraepithelial neoplasias | ||
| LGIN: Low-grade intraepithelial neoplasias | ||
| Liver | 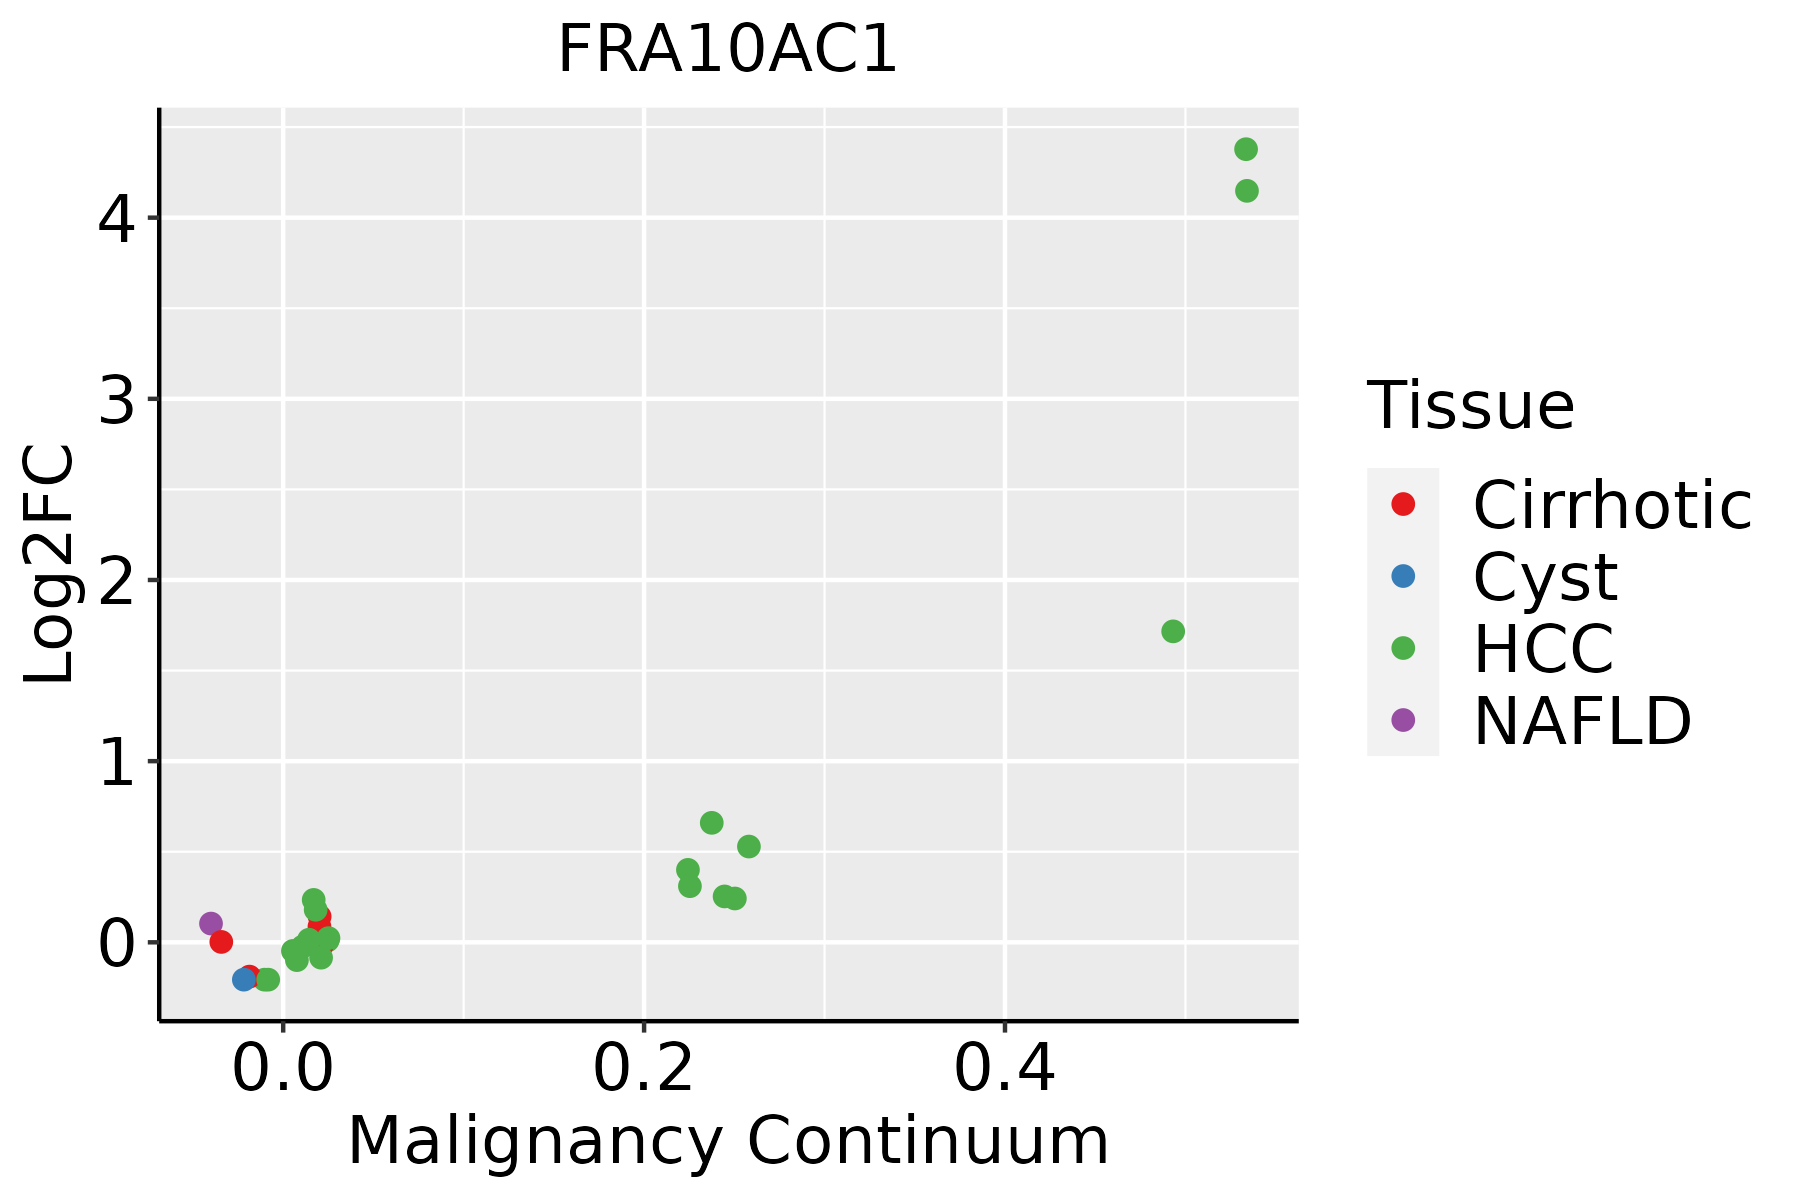 | HCC: Hepatocellular carcinoma |
| NAFLD: Non-alcoholic fatty liver disease | ||
| Oral Cavity | 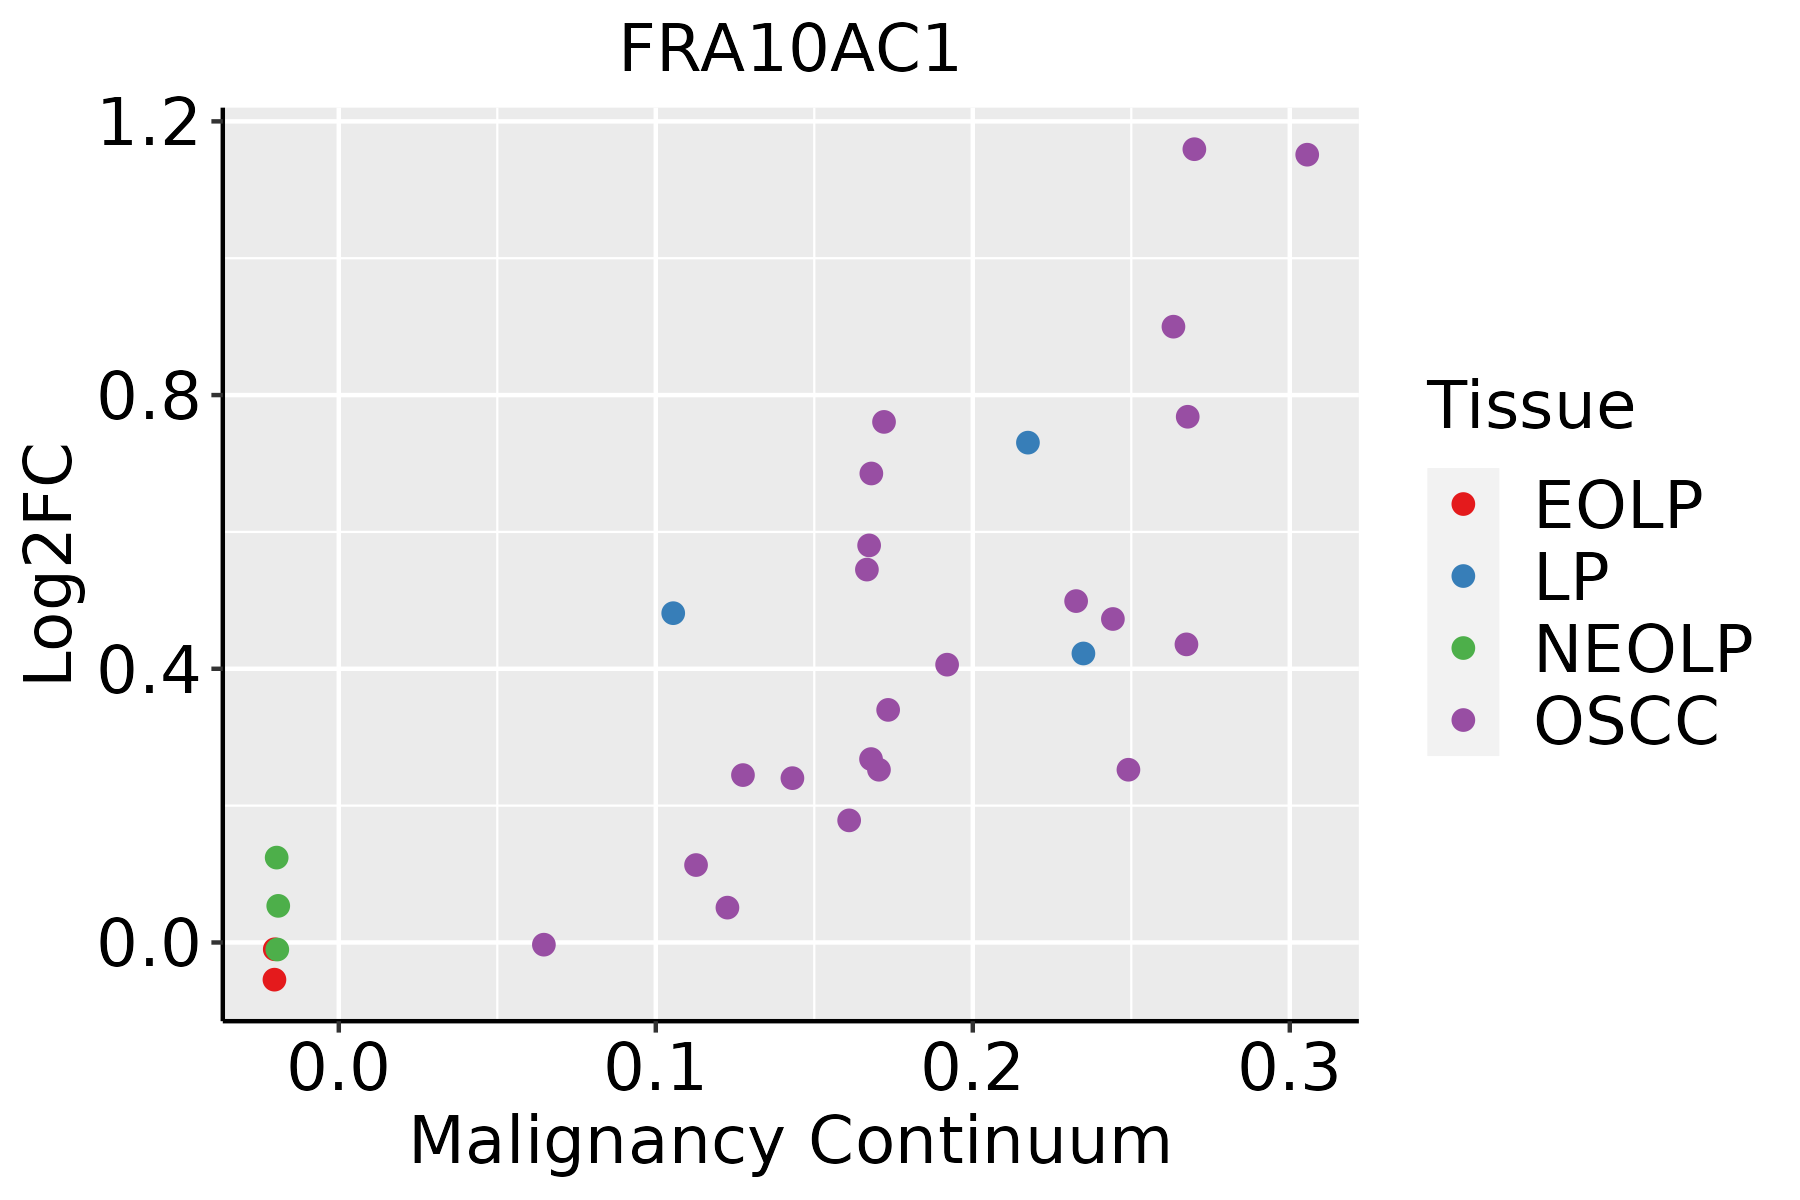 | EOLP: Erosive Oral lichen planus |
| LP: leukoplakia | ||
| NEOLP: Non-erosive oral lichen planus | ||
| OSCC: Oral squamous cell carcinoma | ||
| Thyroid |  | ATC: Anaplastic thyroid cancer |
| HT: Hashimoto's thyroiditis | ||
| PTC: Papillary thyroid cancer |
| ∗log2FC in expression of this searched gene in stem-like cells from each diseased tissue sample relative to stem-like cells in normal samples in each tissue plotted against the malignancy continuum. Samples are colored based on if they are from different disease stage. |
Top |
Malignant transformation related pathway analysis |
| Find out the enriched GO biological processes and KEGG pathways involved in transition from healthy to precancer to cancer |
| Tissue | Disease Stage | Enriched GO biological Processes |
| Colorectum | AD |  |
| Colorectum | SER |  |
| Colorectum | MSS |  |
| Colorectum | MSI-H |  |
| Colorectum | FAP |  |
| ∗Top 15 enriched GO BP terms are showed in the bar plot of each disease state in each tissue. Each row represents a significant GO biological process which is colored according to the -log10(p.adjust). |
| Page: 1 2 3 4 5 6 7 8 9 |
| GO ID | Tissue | Disease Stage | Description | Gene Ratio | Bg Ratio | pvalue | p.adjust | Count |
| GO:001631110 | Esophagus | ESCC | dephosphorylation | 251/8552 | 417/18723 | 1.26e-09 | 2.99e-08 | 251 |
| GO:001631111 | Liver | Cirrhotic | dephosphorylation | 130/4634 | 417/18723 | 1.58e-03 | 1.03e-02 | 130 |
| GO:001631121 | Liver | HCC | dephosphorylation | 230/7958 | 417/18723 | 1.00e-07 | 1.96e-06 | 230 |
| GO:00163119 | Oral cavity | OSCC | dephosphorylation | 220/7305 | 417/18723 | 6.33e-09 | 1.34e-07 | 220 |
| GO:001631116 | Thyroid | PTC | dephosphorylation | 174/5968 | 417/18723 | 1.20e-05 | 1.31e-04 | 174 |
| GO:001631117 | Thyroid | ATC | dephosphorylation | 179/6293 | 417/18723 | 3.88e-05 | 3.15e-04 | 179 |
| Page: 1 |
| Pathway ID | Tissue | Disease Stage | Description | Gene Ratio | Bg Ratio | pvalue | p.adjust | qvalue | Count |
| Page: 1 |
Top |
Cell-cell communication analysis |
| Identification of potential cell-cell interactions between two cell types and their ligand-receptor pairs for different disease states |
| Ligand | Receptor | LRpair | Pathway | Tissue | Disease Stage |
| Page: 1 |
Top |
Single-cell gene regulatory network inference analysis |
| Find out the significant the regulons (TFs) and the target genes of each regulon across cell types for different disease states |
| TF | Cell Type | Tissue | Disease Stage | Target Gene | RSS | Regulon Activity |
| ∗The dot plots of a searched regulon are shown for all cell subpopulations in each disease state of each tissue based on the regulon specific score inferred using pySCENIC and by calculating the average expression. |
| Page: 1 |
Top |
Somatic mutation of malignant transformation related genes |
| Annotation of somatic variants for genes involved in malignant transformation |
| Hugo Symbol | Variant Class | Variant Classification | dbSNP RS | HGVSc | HGVSp | HGVSp Short | SWISSPROT | BIOTYPE | SIFT | PolyPhen | Tumor Sample Barcode | Tissue | Histology | Sex | Age | Stage | Therapy Types | Drugs | Outcome |
| FRA10AC1 | SNV | Missense_Mutation | c.43N>C | p.Glu15Gln | p.E15Q | Q70Z53 | protein_coding | deleterious(0.03) | benign(0.255) | TCGA-A8-A0A9-01 | Breast | breast invasive carcinoma | Female | >=65 | I/II | Hormone Therapy | anastrozole | SD | |
| FRA10AC1 | SNV | Missense_Mutation | c.387N>T | p.Lys129Asn | p.K129N | Q70Z53 | protein_coding | deleterious(0.01) | probably_damaging(0.96) | TCGA-EK-A2R8-01 | Cervix | cervical & endocervical cancer | Female | <65 | I/II | Unknown | Unknown | SD | |
| FRA10AC1 | SNV | Missense_Mutation | c.160G>C | p.Glu54Gln | p.E54Q | Q70Z53 | protein_coding | tolerated(0.17) | benign(0.043) | TCGA-EK-A3GK-01 | Cervix | cervical & endocervical cancer | Female | <65 | I/II | Unknown | Unknown | SD | |
| FRA10AC1 | SNV | Missense_Mutation | c.580N>A | p.Gly194Ser | p.G194S | Q70Z53 | protein_coding | tolerated(0.09) | possibly_damaging(0.78) | TCGA-A6-5659-01 | Colorectum | colon adenocarcinoma | Male | >=65 | I/II | Unknown | Unknown | SD | |
| FRA10AC1 | SNV | Missense_Mutation | c.611N>T | p.Ala204Val | p.A204V | Q70Z53 | protein_coding | deleterious(0) | probably_damaging(0.997) | TCGA-AA-3815-01 | Colorectum | colon adenocarcinoma | Female | >=65 | I/II | Unknown | Unknown | SD | |
| FRA10AC1 | SNV | Missense_Mutation | c.399N>T | p.Lys133Asn | p.K133N | Q70Z53 | protein_coding | deleterious(0) | possibly_damaging(0.824) | TCGA-AG-A002-01 | Colorectum | rectum adenocarcinoma | Male | <65 | I/II | Unknown | Unknown | SD | |
| FRA10AC1 | SNV | Missense_Mutation | novel | c.346N>A | p.Leu116Ile | p.L116I | Q70Z53 | protein_coding | tolerated(0.05) | probably_damaging(0.974) | TCGA-AG-A002-01 | Colorectum | rectum adenocarcinoma | Male | <65 | I/II | Unknown | Unknown | SD |
| FRA10AC1 | insertion | Frame_Shift_Ins | novel | c.694_695insA | p.Arg232LysfsTer4 | p.R232Kfs*4 | Q70Z53 | protein_coding | TCGA-AA-3713-01 | Colorectum | colon adenocarcinoma | Male | >=65 | III/IV | Chemotherapy | 5-fluorouracil | PR | ||
| FRA10AC1 | deletion | Frame_Shift_Del | rs775948504 | c.694delN | p.Arg232GlufsTer96 | p.R232Efs*96 | Q70Z53 | protein_coding | TCGA-CM-6162-01 | Colorectum | colon adenocarcinoma | Female | <65 | III/IV | Chemotherapy | oxaliplatin | SD | ||
| FRA10AC1 | deletion | Frame_Shift_Del | rs750462341 | c.621delA | p.Lys207AsnfsTer2 | p.K207Nfs*2 | Q70Z53 | protein_coding | TCGA-EI-6507-01 | Colorectum | rectum adenocarcinoma | Male | <65 | I/II | Unknown | Unknown | SD |
| Page: 1 2 3 4 |
Top |
Related drugs of malignant transformation related genes |
| Identification of chemicals and drugs interact with genes involved in malignant transfromation |
| (DGIdb 4.0) |
| Entrez ID | Symbol | Category | Interaction Types | Drug Claim Name | Drug Name | PMIDs |
| Page: 1 |

Copyright 2023-Present -The University of Texas Health Science Center at Houston |