Schematic overview of the cellular and molecular mechanisms involved in the cancer progression, including the proposed cellular and molecular mechanisms in cancer cells trajectory. AT1: alveolar type 1 cells; AT2: alveolar type 2 cells; AAH: atypical adenomatous hyperplasia; AIS: adenocarcinoma in situ; MIA: minimally invasive adenocarcinoma; IA: invasive adenocarcinoma; EMT: epithelial-mesenchymal transition

Home

Download

Statistics

Help

Contact

Center for Computational Systems Medicine
leaf

Gene summary

leaf

Malignant transformation analysis

leaf

Malignant transformation related pathway analysis

leaf

Cell-cell communication analysis

leaf

Single-cell gene regulatory network inference analysis

leaf

Somatic mutation of malignant transformation related genes

leaf

Related drugs of malignant transformation related genes

Gene: FLRT3

Gene summary for FLRT3

check button Gene summary.

Gene informationSpeciesHuman
Gene symbol

FLRT3

Gene ID

23767

Gene namefibronectin leucine rich transmembrane protein 3
Gene AliasHH21
Cytomap20p12.1
Gene Typeprotein-coding
GO ID

GO:0000902

UniProtAcc

Q9NZU0


Top

Malignant transformation analysis

check button Identification of the aberrant gene expression in precancerous and cancerous lesions by comparing the gene expression of stem-like cells in diseased tissues with normal stem cells
check button Malignant transformation involving gene list.
Entrez IDSymbolReplicatesSpeciesOrganTissueAdj P-valueLog2FCMalignancy
23767FLRT3GSM5353237_PA_PR5251_T2_S8_L001HumanProstateTumor1.86e-079.01e-010.1622
23767FLRT3GSM5353240_PA_PR5254_T1_S15_L001HumanProstateTumor1.51e-023.52e-010.1575
23767FLRT3GSM5353243_PA_PR5261_T1_S23_L002HumanProstateTumor3.10e-092.77e-010.1545
23767FLRT3GSM5353244_PA_PR5261_T2_S24_L002HumanProstateTumor2.06e-032.13e-010.1569
23767FLRT3GSM5353247_PA_PR5269_3_S27_L002HumanProstateTumor1.38e-025.59e-010.1532
23767FLRT3male-WTAHumanThyroidPTC1.30e-181.58e-010.1037
23767FLRT3PTC01HumanThyroidPTC1.98e-113.57e-010.1899
23767FLRT3PTC04HumanThyroidPTC1.94e-168.18e-010.1927
23767FLRT3PTC06HumanThyroidPTC1.78e-261.11e+000.2057
23767FLRT3PTC07HumanThyroidPTC1.49e-439.90e-010.2044
23767FLRT3ATC5HumanThyroidATC9.28e-05-8.67e-020.34
Page: 1 2 3 4 

check button Transcriptomic changes along malignancy continuum.
TissueExpression DynamicsAbbreviation
EsophagusThe image shows the transcriptomic changes along malignancy continuum.log2FC in expression of this searched gene in stem-like cells from each diseased tissue sample relative to stem-like cells in normal samples in each tissue plotted against the malignancy continuum. Samples are colored based on if they are from different disease stage.ESCC: Esophageal squamous cell carcinoma
HGIN: High-grade intraepithelial neoplasias
LGIN: Low-grade intraepithelial neoplasias
LiverThe image shows the transcriptomic changes along malignancy continuum.log2FC in expression of this searched gene in stem-like cells from each diseased tissue sample relative to stem-like cells in normal samples in each tissue plotted against the malignancy continuum. Samples are colored based on if they are from different disease stage.
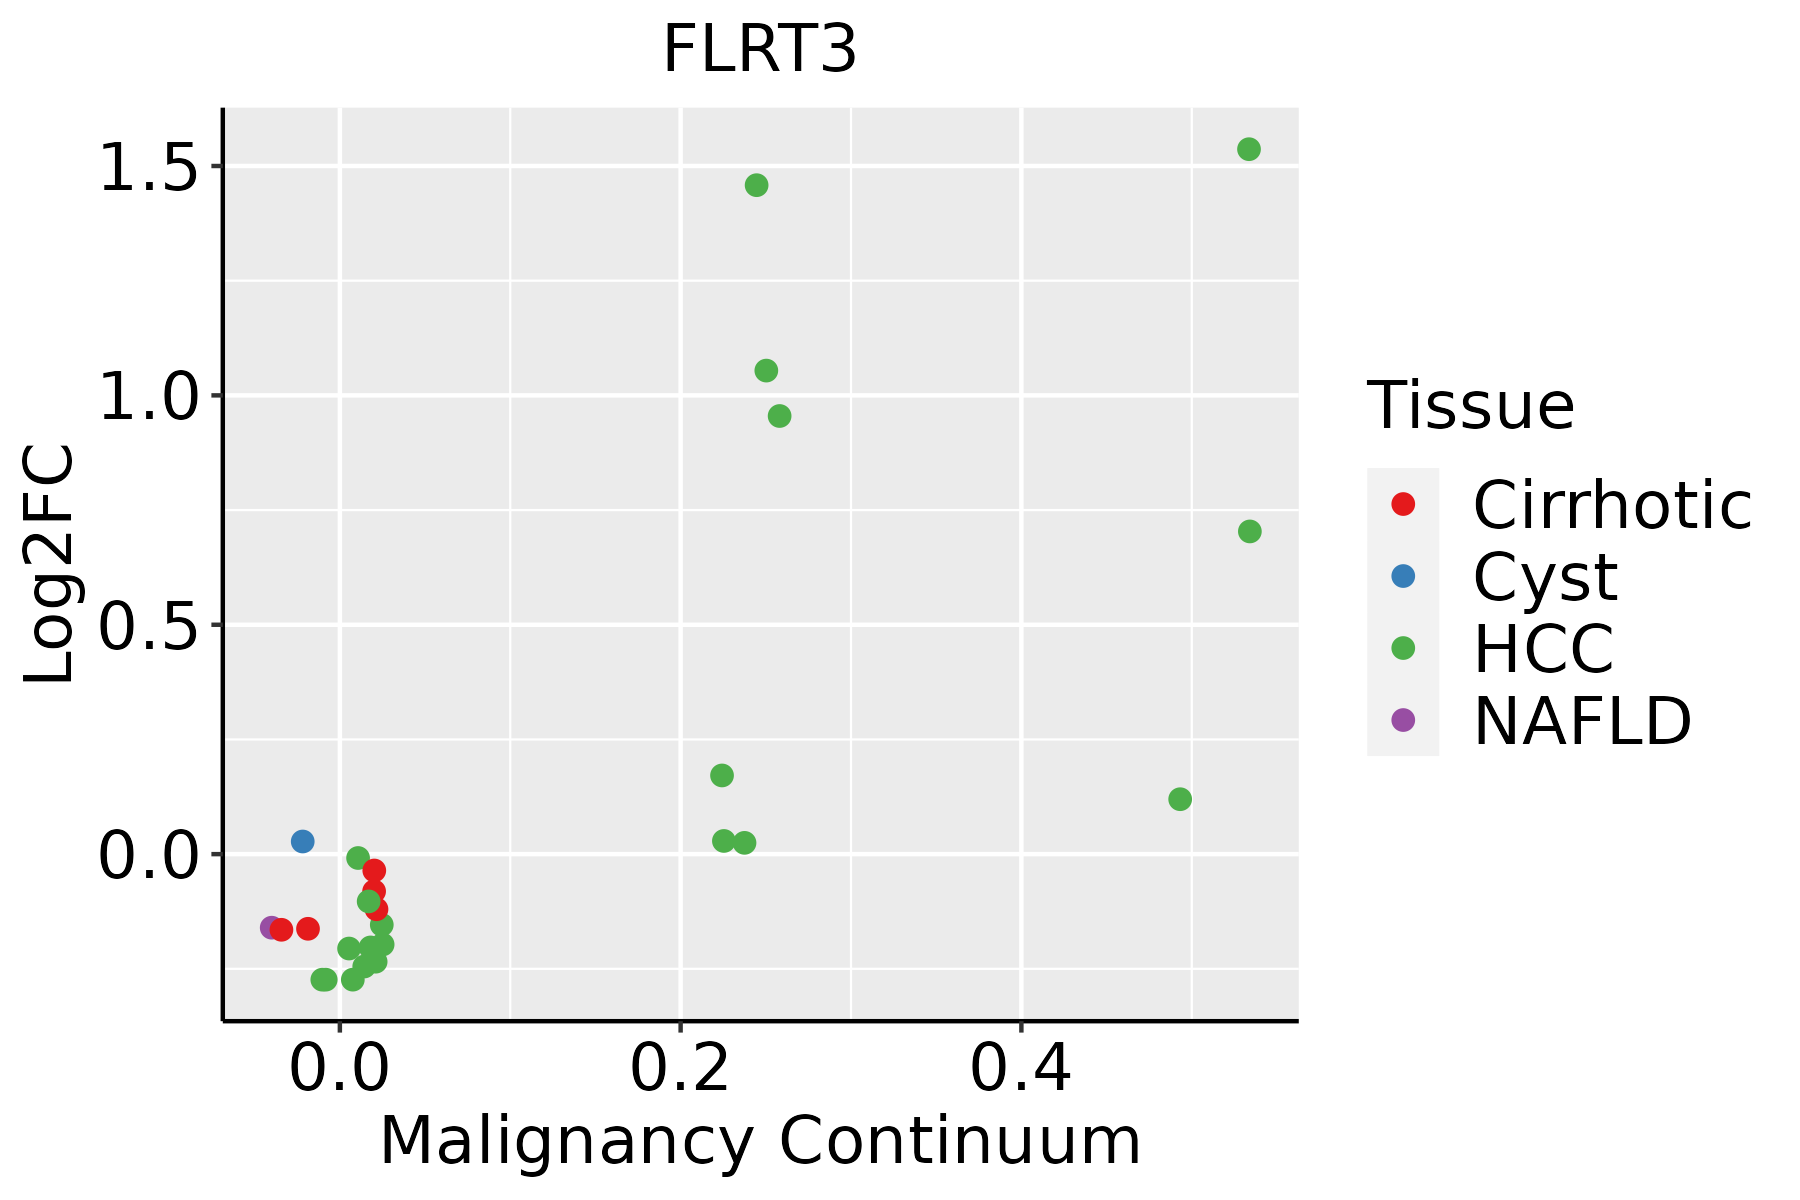
HCC: Hepatocellular carcinoma
NAFLD: Non-alcoholic fatty liver disease
Oral CavityThe image shows the transcriptomic changes along malignancy continuum.log2FC in expression of this searched gene in stem-like cells from each diseased tissue sample relative to stem-like cells in normal samples in each tissue plotted against the malignancy continuum. Samples are colored based on if they are from different disease stage.
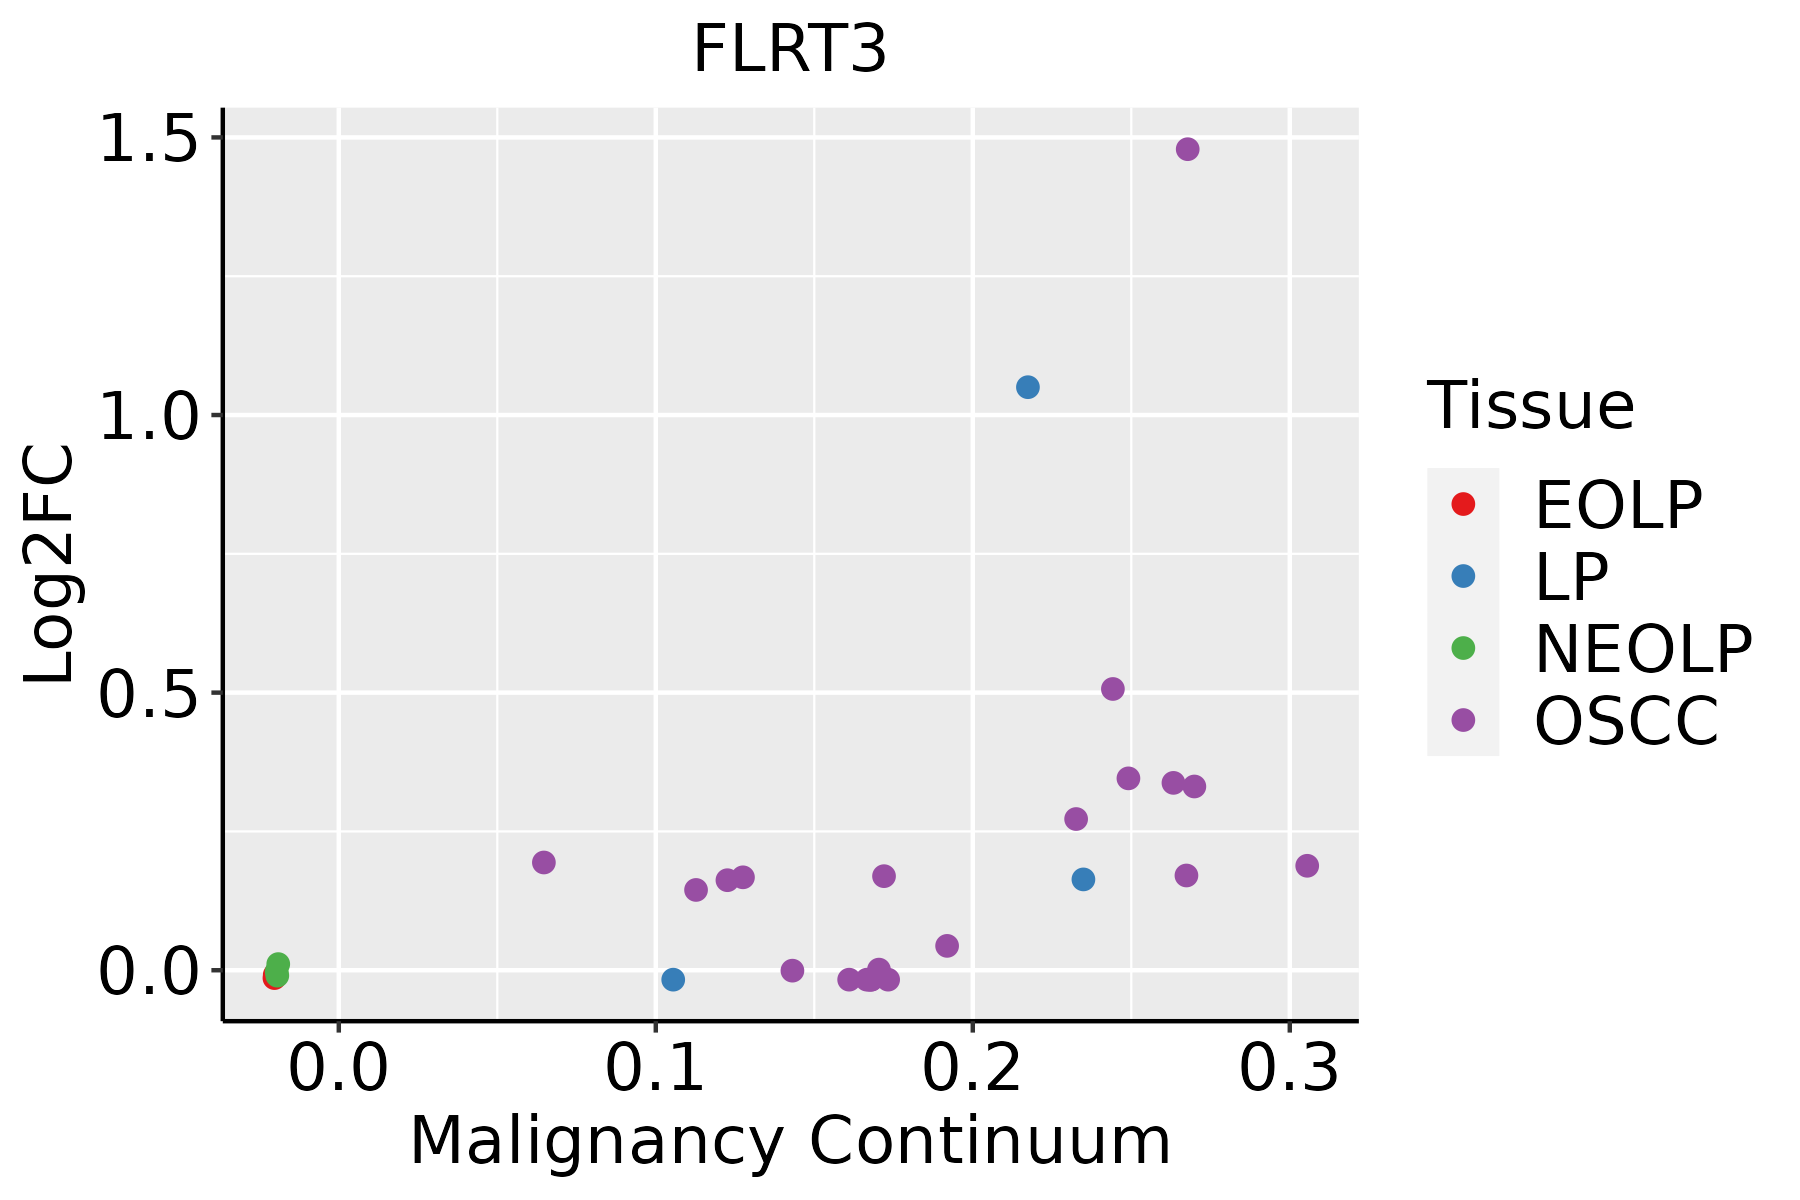
EOLP: Erosive Oral lichen planus
LP: leukoplakia
NEOLP: Non-erosive oral lichen planus
OSCC: Oral squamous cell carcinoma
ProstateThe image shows the transcriptomic changes along malignancy continuum.log2FC in expression of this searched gene in stem-like cells from each diseased tissue sample relative to stem-like cells in normal samples in each tissue plotted against the malignancy continuum. Samples are colored based on if they are from different disease stage.BPH: Benign Prostatic Hyperplasia
ThyroidThe image shows the transcriptomic changes along malignancy continuum.log2FC in expression of this searched gene in stem-like cells from each diseased tissue sample relative to stem-like cells in normal samples in each tissue plotted against the malignancy continuum. Samples are colored based on if they are from different disease stage.ATC: Anaplastic thyroid cancer
HT: Hashimoto's thyroiditis
PTC: Papillary thyroid cancer
∗log2FC in expression of this searched gene in stem-like cells from each diseased tissue sample relative to stem-like cells in normal samples in each tissue plotted against the malignancy continuum. Samples are colored based on if they are from different disease stage.

Top

Malignant transformation related pathway analysis

check buttonFind out the enriched GO biological processes and KEGG pathways involved in transition from healthy to precancer to cancer
check button Figure of enriched GO biological processes.
TissueDisease StageEnriched GO biological Processes
ColorectumADGO analysis - Figure of enriched GO biological processes: Top 15 enriched GO BP terms are showed in the bar plot of each disease state in each tissue. Each row represents a significant GO biological process which is colored according to the -log10(p.adjust).
ColorectumSERGO analysis - Figure of enriched GO biological processes: Top 15 enriched GO BP terms are showed in the bar plot of each disease state in each tissue. Each row represents a significant GO biological process which is colored according to the -log10(p.adjust).
ColorectumMSSGO analysis - Figure of enriched GO biological processes: Top 15 enriched GO BP terms are showed in the bar plot of each disease state in each tissue. Each row represents a significant GO biological process which is colored according to the -log10(p.adjust).
ColorectumMSI-HGO analysis - Figure of enriched GO biological processes: Top 15 enriched GO BP terms are showed in the bar plot of each disease state in each tissue. Each row represents a significant GO biological process which is colored according to the -log10(p.adjust).
ColorectumFAPGO analysis - Figure of enriched GO biological processes: Top 15 enriched GO BP terms are showed in the bar plot of each disease state in each tissue. Each row represents a significant GO biological process which is colored according to the -log10(p.adjust).
∗Top 15 enriched GO BP terms are showed in the bar plot of each disease state in each tissue. Each row represents a significant GO biological process which is colored according to the -log10(p.adjust).
Page: 1 2 3 4 5 6 7 8 9 

check button Enriched GO biological processes.
GO IDTissueDisease StageDescriptionGene RatioBg Ratiopvaluep.adjustCount
GO:0016049110EsophagusESCCcell growth289/8552482/187231.29e-103.77e-09289
GO:00020115EsophagusESCCmorphogenesis of an epithelial sheet42/855257/187231.62e-051.45e-0442
GO:006156415EsophagusESCCaxon development251/8552467/187232.41e-041.49e-03251
GO:003432918EsophagusESCCcell junction assembly227/8552420/187233.06e-041.83e-03227
GO:00519606EsophagusESCCregulation of nervous system development237/8552443/187235.02e-042.78e-03237
GO:006056010EsophagusESCCdevelopmental growth involved in morphogenesis131/8552234/187239.28e-044.73e-03131
GO:00519625EsophagusESCCpositive regulation of nervous system development149/8552272/187231.50e-037.06e-03149
GO:00486785EsophagusESCCresponse to axon injury51/855283/187232.74e-031.16e-0251
GO:000740915EsophagusESCCaxonogenesis219/8552418/187233.14e-031.31e-02219
GO:004858810EsophagusESCCdevelopmental cell growth125/8552234/187231.01e-023.46e-02125
GO:190188810EsophagusESCCregulation of cell junction assembly109/8552204/187231.53e-024.96e-02109
GO:001604911LiverCirrhoticcell growth160/4634482/187231.50e-052.07e-04160
GO:001604921LiverHCCcell growth269/7958482/187231.84e-095.35e-08269
GO:006056011LiverHCCdevelopmental growth involved in morphogenesis124/7958234/187237.37e-044.47e-03124
GO:199013811LiverHCCneuron projection extension92/7958172/187232.31e-031.14e-0292
GO:004858811LiverHCCdevelopmental cell growth121/7958234/187232.68e-031.28e-02121
GO:001604917Oral cavityOSCCcell growth268/7305482/187236.55e-143.51e-12268
GO:00020114Oral cavityOSCCmorphogenesis of an epithelial sheet37/730557/187236.66e-055.38e-0437
GO:00519624Oral cavityOSCCpositive regulation of nervous system development135/7305272/187232.20e-041.44e-03135
GO:00485889Oral cavityOSCCdevelopmental cell growth116/7305234/187236.20e-043.50e-03116
Page: 1 2 3 4 5 

check button Enriched KEGG pathways.
Pathway IDTissueDisease StageDescriptionGene RatioBg Ratiopvaluep.adjustqvalueCount
Page: 1 

Top

Cell-cell communication analysis

check buttonIdentification of potential cell-cell interactions between two cell types and their ligand-receptor pairs for different disease states
LigandReceptorLRpairPathwayTissueDisease Stage
Page: 1 

Top

Single-cell gene regulatory network inference analysis

check buttonFind out the significant the regulons (TFs) and the target genes of each regulon across cell types for different disease states
TFCell TypeTissueDisease StageTarget GeneRSSRegulon Activity
∗The dot plots of a searched regulon are shown for all cell subpopulations in each disease state of each tissue based on the regulon specific score inferred using pySCENIC and by calculating the average expression.
Page: 1 

Top

Somatic mutation of malignant transformation related genes

check buttonAnnotation of somatic variants for genes involved in malignant transformation
Hugo SymbolVariant ClassVariant ClassificationdbSNP RSHGVScHGVSpHGVSp ShortSWISSPROTBIOTYPESIFTPolyPhenTumor Sample BarcodeTissueHistologySexAgeStageTherapy TypesDrugsOutcome
FLRT3SNVMissense_Mutationrs760038366c.1514N>Ap.Arg505Glnp.R505QQ9NZU0protein_codingtolerated(0.61)benign(0)TCGA-AN-A046-01Breastbreast invasive carcinomaFemale>=65I/IIUnknownUnknownSD
FLRT3SNVMissense_Mutationc.557G>Ap.Arg186Hisp.R186HQ9NZU0protein_codingdeleterious(0)probably_damaging(0.999)TCGA-BH-A0HA-01Breastbreast invasive carcinomaFemale<65I/IIUnknownUnknownSD
FLRT3SNVMissense_Mutationc.1783N>Ap.Gln595Lysp.Q595KQ9NZU0protein_codingdeleterious(0.01)possibly_damaging(0.834)TCGA-D8-A27G-01Breastbreast invasive carcinomaFemale>=65I/IIUnknownUnknownSD
FLRT3SNVMissense_Mutationc.700C>Tp.Arg234Trpp.R234WQ9NZU0protein_codingdeleterious(0)probably_damaging(1)TCGA-E9-A243-01Breastbreast invasive carcinomaFemale<65I/IIChemotherapy5-fluorouracilPD
FLRT3SNVMissense_Mutationrs751955471c.701N>Ap.Arg234Glnp.R234QQ9NZU0protein_codingdeleterious(0)probably_damaging(0.997)TCGA-EW-A1P4-01Breastbreast invasive carcinomaFemale<65I/IIChemotherapydocetaxelSD
FLRT3insertionFrame_Shift_Insnovelc.1261_1262insGAp.Asp421GlyfsTer14p.D421Gfs*14Q9NZU0protein_codingTCGA-AR-A0U0-01Breastbreast invasive carcinomaFemale>=65I/IIUnknownUnknownSD
FLRT3SNVMissense_Mutationrs564318429c.781N>Tp.Arg261Trpp.R261WQ9NZU0protein_codingdeleterious(0.01)possibly_damaging(0.697)TCGA-C5-A2LV-01Cervixcervical & endocervical cancerFemale<65I/IIUnknownUnknownSD
FLRT3SNVMissense_Mutationc.1100C>Ap.Thr367Asnp.T367NQ9NZU0protein_codingtolerated(0.17)benign(0.147)TCGA-EX-A69M-01Cervixcervical & endocervical cancerFemale<65I/IIUnknownUnknownPD
FLRT3SNVMissense_Mutationrs537766361c.488G>Ap.Arg163Hisp.R163HQ9NZU0protein_codingdeleterious(0)probably_damaging(0.985)TCGA-VS-A8EH-01Cervixcervical & endocervical cancerFemale<65III/IVChemotherapycisplatinCR
FLRT3SNVMissense_Mutationrs142379846c.10N>Ap.Ala4Thrp.A4TQ9NZU0protein_codingtolerated_low_confidence(0.56)benign(0)TCGA-AA-3715-01Colorectumcolon adenocarcinomaMale>=65I/IIUnknownUnknownPD
Page: 1 2 3 4 5 6 7 8 9 

Top

Related drugs of malignant transformation related genes

check buttonIdentification of chemicals and drugs interact with genes involved in malignant transfromation
(DGIdb 4.0)
Entrez IDSymbolCategoryInteraction TypesDrug Claim NameDrug NamePMIDs
Page: 1