
|
|||||
|
 | |
| |
| |
| |
| |
| |
|
Gene: FLNA |
Gene summary for FLNA |
| Gene information | Species | Human | Gene symbol | FLNA | Gene ID | 2316 |
| Gene name | filamin A | |
| Gene Alias | ABP-280 | |
| Cytomap | Xq28 | |
| Gene Type | protein-coding | GO ID | GO:0000003 | UniProtAcc | P21333 |
Top |
Malignant transformation analysis |
| Identification of the aberrant gene expression in precancerous and cancerous lesions by comparing the gene expression of stem-like cells in diseased tissues with normal stem cells |
| Entrez ID | Symbol | Replicates | Species | Organ | Tissue | Adj P-value | Log2FC | Malignancy |
| 2316 | FLNA | P49T-E | Human | Esophagus | ESCC | 9.96e-24 | 3.01e+00 | 0.1768 |
| 2316 | FLNA | P52T-E | Human | Esophagus | ESCC | 1.90e-79 | 1.79e+00 | 0.1555 |
| 2316 | FLNA | P54T-E | Human | Esophagus | ESCC | 1.45e-18 | 7.99e-01 | 0.0975 |
| 2316 | FLNA | P56T-E | Human | Esophagus | ESCC | 2.09e-16 | 2.43e+00 | 0.1613 |
| 2316 | FLNA | P57T-E | Human | Esophagus | ESCC | 2.33e-09 | 1.13e+00 | 0.0926 |
| 2316 | FLNA | P61T-E | Human | Esophagus | ESCC | 2.61e-54 | 1.69e+00 | 0.099 |
| 2316 | FLNA | P62T-E | Human | Esophagus | ESCC | 7.36e-68 | 1.67e+00 | 0.1302 |
| 2316 | FLNA | P65T-E | Human | Esophagus | ESCC | 4.13e-47 | 1.63e+00 | 0.0978 |
| 2316 | FLNA | P74T-E | Human | Esophagus | ESCC | 1.43e-24 | 1.05e+00 | 0.1479 |
| 2316 | FLNA | P75T-E | Human | Esophagus | ESCC | 8.88e-14 | 1.02e+00 | 0.1125 |
| 2316 | FLNA | P76T-E | Human | Esophagus | ESCC | 3.24e-59 | 1.83e+00 | 0.1207 |
| 2316 | FLNA | P79T-E | Human | Esophagus | ESCC | 1.90e-54 | 1.54e+00 | 0.1154 |
| 2316 | FLNA | P80T-E | Human | Esophagus | ESCC | 3.39e-42 | 1.73e+00 | 0.155 |
| 2316 | FLNA | P82T-E | Human | Esophagus | ESCC | 3.25e-12 | 2.08e+00 | 0.1072 |
| 2316 | FLNA | P83T-E | Human | Esophagus | ESCC | 4.96e-44 | 1.91e+00 | 0.1738 |
| 2316 | FLNA | P84T-E | Human | Esophagus | ESCC | 2.38e-12 | 1.46e+00 | 0.0933 |
| 2316 | FLNA | P89T-E | Human | Esophagus | ESCC | 3.53e-21 | 2.38e+00 | 0.1752 |
| 2316 | FLNA | P91T-E | Human | Esophagus | ESCC | 6.61e-28 | 4.35e+00 | 0.1828 |
| 2316 | FLNA | P107T-E | Human | Esophagus | ESCC | 4.04e-66 | 2.13e+00 | 0.171 |
| 2316 | FLNA | P126T-E | Human | Esophagus | ESCC | 4.34e-09 | 1.87e+00 | 0.1125 |
| Page: 1 2 3 4 5 6 7 8 9 |
| Tissue | Expression Dynamics | Abbreviation |
| Endometrium | 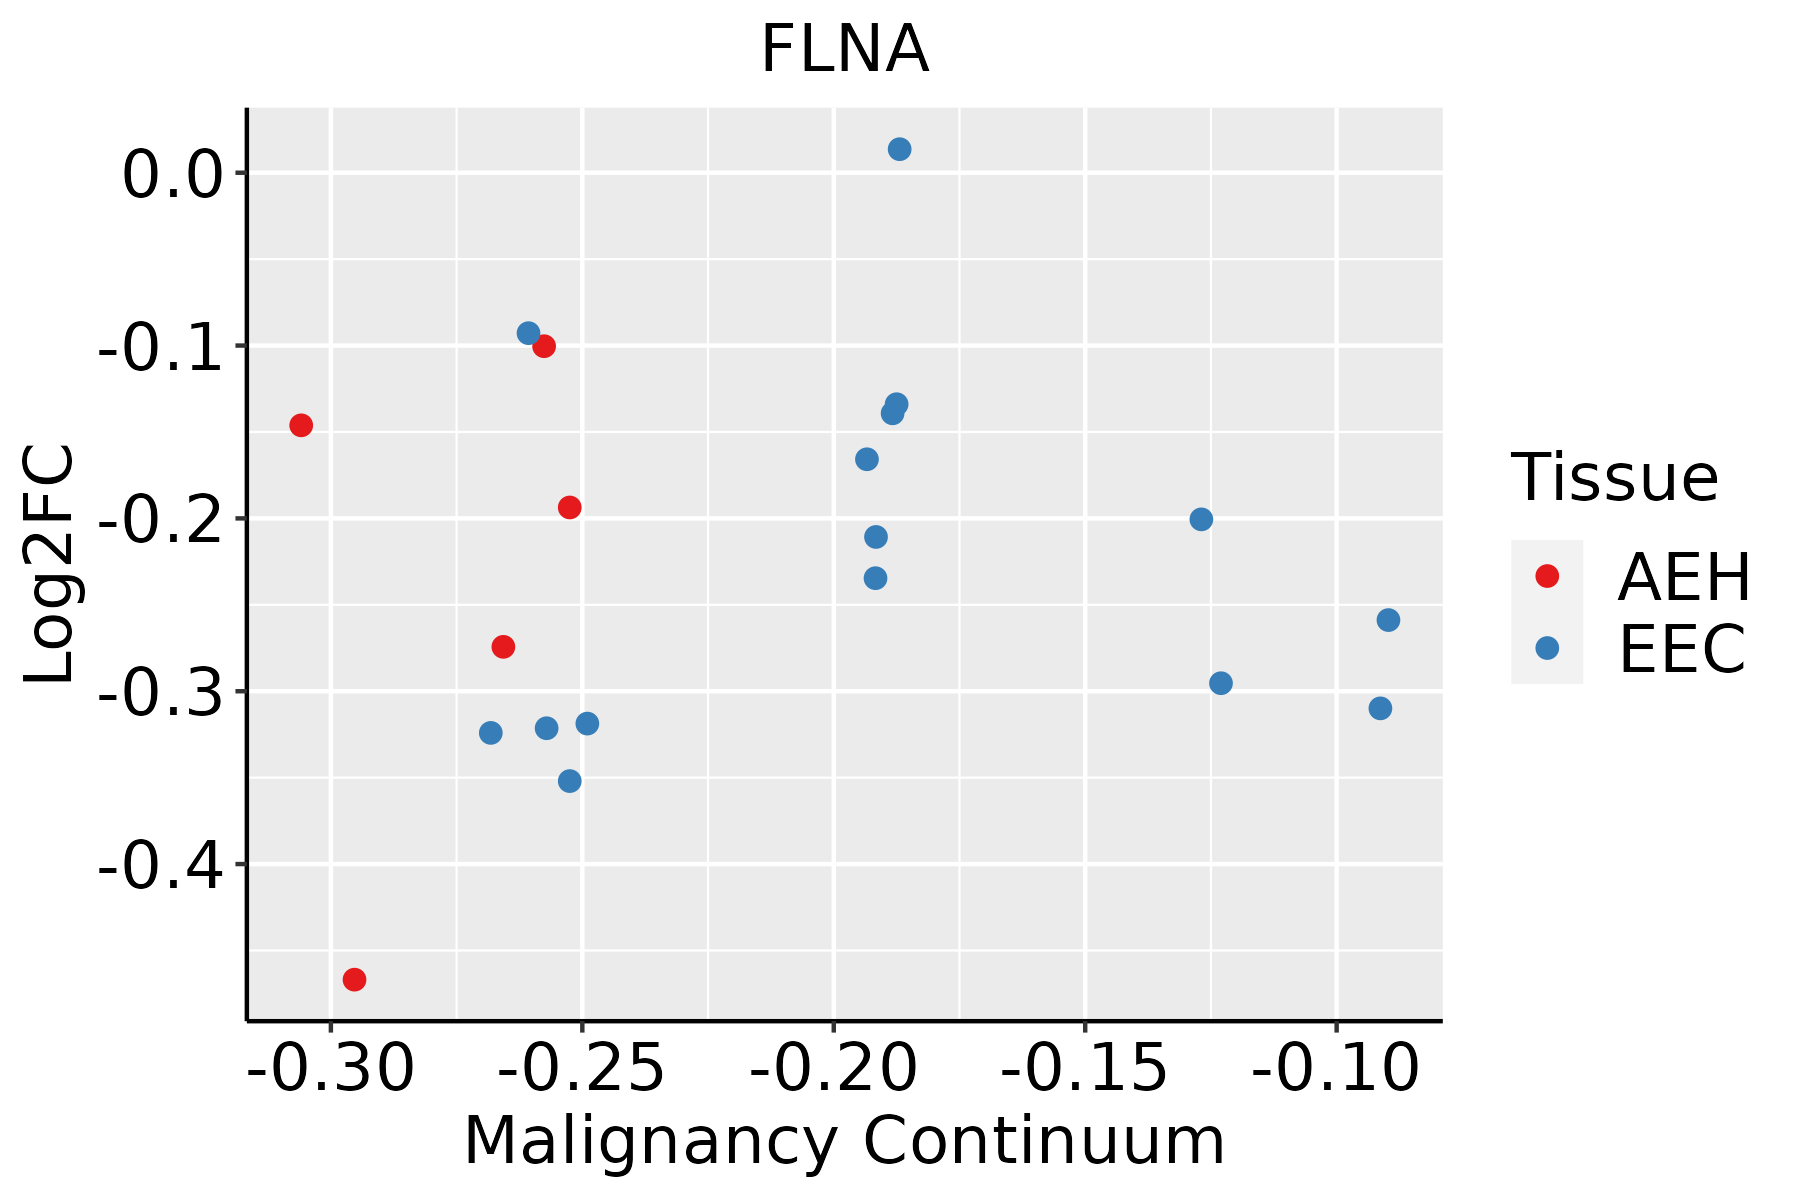 | AEH: Atypical endometrial hyperplasia |
| EEC: Endometrioid Cancer | ||
| Esophagus |  | ESCC: Esophageal squamous cell carcinoma |
| HGIN: High-grade intraepithelial neoplasias | ||
| LGIN: Low-grade intraepithelial neoplasias | ||
| Liver | 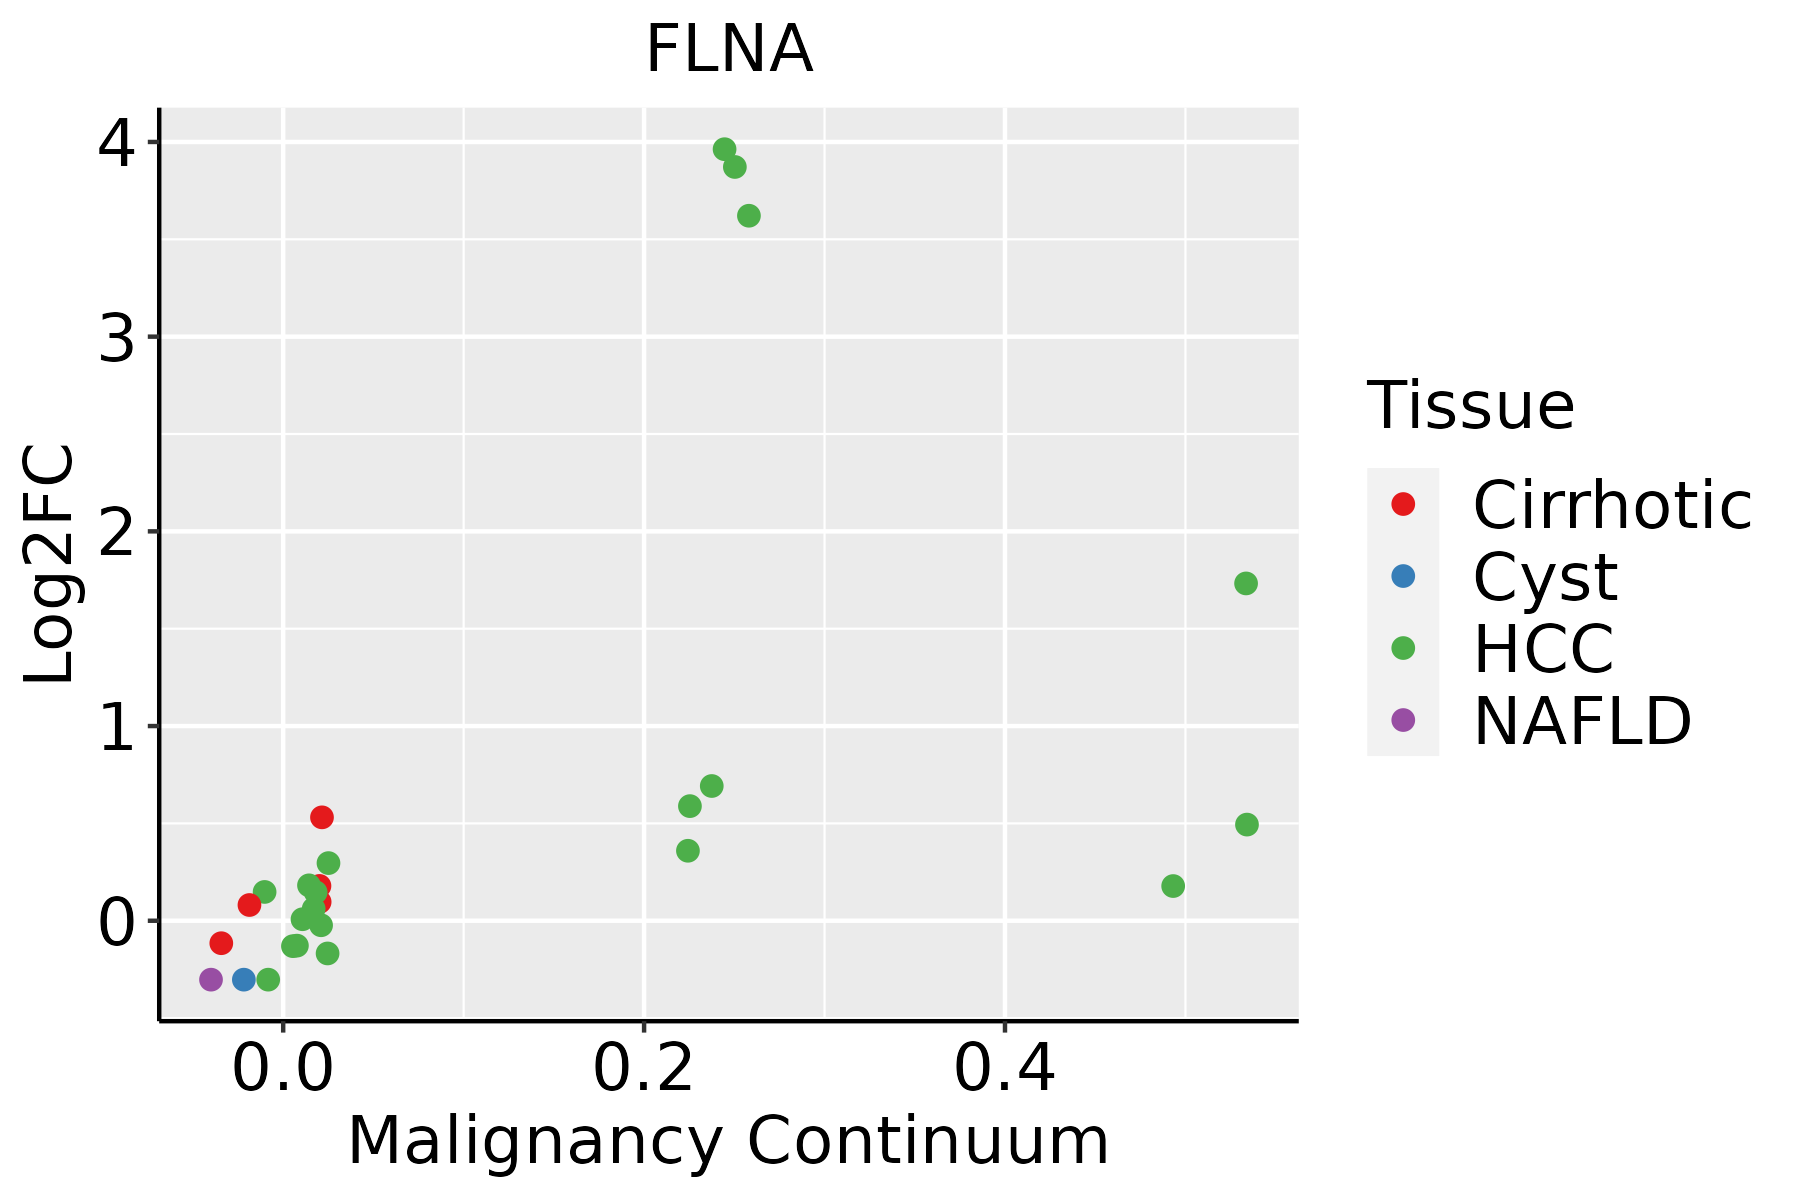 | HCC: Hepatocellular carcinoma |
| NAFLD: Non-alcoholic fatty liver disease | ||
| Oral Cavity | 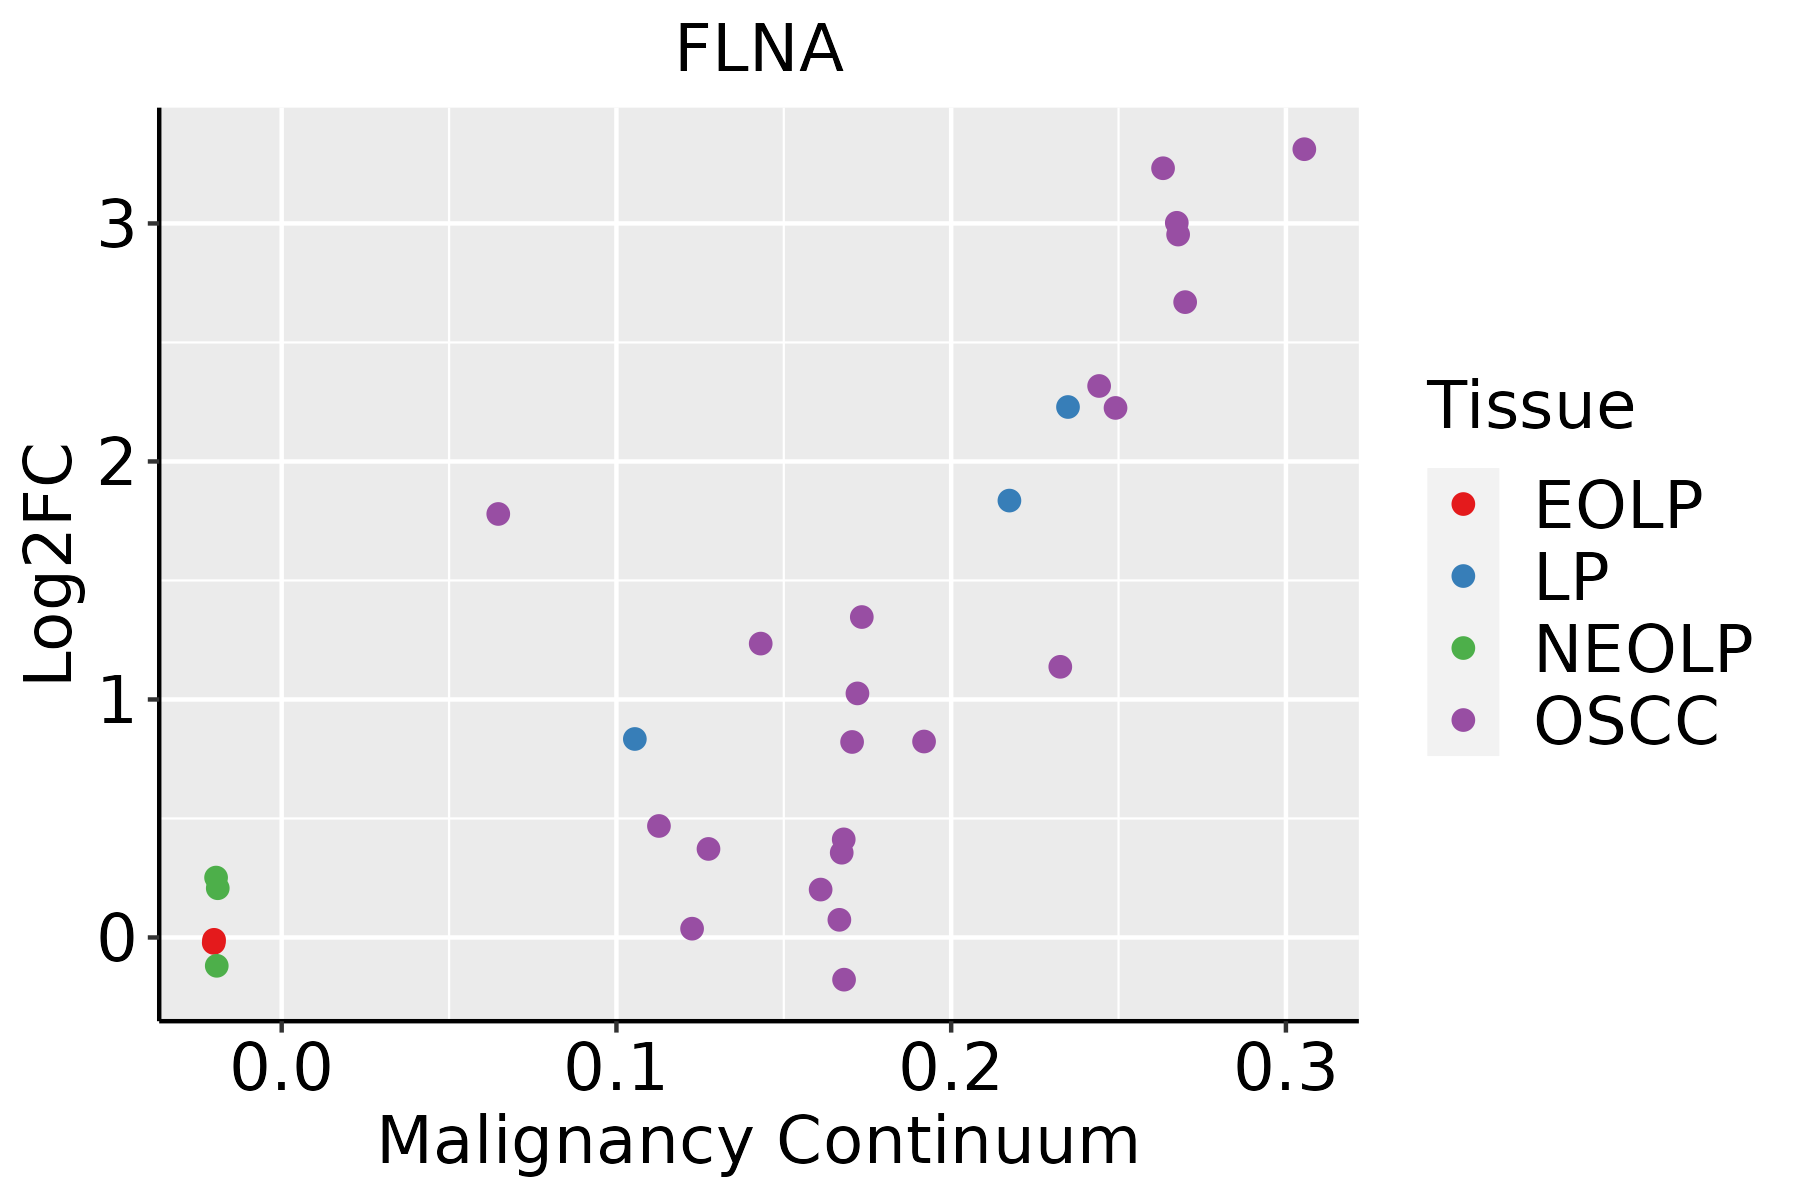 | EOLP: Erosive Oral lichen planus |
| LP: leukoplakia | ||
| NEOLP: Non-erosive oral lichen planus | ||
| OSCC: Oral squamous cell carcinoma | ||
| Prostate | 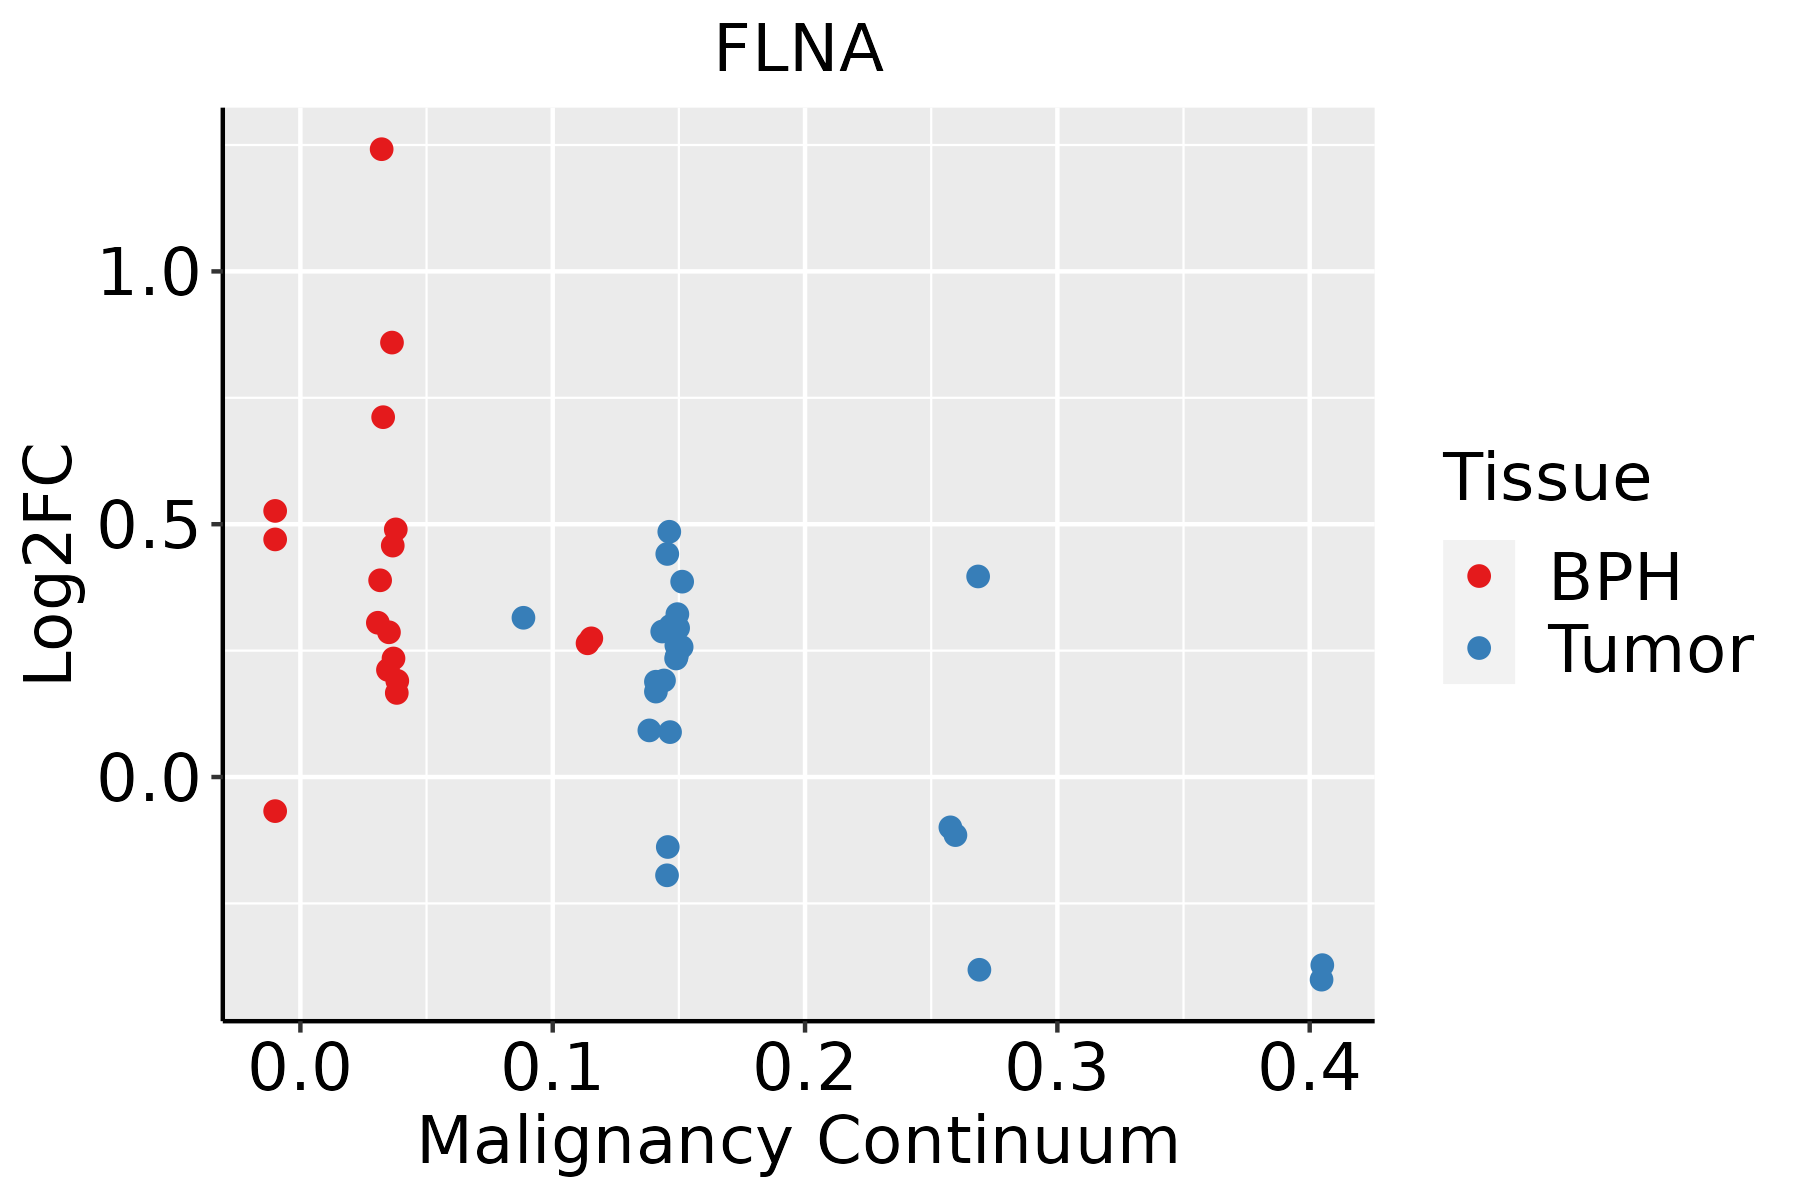 | BPH: Benign Prostatic Hyperplasia |
| Skin |  | AK: Actinic keratosis |
| cSCC: Cutaneous squamous cell carcinoma | ||
| SCCIS:squamous cell carcinoma in situ | ||
| Thyroid | 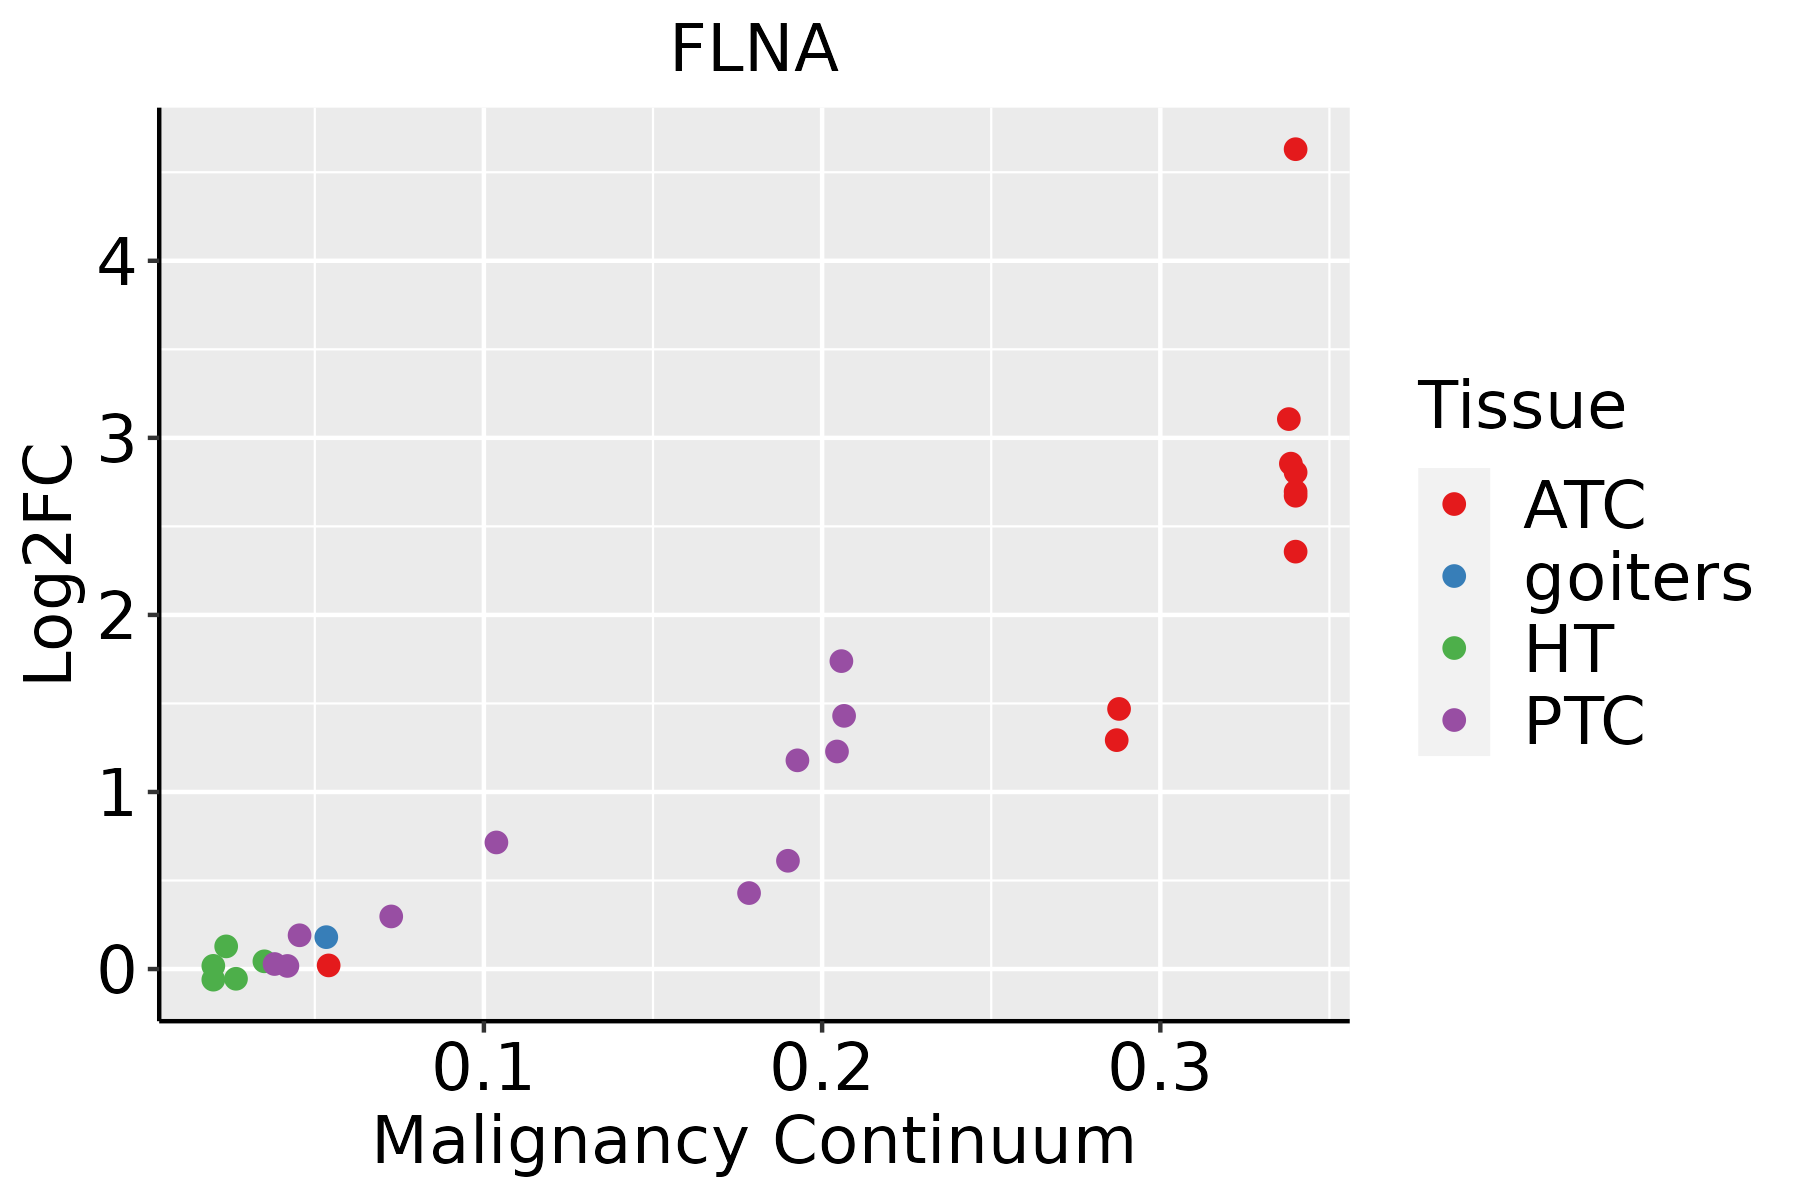 | ATC: Anaplastic thyroid cancer |
| HT: Hashimoto's thyroiditis | ||
| PTC: Papillary thyroid cancer |
| ∗log2FC in expression of this searched gene in stem-like cells from each diseased tissue sample relative to stem-like cells in normal samples in each tissue plotted against the malignancy continuum. Samples are colored based on if they are from different disease stage. |
Top |
Malignant transformation related pathway analysis |
| Find out the enriched GO biological processes and KEGG pathways involved in transition from healthy to precancer to cancer |
| Tissue | Disease Stage | Enriched GO biological Processes |
| Colorectum | AD |  |
| Colorectum | SER |  |
| Colorectum | MSS |  |
| Colorectum | MSI-H |  |
| Colorectum | FAP |  |
| ∗Top 15 enriched GO BP terms are showed in the bar plot of each disease state in each tissue. Each row represents a significant GO biological process which is colored according to the -log10(p.adjust). |
| Page: 1 2 3 4 5 6 7 8 9 |
| GO ID | Tissue | Disease Stage | Description | Gene Ratio | Bg Ratio | pvalue | p.adjust | Count |
| GO:0007015 | Colorectum | AD | actin filament organization | 167/3918 | 442/18723 | 1.65e-16 | 7.94e-14 | 167 |
| GO:0061572 | Colorectum | AD | actin filament bundle organization | 60/3918 | 161/18723 | 1.33e-06 | 4.23e-05 | 60 |
| GO:0001503 | Colorectum | AD | ossification | 106/3918 | 408/18723 | 7.68e-03 | 4.64e-02 | 106 |
| GO:00070151 | Colorectum | SER | actin filament organization | 134/2897 | 442/18723 | 1.39e-15 | 5.70e-13 | 134 |
| GO:00615721 | Colorectum | SER | actin filament bundle organization | 48/2897 | 161/18723 | 2.97e-06 | 1.19e-04 | 48 |
| GO:00015031 | Colorectum | SER | ossification | 82/2897 | 408/18723 | 6.76e-03 | 4.78e-02 | 82 |
| GO:004217616 | Endometrium | AEH | regulation of protein catabolic process | 100/2100 | 391/18723 | 9.58e-16 | 3.59e-13 | 100 |
| GO:001081015 | Endometrium | AEH | regulation of cell-substrate adhesion | 64/2100 | 221/18723 | 3.85e-13 | 9.62e-11 | 64 |
| GO:002260415 | Endometrium | AEH | regulation of cell morphogenesis | 79/2100 | 309/18723 | 1.04e-12 | 2.24e-10 | 79 |
| GO:003164716 | Endometrium | AEH | regulation of protein stability | 77/2100 | 298/18723 | 1.13e-12 | 2.26e-10 | 77 |
| GO:00315899 | Endometrium | AEH | cell-substrate adhesion | 87/2100 | 363/18723 | 3.51e-12 | 5.70e-10 | 87 |
| GO:190002410 | Endometrium | AEH | regulation of substrate adhesion-dependent cell spreading | 27/2100 | 57/18723 | 9.07e-12 | 1.43e-09 | 27 |
| GO:000701516 | Endometrium | AEH | actin filament organization | 98/2100 | 442/18723 | 1.99e-11 | 2.98e-09 | 98 |
| GO:005082116 | Endometrium | AEH | protein stabilization | 55/2100 | 191/18723 | 2.19e-11 | 3.20e-09 | 55 |
| GO:004578516 | Endometrium | AEH | positive regulation of cell adhesion | 96/2100 | 437/18723 | 5.50e-11 | 7.18e-09 | 96 |
| GO:003297016 | Endometrium | AEH | regulation of actin filament-based process | 89/2100 | 397/18723 | 9.14e-11 | 1.10e-08 | 89 |
| GO:004206016 | Endometrium | AEH | wound healing | 91/2100 | 422/18723 | 4.85e-10 | 4.61e-08 | 91 |
| GO:190495115 | Endometrium | AEH | positive regulation of establishment of protein localization | 74/2100 | 319/18723 | 7.05e-10 | 6.51e-08 | 74 |
| GO:190382916 | Endometrium | AEH | positive regulation of cellular protein localization | 66/2100 | 276/18723 | 1.57e-09 | 1.36e-07 | 66 |
| GO:190290316 | Endometrium | AEH | regulation of supramolecular fiber organization | 83/2100 | 383/18723 | 2.20e-09 | 1.78e-07 | 83 |
| Page: 1 2 3 4 5 6 7 8 9 10 11 12 13 14 15 16 17 18 19 20 21 22 23 24 25 26 27 28 29 30 31 32 33 34 35 36 37 38 39 40 41 42 43 44 45 46 47 48 49 50 51 52 53 54 55 56 57 58 59 60 61 62 63 64 65 66 |
| Pathway ID | Tissue | Disease Stage | Description | Gene Ratio | Bg Ratio | pvalue | p.adjust | qvalue | Count |
| hsa0513226 | Endometrium | AEH | Salmonella infection | 71/1197 | 249/8465 | 1.69e-09 | 3.44e-08 | 2.52e-08 | 71 |
| hsa0451015 | Endometrium | AEH | Focal adhesion | 58/1197 | 203/8465 | 4.99e-08 | 7.37e-07 | 5.39e-07 | 58 |
| hsa0520518 | Endometrium | AEH | Proteoglycans in cancer | 53/1197 | 205/8465 | 5.43e-06 | 6.53e-05 | 4.78e-05 | 53 |
| hsa05132112 | Endometrium | AEH | Salmonella infection | 71/1197 | 249/8465 | 1.69e-09 | 3.44e-08 | 2.52e-08 | 71 |
| hsa0451016 | Endometrium | AEH | Focal adhesion | 58/1197 | 203/8465 | 4.99e-08 | 7.37e-07 | 5.39e-07 | 58 |
| hsa0520519 | Endometrium | AEH | Proteoglycans in cancer | 53/1197 | 205/8465 | 5.43e-06 | 6.53e-05 | 4.78e-05 | 53 |
| hsa0513227 | Endometrium | EEC | Salmonella infection | 71/1237 | 249/8465 | 7.11e-09 | 1.30e-07 | 9.69e-08 | 71 |
| hsa0451024 | Endometrium | EEC | Focal adhesion | 58/1237 | 203/8465 | 1.61e-07 | 2.30e-06 | 1.71e-06 | 58 |
| hsa0520524 | Endometrium | EEC | Proteoglycans in cancer | 52/1237 | 205/8465 | 3.01e-05 | 3.19e-04 | 2.38e-04 | 52 |
| hsa0513236 | Endometrium | EEC | Salmonella infection | 71/1237 | 249/8465 | 7.11e-09 | 1.30e-07 | 9.69e-08 | 71 |
| hsa0451034 | Endometrium | EEC | Focal adhesion | 58/1237 | 203/8465 | 1.61e-07 | 2.30e-06 | 1.71e-06 | 58 |
| hsa0520534 | Endometrium | EEC | Proteoglycans in cancer | 52/1237 | 205/8465 | 3.01e-05 | 3.19e-04 | 2.38e-04 | 52 |
| hsa0513239 | Esophagus | HGIN | Salmonella infection | 69/1383 | 249/8465 | 3.02e-06 | 4.47e-05 | 3.55e-05 | 69 |
| hsa0520528 | Esophagus | HGIN | Proteoglycans in cancer | 47/1383 | 205/8465 | 8.23e-03 | 4.71e-02 | 3.74e-02 | 47 |
| hsa05132115 | Esophagus | HGIN | Salmonella infection | 69/1383 | 249/8465 | 3.02e-06 | 4.47e-05 | 3.55e-05 | 69 |
| hsa05205112 | Esophagus | HGIN | Proteoglycans in cancer | 47/1383 | 205/8465 | 8.23e-03 | 4.71e-02 | 3.74e-02 | 47 |
| hsa05132211 | Esophagus | ESCC | Salmonella infection | 191/4205 | 249/8465 | 6.51e-19 | 5.45e-17 | 2.79e-17 | 191 |
| hsa0520529 | Esophagus | ESCC | Proteoglycans in cancer | 138/4205 | 205/8465 | 1.79e-07 | 1.40e-06 | 7.15e-07 | 138 |
| hsa0451020 | Esophagus | ESCC | Focal adhesion | 127/4205 | 203/8465 | 1.25e-04 | 4.99e-04 | 2.56e-04 | 127 |
| hsa05132310 | Esophagus | ESCC | Salmonella infection | 191/4205 | 249/8465 | 6.51e-19 | 5.45e-17 | 2.79e-17 | 191 |
| Page: 1 2 3 4 |
Top |
Cell-cell communication analysis |
| Identification of potential cell-cell interactions between two cell types and their ligand-receptor pairs for different disease states |
| Ligand | Receptor | LRpair | Pathway | Tissue | Disease Stage |
| Page: 1 |
Top |
Single-cell gene regulatory network inference analysis |
| Find out the significant the regulons (TFs) and the target genes of each regulon across cell types for different disease states |
| TF | Cell Type | Tissue | Disease Stage | Target Gene | RSS | Regulon Activity |
| ∗The dot plots of a searched regulon are shown for all cell subpopulations in each disease state of each tissue based on the regulon specific score inferred using pySCENIC and by calculating the average expression. |
| Page: 1 |
Top |
Somatic mutation of malignant transformation related genes |
| Annotation of somatic variants for genes involved in malignant transformation |
| Hugo Symbol | Variant Class | Variant Classification | dbSNP RS | HGVSc | HGVSp | HGVSp Short | SWISSPROT | BIOTYPE | SIFT | PolyPhen | Tumor Sample Barcode | Tissue | Histology | Sex | Age | Stage | Therapy Types | Drugs | Outcome |
| FLNA | SNV | Missense_Mutation | novel | c.7115N>T | p.Ser2372Leu | p.S2372L | P21333 | protein_coding | deleterious(0.01) | probably_damaging(0.97) | TCGA-5L-AAT0-01 | Breast | breast invasive carcinoma | Female | <65 | I/II | Hormone Therapy | tamoxiphen | SD |
| FLNA | SNV | Missense_Mutation | novel | c.5633N>T | p.Gly1878Val | p.G1878V | P21333 | protein_coding | deleterious(0.01) | probably_damaging(1) | TCGA-A2-A1FW-01 | Breast | breast invasive carcinoma | Female | <65 | III/IV | Chemotherapy | cytoxan | SD |
| FLNA | SNV | Missense_Mutation | c.4510N>A | p.Asp1504Asn | p.D1504N | P21333 | protein_coding | tolerated(0.08) | benign(0.033) | TCGA-A7-A0DA-01 | Breast | breast invasive carcinoma | Female | <65 | I/II | Chemotherapy | adriamycin | SD | |
| FLNA | SNV | Missense_Mutation | novel | c.1109N>A | p.Phe370Tyr | p.F370Y | P21333 | protein_coding | tolerated(0.08) | benign(0.168) | TCGA-A7-A4SD-01 | Breast | breast invasive carcinoma | Female | <65 | I/II | Chemotherapy | taxotere | CR |
| FLNA | SNV | Missense_Mutation | rs201093148 | c.1813N>A | p.Asp605Asn | p.D605N | P21333 | protein_coding | tolerated(0.27) | benign(0.021) | TCGA-A8-A08B-01 | Breast | breast invasive carcinoma | Female | <65 | I/II | Chemotherapy | 5-fluorouracil | CR |
| FLNA | SNV | Missense_Mutation | c.4711N>C | p.Asp1571His | p.D1571H | P21333 | protein_coding | deleterious(0) | probably_damaging(0.999) | TCGA-AC-A23H-01 | Breast | breast invasive carcinoma | Female | >=65 | I/II | Unknown | Unknown | PD | |
| FLNA | SNV | Missense_Mutation | novel | c.4868G>T | p.Gly1623Val | p.G1623V | P21333 | protein_coding | deleterious(0) | probably_damaging(0.998) | TCGA-AN-A046-01 | Breast | breast invasive carcinoma | Female | >=65 | I/II | Unknown | Unknown | SD |
| FLNA | SNV | Missense_Mutation | c.5164A>G | p.Ile1722Val | p.I1722V | P21333 | protein_coding | tolerated(0.14) | benign(0.326) | TCGA-AO-A128-01 | Breast | breast invasive carcinoma | Female | <65 | I/II | Chemotherapy | doxorubicin | SD | |
| FLNA | SNV | Missense_Mutation | novel | c.4757A>G | p.Asp1586Gly | p.D1586G | P21333 | protein_coding | tolerated(0.14) | benign(0.282) | TCGA-AO-A128-01 | Breast | breast invasive carcinoma | Female | <65 | I/II | Chemotherapy | doxorubicin | SD |
| FLNA | SNV | Missense_Mutation | c.7471G>T | p.Ala2491Ser | p.A2491S | P21333 | protein_coding | deleterious(0.04) | benign(0.44) | TCGA-AR-A1AO-01 | Breast | breast invasive carcinoma | Female | <65 | I/II | Chemotherapy | doxorubicin | SD |
| Page: 1 2 3 4 5 6 7 8 9 10 11 12 13 14 15 16 17 18 19 20 21 22 23 24 25 26 27 28 29 30 31 32 33 34 35 36 37 |
Top |
Related drugs of malignant transformation related genes |
| Identification of chemicals and drugs interact with genes involved in malignant transfromation |
| (DGIdb 4.0) |
| Entrez ID | Symbol | Category | Interaction Types | Drug Claim Name | Drug Name | PMIDs |
| 2316 | FLNA | DRUGGABLE GENOME, TRANSPORTER | PTI-125 |
| Page: 1 |

Copyright 2023-Present -The University of Texas Health Science Center at Houston |