
|
|||||
|
 | |
| |
| |
| |
| |
| |
|
Gene: FGGY |
Gene summary for FGGY |
| Gene information | Species | Human | Gene symbol | FGGY | Gene ID | 55277 |
| Gene name | FGGY carbohydrate kinase domain containing | |
| Gene Alias | FGGY | |
| Cytomap | 1p32.1 | |
| Gene Type | protein-coding | GO ID | GO:0005975 | UniProtAcc | Q96C11 |
Top |
Malignant transformation analysis |
| Identification of the aberrant gene expression in precancerous and cancerous lesions by comparing the gene expression of stem-like cells in diseased tissues with normal stem cells |
| Entrez ID | Symbol | Replicates | Species | Organ | Tissue | Adj P-value | Log2FC | Malignancy |
| 55277 | FGGY | Pt14.c | Human | Liver | HCC | 2.02e-04 | -8.45e-01 | 0.0054 |
| 55277 | FGGY | Pt14.d | Human | Liver | HCC | 1.43e-24 | -6.53e-01 | 0.0143 |
| 55277 | FGGY | S028 | Human | Liver | HCC | 5.88e-03 | 5.85e-01 | 0.2503 |
| 55277 | FGGY | C04 | Human | Oral cavity | OSCC | 3.92e-02 | 2.36e-01 | 0.2633 |
| 55277 | FGGY | C21 | Human | Oral cavity | OSCC | 7.84e-37 | 9.18e-01 | 0.2678 |
| 55277 | FGGY | C30 | Human | Oral cavity | OSCC | 1.46e-02 | 2.28e-01 | 0.3055 |
| 55277 | FGGY | C38 | Human | Oral cavity | OSCC | 4.80e-09 | 8.52e-01 | 0.172 |
| 55277 | FGGY | C43 | Human | Oral cavity | OSCC | 5.48e-08 | 1.93e-01 | 0.1704 |
| 55277 | FGGY | C46 | Human | Oral cavity | OSCC | 8.21e-14 | 3.35e-01 | 0.1673 |
| 55277 | FGGY | C51 | Human | Oral cavity | OSCC | 1.26e-06 | 2.77e-01 | 0.2674 |
| 55277 | FGGY | C07 | Human | Oral cavity | OSCC | 5.67e-03 | 5.17e-01 | 0.2491 |
| 55277 | FGGY | C08 | Human | Oral cavity | OSCC | 5.89e-37 | 7.52e-01 | 0.1919 |
| 55277 | FGGY | LN22 | Human | Oral cavity | OSCC | 2.70e-04 | 3.70e-01 | 0.1733 |
| 55277 | FGGY | LN38 | Human | Oral cavity | OSCC | 2.55e-03 | 5.71e-01 | 0.168 |
| 55277 | FGGY | LN46 | Human | Oral cavity | OSCC | 7.16e-05 | 1.86e-01 | 0.1666 |
| 55277 | FGGY | EOLP-1 | Human | Oral cavity | EOLP | 2.39e-02 | 1.23e-01 | -0.0202 |
| 55277 | FGGY | SYSMH1 | Human | Oral cavity | OSCC | 1.68e-16 | 3.36e-01 | 0.1127 |
| 55277 | FGGY | SYSMH2 | Human | Oral cavity | OSCC | 8.21e-03 | 8.61e-02 | 0.2326 |
| 55277 | FGGY | SYSMH3 | Human | Oral cavity | OSCC | 6.34e-05 | 1.17e-01 | 0.2442 |
| 55277 | FGGY | SYSMH6 | Human | Oral cavity | OSCC | 1.92e-20 | 5.63e-01 | 0.1275 |
| Page: 1 2 3 4 5 |
| Tissue | Expression Dynamics | Abbreviation |
| Cervix | 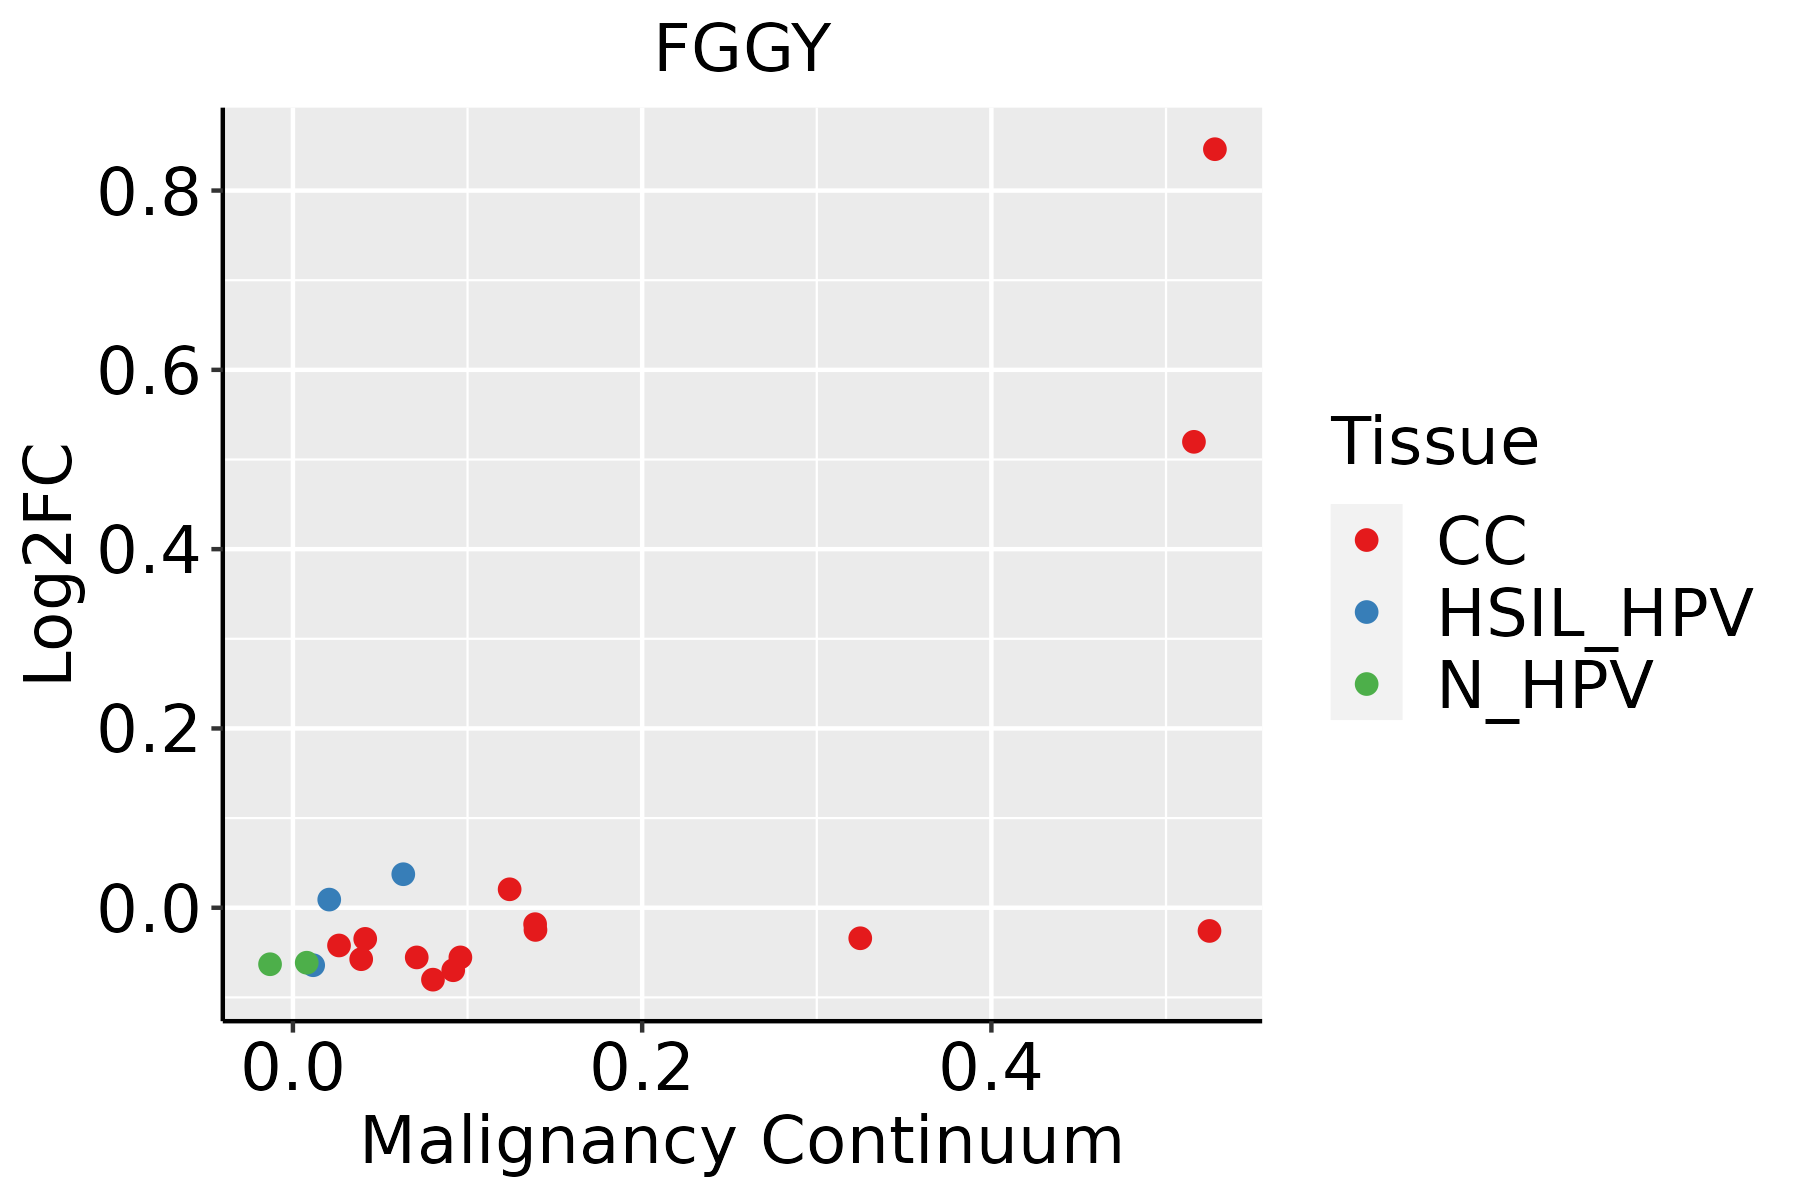 | CC: Cervix cancer |
| HSIL_HPV: HPV-infected high-grade squamous intraepithelial lesions | ||
| N_HPV: HPV-infected normal cervix | ||
| Colorectum (GSE201348) |  | FAP: Familial adenomatous polyposis |
| CRC: Colorectal cancer | ||
| Colorectum (HTA11) |  | AD: Adenomas |
| SER: Sessile serrated lesions | ||
| MSI-H: Microsatellite-high colorectal cancer | ||
| MSS: Microsatellite stable colorectal cancer | ||
| Liver | 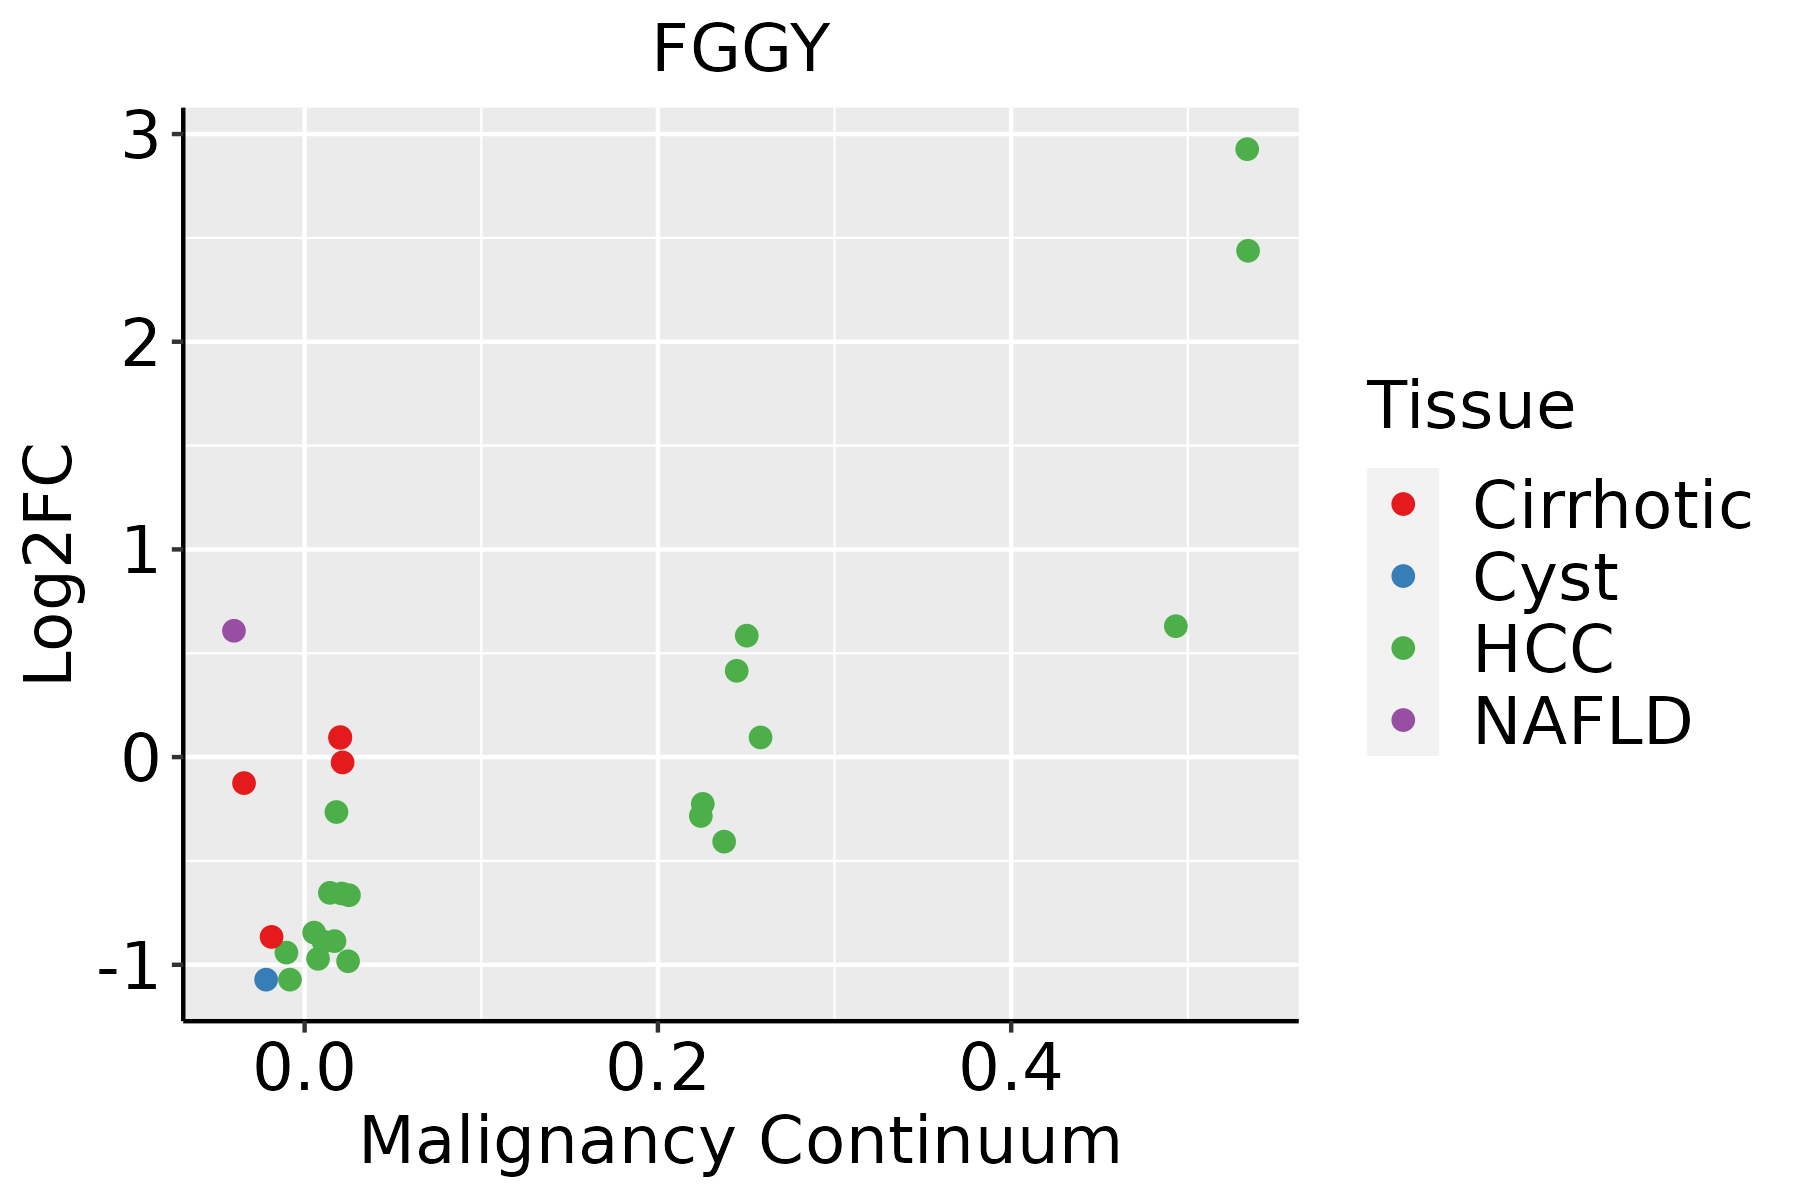 | HCC: Hepatocellular carcinoma |
| NAFLD: Non-alcoholic fatty liver disease | ||
| Oral Cavity | 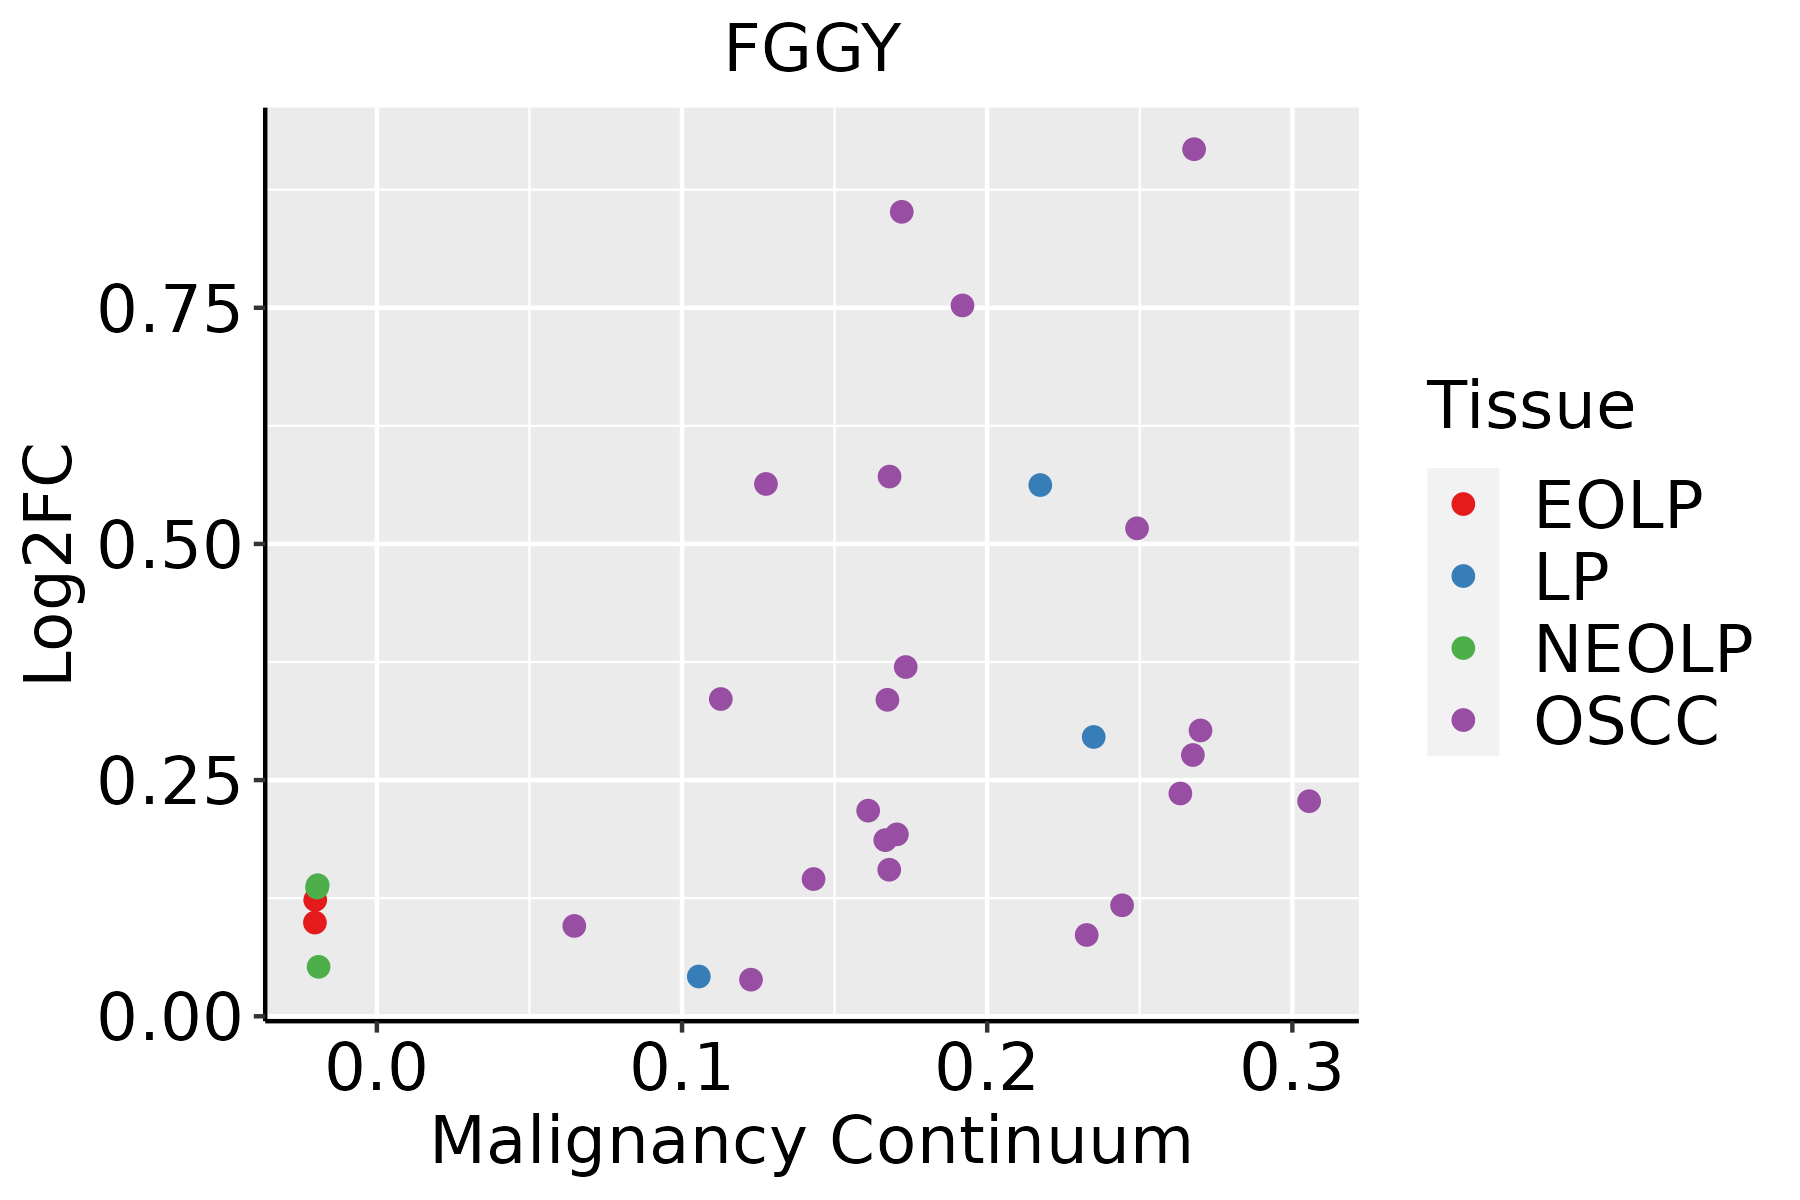 | EOLP: Erosive Oral lichen planus |
| LP: leukoplakia | ||
| NEOLP: Non-erosive oral lichen planus | ||
| OSCC: Oral squamous cell carcinoma |
| ∗log2FC in expression of this searched gene in stem-like cells from each diseased tissue sample relative to stem-like cells in normal samples in each tissue plotted against the malignancy continuum. Samples are colored based on if they are from different disease stage. |
Top |
Malignant transformation related pathway analysis |
| Find out the enriched GO biological processes and KEGG pathways involved in transition from healthy to precancer to cancer |
| Tissue | Disease Stage | Enriched GO biological Processes |
| Colorectum | AD |  |
| Colorectum | SER |  |
| Colorectum | MSS |  |
| Colorectum | MSI-H |  |
| Colorectum | FAP |  |
| ∗Top 15 enriched GO BP terms are showed in the bar plot of each disease state in each tissue. Each row represents a significant GO biological process which is colored according to the -log10(p.adjust). |
| Page: 1 2 3 4 5 6 7 8 9 |
| GO ID | Tissue | Disease Stage | Description | Gene Ratio | Bg Ratio | pvalue | p.adjust | Count |
| GO:00602498 | Cervix | CC | anatomical structure homeostasis | 63/2311 | 314/18723 | 6.03e-05 | 8.68e-04 | 63 |
| GO:0044262 | Colorectum | AD | cellular carbohydrate metabolic process | 87/3918 | 283/18723 | 6.00e-05 | 1.01e-03 | 87 |
| GO:0005996 | Colorectum | AD | monosaccharide metabolic process | 80/3918 | 257/18723 | 7.31e-05 | 1.17e-03 | 80 |
| GO:0060249 | Colorectum | AD | anatomical structure homeostasis | 94/3918 | 314/18723 | 9.37e-05 | 1.42e-03 | 94 |
| GO:00602491 | Colorectum | SER | anatomical structure homeostasis | 74/2897 | 314/18723 | 1.01e-04 | 2.13e-03 | 74 |
| GO:00059961 | Colorectum | SER | monosaccharide metabolic process | 59/2897 | 257/18723 | 9.65e-04 | 1.15e-02 | 59 |
| GO:00602492 | Colorectum | MSS | anatomical structure homeostasis | 84/3467 | 314/18723 | 1.87e-04 | 2.64e-03 | 84 |
| GO:00059962 | Colorectum | MSS | monosaccharide metabolic process | 66/3467 | 257/18723 | 2.61e-03 | 2.06e-02 | 66 |
| GO:00602493 | Colorectum | MSI-H | anatomical structure homeostasis | 38/1319 | 314/18723 | 7.73e-04 | 1.44e-02 | 38 |
| GO:00442621 | Colorectum | FAP | cellular carbohydrate metabolic process | 66/2622 | 283/18723 | 1.53e-05 | 4.01e-04 | 66 |
| GO:00059963 | Colorectum | FAP | monosaccharide metabolic process | 59/2622 | 257/18723 | 6.79e-05 | 1.28e-03 | 59 |
| GO:00602494 | Colorectum | FAP | anatomical structure homeostasis | 69/2622 | 314/18723 | 7.51e-05 | 1.37e-03 | 69 |
| GO:00602495 | Colorectum | CRC | anatomical structure homeostasis | 57/2078 | 314/18723 | 1.24e-04 | 2.41e-03 | 57 |
| GO:00442622 | Colorectum | CRC | cellular carbohydrate metabolic process | 49/2078 | 283/18723 | 1.06e-03 | 1.24e-02 | 49 |
| GO:00059965 | Liver | NAFLD | monosaccharide metabolic process | 53/1882 | 257/18723 | 2.89e-07 | 1.92e-05 | 53 |
| GO:00442623 | Liver | NAFLD | cellular carbohydrate metabolic process | 55/1882 | 283/18723 | 1.27e-06 | 6.01e-05 | 55 |
| GO:000599612 | Liver | Cirrhotic | monosaccharide metabolic process | 104/4634 | 257/18723 | 1.74e-08 | 6.32e-07 | 104 |
| GO:004426211 | Liver | Cirrhotic | cellular carbohydrate metabolic process | 97/4634 | 283/18723 | 1.89e-04 | 1.76e-03 | 97 |
| GO:000599621 | Liver | HCC | monosaccharide metabolic process | 167/7958 | 257/18723 | 2.31e-13 | 1.25e-11 | 167 |
| GO:004426221 | Liver | HCC | cellular carbohydrate metabolic process | 153/7958 | 283/18723 | 5.27e-05 | 5.00e-04 | 153 |
| Page: 1 2 |
| Pathway ID | Tissue | Disease Stage | Description | Gene Ratio | Bg Ratio | pvalue | p.adjust | qvalue | Count |
| Page: 1 |
Top |
Cell-cell communication analysis |
| Identification of potential cell-cell interactions between two cell types and their ligand-receptor pairs for different disease states |
| Ligand | Receptor | LRpair | Pathway | Tissue | Disease Stage |
| Page: 1 |
Top |
Single-cell gene regulatory network inference analysis |
| Find out the significant the regulons (TFs) and the target genes of each regulon across cell types for different disease states |
| TF | Cell Type | Tissue | Disease Stage | Target Gene | RSS | Regulon Activity |
| ∗The dot plots of a searched regulon are shown for all cell subpopulations in each disease state of each tissue based on the regulon specific score inferred using pySCENIC and by calculating the average expression. |
| Page: 1 |
Top |
Somatic mutation of malignant transformation related genes |
| Annotation of somatic variants for genes involved in malignant transformation |
| Hugo Symbol | Variant Class | Variant Classification | dbSNP RS | HGVSc | HGVSp | HGVSp Short | SWISSPROT | BIOTYPE | SIFT | PolyPhen | Tumor Sample Barcode | Tissue | Histology | Sex | Age | Stage | Therapy Types | Drugs | Outcome |
| FGGY | SNV | Missense_Mutation | c.597N>C | p.Glu199Asp | p.E199D | Q96C11 | protein_coding | tolerated(0.39) | benign(0.001) | TCGA-D8-A27G-01 | Breast | breast invasive carcinoma | Female | >=65 | I/II | Unknown | Unknown | SD | |
| FGGY | SNV | Missense_Mutation | c.1522N>G | p.Ser508Ala | p.S508A | Q96C11 | protein_coding | tolerated(0.49) | benign(0.101) | TCGA-E9-A22E-01 | Breast | breast invasive carcinoma | Female | <65 | III/IV | Chemotherapy | cyclophosphane | SD | |
| FGGY | SNV | Missense_Mutation | c.569N>C | p.Leu190Pro | p.L190P | Q96C11 | protein_coding | deleterious(0.01) | probably_damaging(0.97) | TCGA-AA-3663-01 | Colorectum | colon adenocarcinoma | Male | <65 | I/II | Unknown | Unknown | SD | |
| FGGY | SNV | Missense_Mutation | rs773705363 | c.166G>A | p.Glu56Lys | p.E56K | Q96C11 | protein_coding | tolerated(0.09) | benign(0.063) | TCGA-AA-3977-01 | Colorectum | colon adenocarcinoma | Male | >=65 | I/II | Unknown | Unknown | SD |
| FGGY | SNV | Missense_Mutation | c.35A>G | p.Tyr12Cys | p.Y12C | Q96C11 | protein_coding | deleterious(0) | probably_damaging(0.987) | TCGA-CM-4743-01 | Colorectum | colon adenocarcinoma | Male | >=65 | I/II | Chemotherapy | capecitabine | SD | |
| FGGY | SNV | Missense_Mutation | rs747128652 | c.1247N>T | p.Pro416Leu | p.P416L | Q96C11 | protein_coding | tolerated_low_confidence(0.27) | benign(0.007) | TCGA-CM-6678-01 | Colorectum | colon adenocarcinoma | Female | <65 | I/II | Chemotherapy | fluorouracil | SD |
| FGGY | SNV | Missense_Mutation | novel | c.1250N>A | p.Ala417Asp | p.A417D | Q96C11 | protein_coding | tolerated_low_confidence(0.65) | benign(0.367) | TCGA-D5-6928-01 | Colorectum | colon adenocarcinoma | Male | >=65 | I/II | Unknown | Unknown | SD |
| FGGY | SNV | Missense_Mutation | rs531685698 | c.326N>A | p.Arg109Gln | p.R109Q | Q96C11 | protein_coding | tolerated(0.62) | benign(0.045) | TCGA-DM-A0XD-01 | Colorectum | colon adenocarcinoma | Male | >=65 | I/II | Unknown | Unknown | PD |
| FGGY | SNV | Missense_Mutation | c.940N>T | p.Gly314Trp | p.G314W | Q96C11 | protein_coding | deleterious(0) | probably_damaging(1) | TCGA-F4-6808-01 | Colorectum | colon adenocarcinoma | Female | <65 | I/II | Unknown | Unknown | SD | |
| FGGY | SNV | Missense_Mutation | c.449T>G | p.Leu150Arg | p.L150R | Q96C11 | protein_coding | deleterious(0) | probably_damaging(0.997) | TCGA-AH-6643-01 | Colorectum | rectum adenocarcinoma | Male | <65 | III/IV | Chemotherapy | oxaliplatin | PD |
| Page: 1 2 3 4 5 6 |
Top |
Related drugs of malignant transformation related genes |
| Identification of chemicals and drugs interact with genes involved in malignant transfromation |
| (DGIdb 4.0) |
| Entrez ID | Symbol | Category | Interaction Types | Drug Claim Name | Drug Name | PMIDs |
| Page: 1 |

Copyright 2023-Present -The University of Texas Health Science Center at Houston |