
|
|||||
|
 | |
| |
| |
| |
| |
| |
|
Gene: FGFR2 |
Gene summary for FGFR2 |
| Gene information | Species | Human | Gene symbol | FGFR2 | Gene ID | 2263 |
| Gene name | fibroblast growth factor receptor 2 | |
| Gene Alias | BBDS | |
| Cytomap | 10q26.13 | |
| Gene Type | protein-coding | GO ID | GO:0000003 | UniProtAcc | P21802 |
Top |
Malignant transformation analysis |
| Identification of the aberrant gene expression in precancerous and cancerous lesions by comparing the gene expression of stem-like cells in diseased tissues with normal stem cells |
| Entrez ID | Symbol | Replicates | Species | Organ | Tissue | Adj P-value | Log2FC | Malignancy |
| 2263 | FGFR2 | P61T-E | Human | Esophagus | ESCC | 6.45e-05 | 6.97e-02 | 0.099 |
| 2263 | FGFR2 | P62T-E | Human | Esophagus | ESCC | 1.50e-11 | 7.68e-02 | 0.1302 |
| 2263 | FGFR2 | P65T-E | Human | Esophagus | ESCC | 5.86e-20 | 3.77e-01 | 0.0978 |
| 2263 | FGFR2 | P74T-E | Human | Esophagus | ESCC | 2.76e-05 | 2.53e-01 | 0.1479 |
| 2263 | FGFR2 | P75T-E | Human | Esophagus | ESCC | 2.19e-05 | -1.95e-01 | 0.1125 |
| 2263 | FGFR2 | P79T-E | Human | Esophagus | ESCC | 1.83e-15 | 2.46e-01 | 0.1154 |
| 2263 | FGFR2 | P82T-E | Human | Esophagus | ESCC | 9.87e-12 | 1.57e-01 | 0.1072 |
| 2263 | FGFR2 | P91T-E | Human | Esophagus | ESCC | 1.78e-03 | 2.31e-01 | 0.1828 |
| 2263 | FGFR2 | P107T-E | Human | Esophagus | ESCC | 5.59e-12 | -7.68e-03 | 0.171 |
| 2263 | FGFR2 | P127T-E | Human | Esophagus | ESCC | 9.93e-14 | -6.97e-02 | 0.0826 |
| 2263 | FGFR2 | P128T-E | Human | Esophagus | ESCC | 9.19e-13 | 1.45e-01 | 0.1241 |
| 2263 | FGFR2 | P130T-E | Human | Esophagus | ESCC | 8.86e-15 | 6.04e-01 | 0.1676 |
| 2263 | FGFR2 | S43 | Human | Liver | Cirrhotic | 1.14e-21 | 3.42e-01 | -0.0187 |
| 2263 | FGFR2 | HCC1_Meng | Human | Liver | HCC | 1.55e-59 | -3.47e-01 | 0.0246 |
| 2263 | FGFR2 | HCC2_Meng | Human | Liver | HCC | 2.11e-15 | -4.36e-01 | 0.0107 |
| 2263 | FGFR2 | cirrhotic1 | Human | Liver | Cirrhotic | 1.37e-11 | 1.85e-01 | 0.0202 |
| 2263 | FGFR2 | cirrhotic2 | Human | Liver | Cirrhotic | 2.44e-25 | 4.01e-01 | 0.0201 |
| 2263 | FGFR2 | cirrhotic3 | Human | Liver | Cirrhotic | 3.07e-06 | -9.28e-02 | 0.0215 |
| 2263 | FGFR2 | p6 | Human | Liver | Cyst | 2.89e-04 | 6.67e-01 | -0.0218 |
| 2263 | FGFR2 | HCC2 | Human | Liver | HCC | 2.42e-04 | 8.18e-01 | 0.5341 |
| Page: 1 2 3 4 5 6 7 8 |
| Tissue | Expression Dynamics | Abbreviation |
| Cervix | 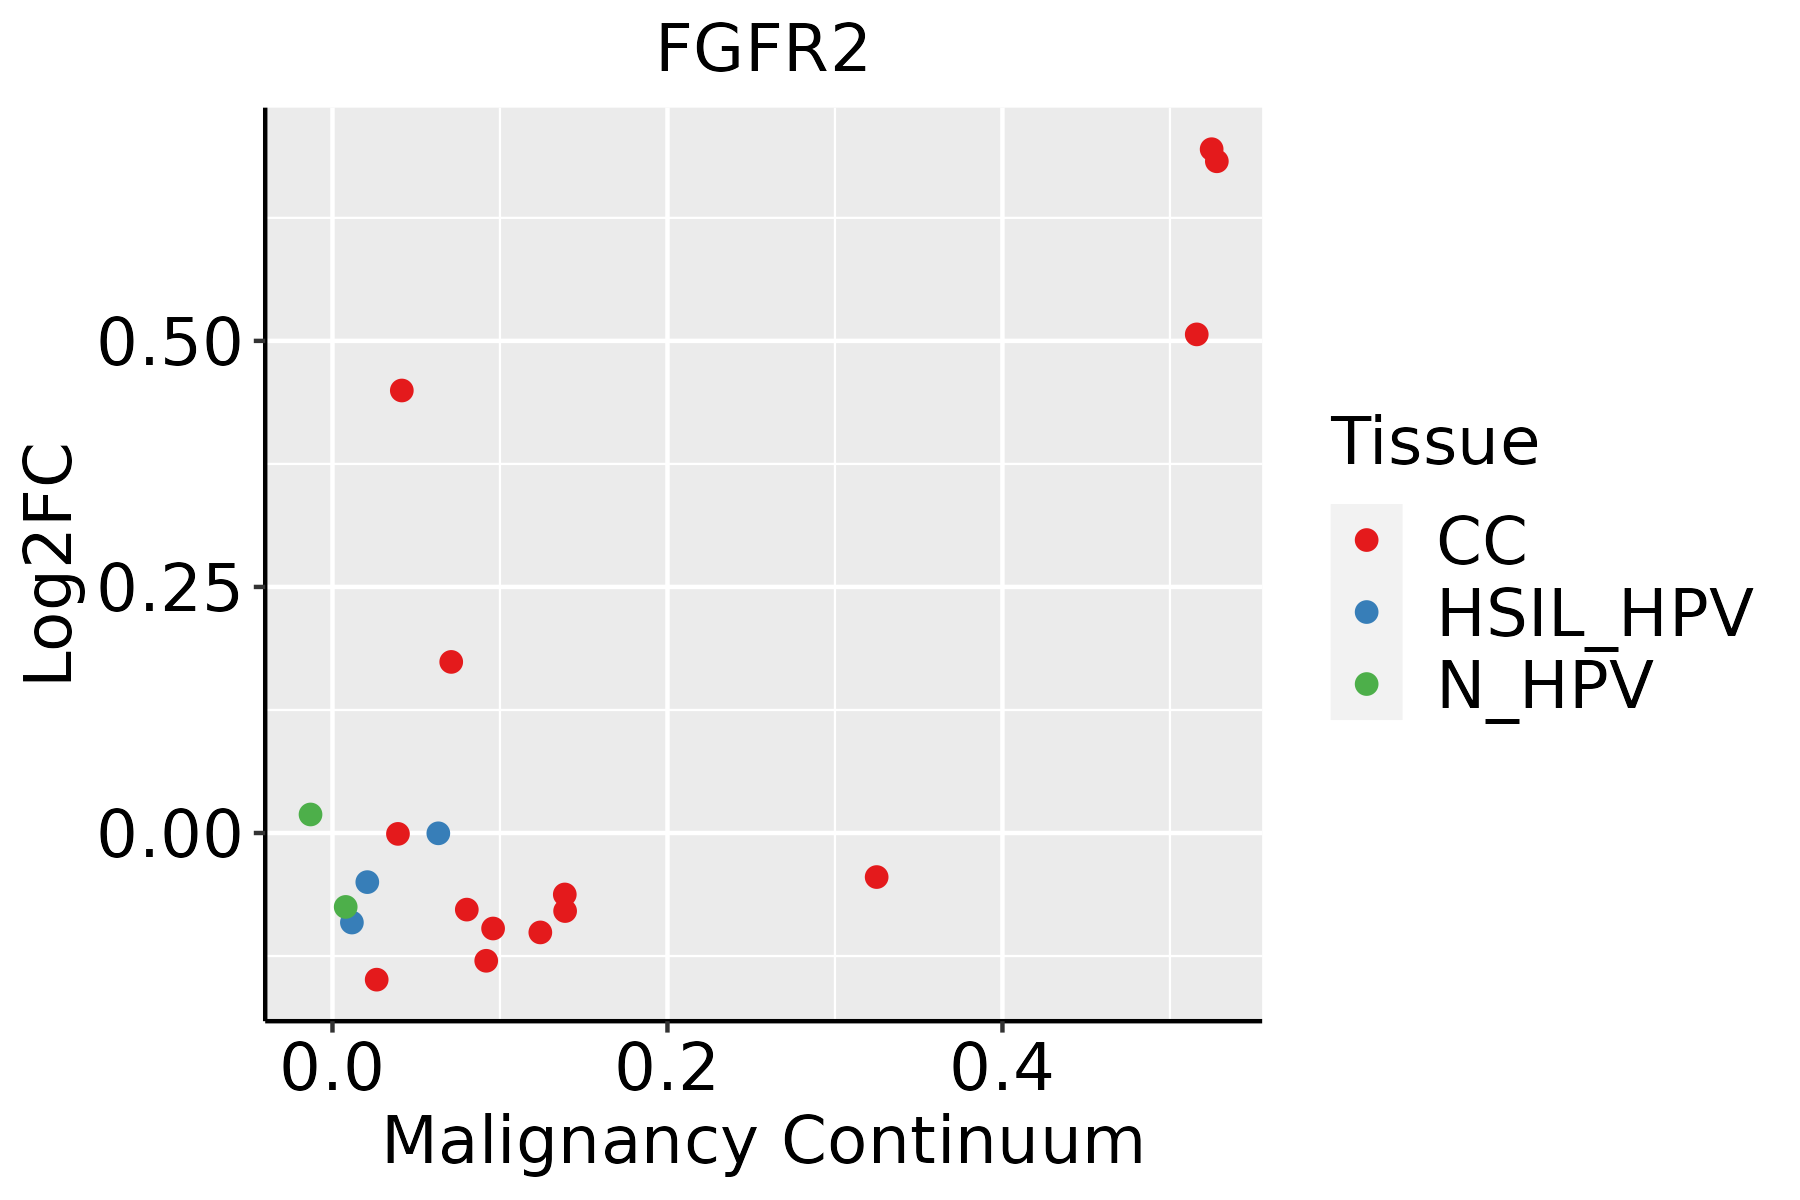 | CC: Cervix cancer |
| HSIL_HPV: HPV-infected high-grade squamous intraepithelial lesions | ||
| N_HPV: HPV-infected normal cervix | ||
| Colorectum (GSE201348) | 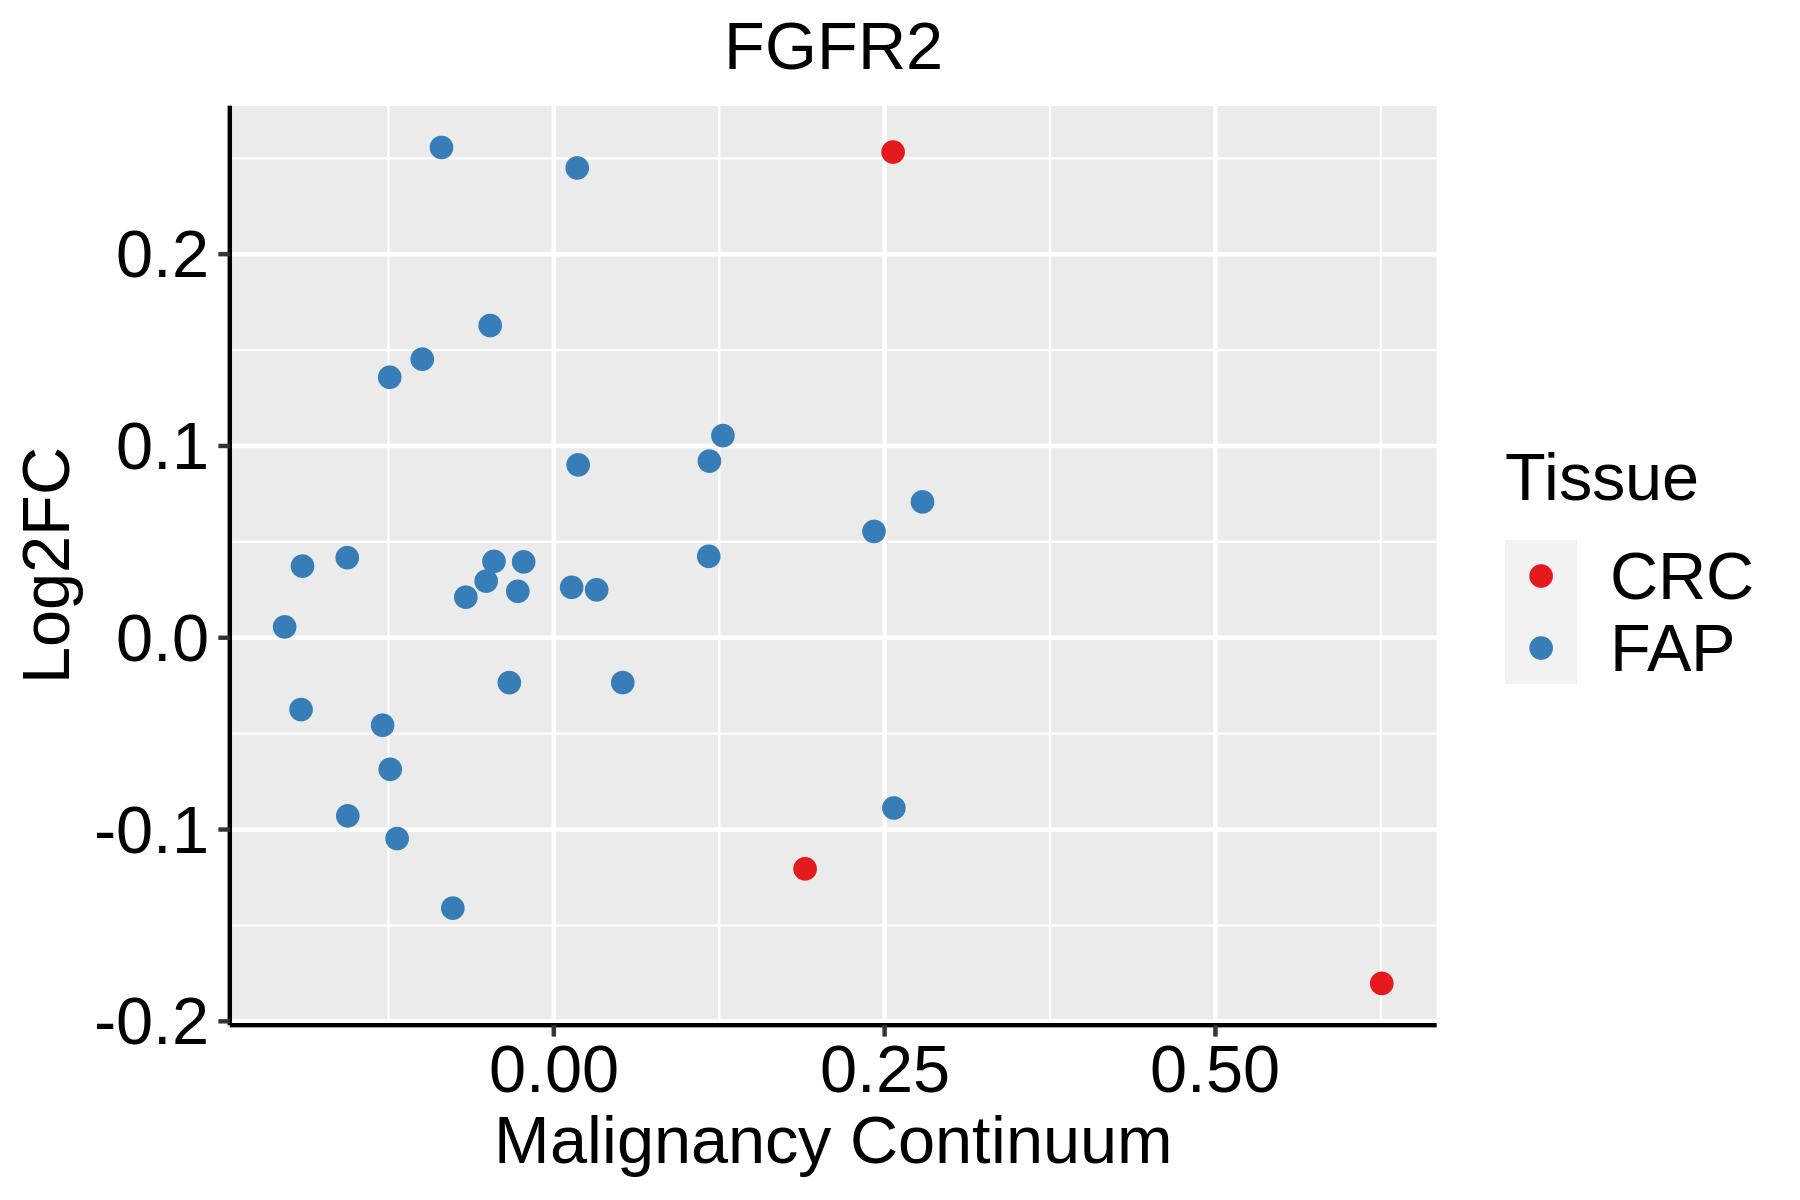 | FAP: Familial adenomatous polyposis |
| CRC: Colorectal cancer | ||
| Colorectum (HTA11) |  | AD: Adenomas |
| SER: Sessile serrated lesions | ||
| MSI-H: Microsatellite-high colorectal cancer | ||
| MSS: Microsatellite stable colorectal cancer | ||
| Endometrium |  | AEH: Atypical endometrial hyperplasia |
| EEC: Endometrioid Cancer | ||
| Esophagus | 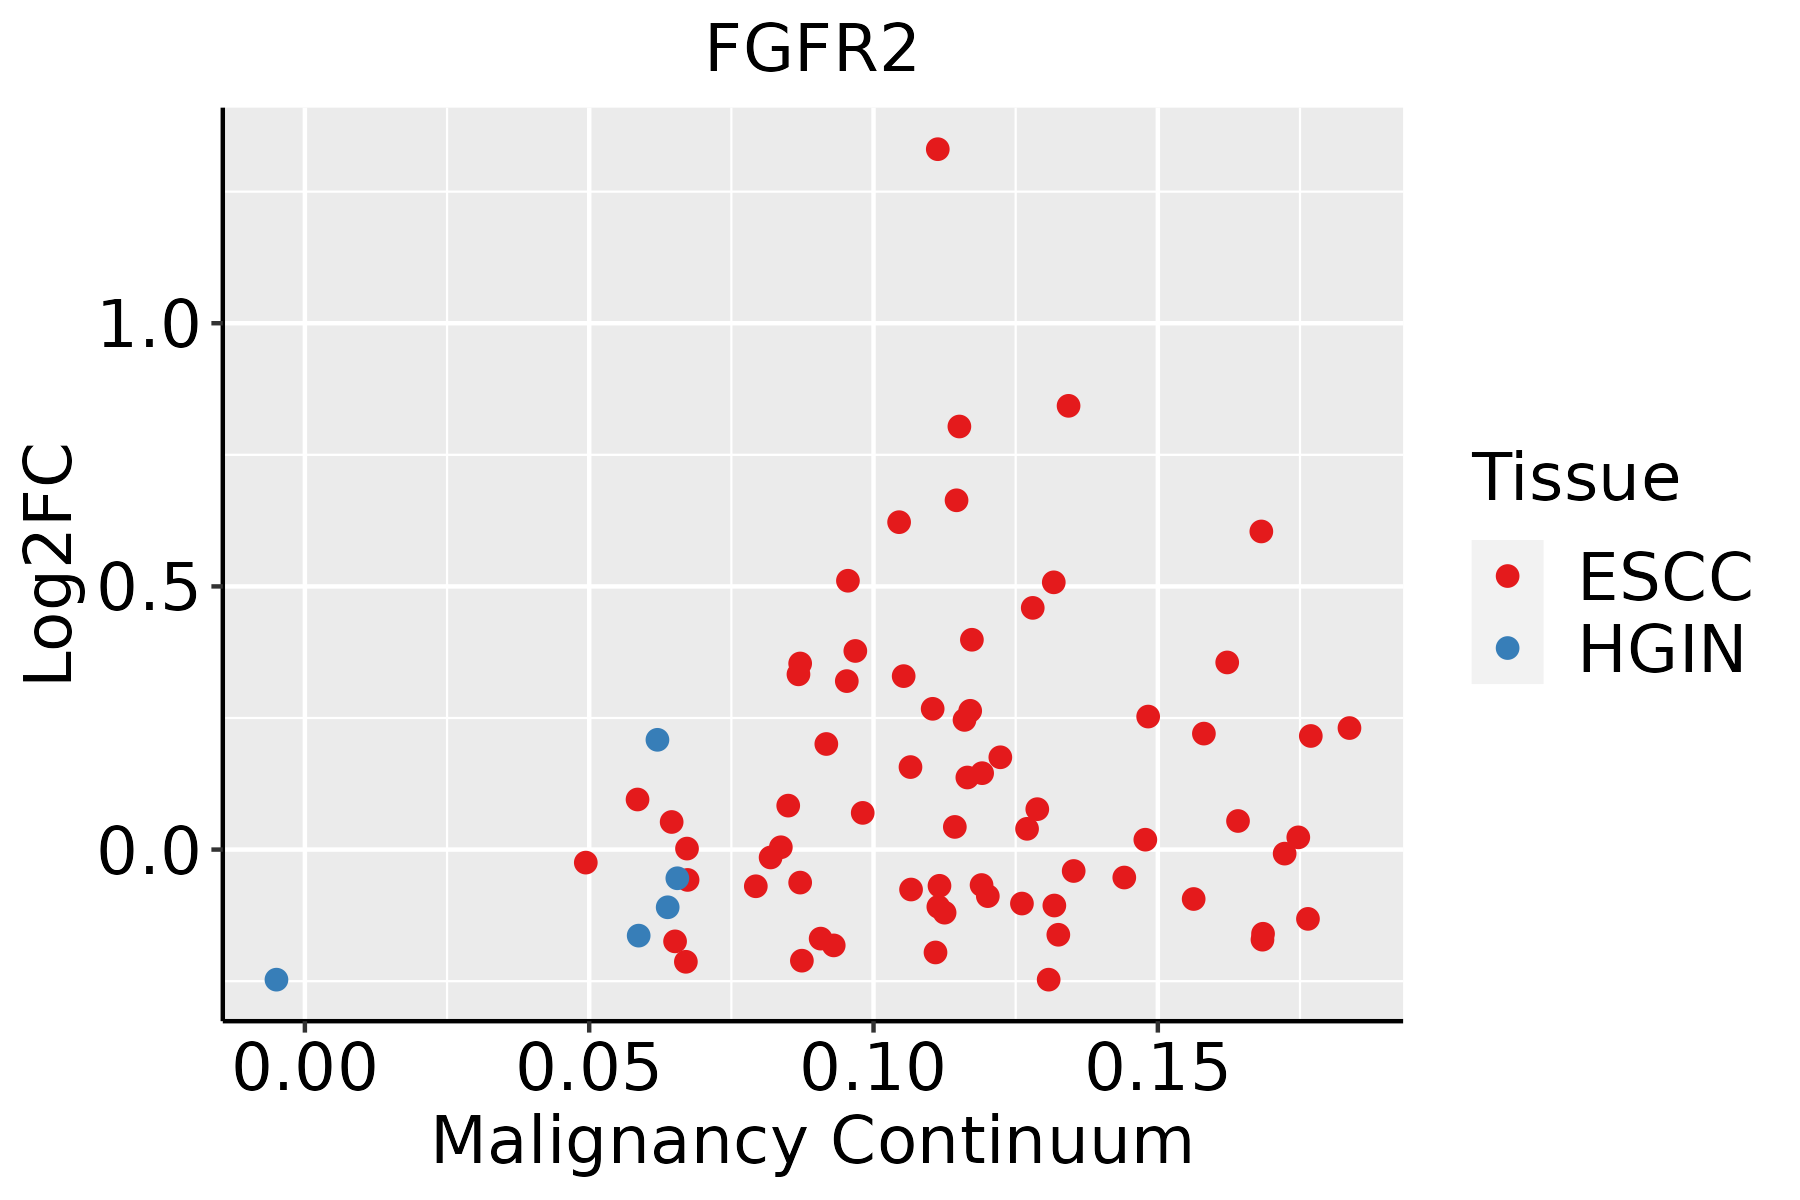 | ESCC: Esophageal squamous cell carcinoma |
| HGIN: High-grade intraepithelial neoplasias | ||
| LGIN: Low-grade intraepithelial neoplasias | ||
| Liver | 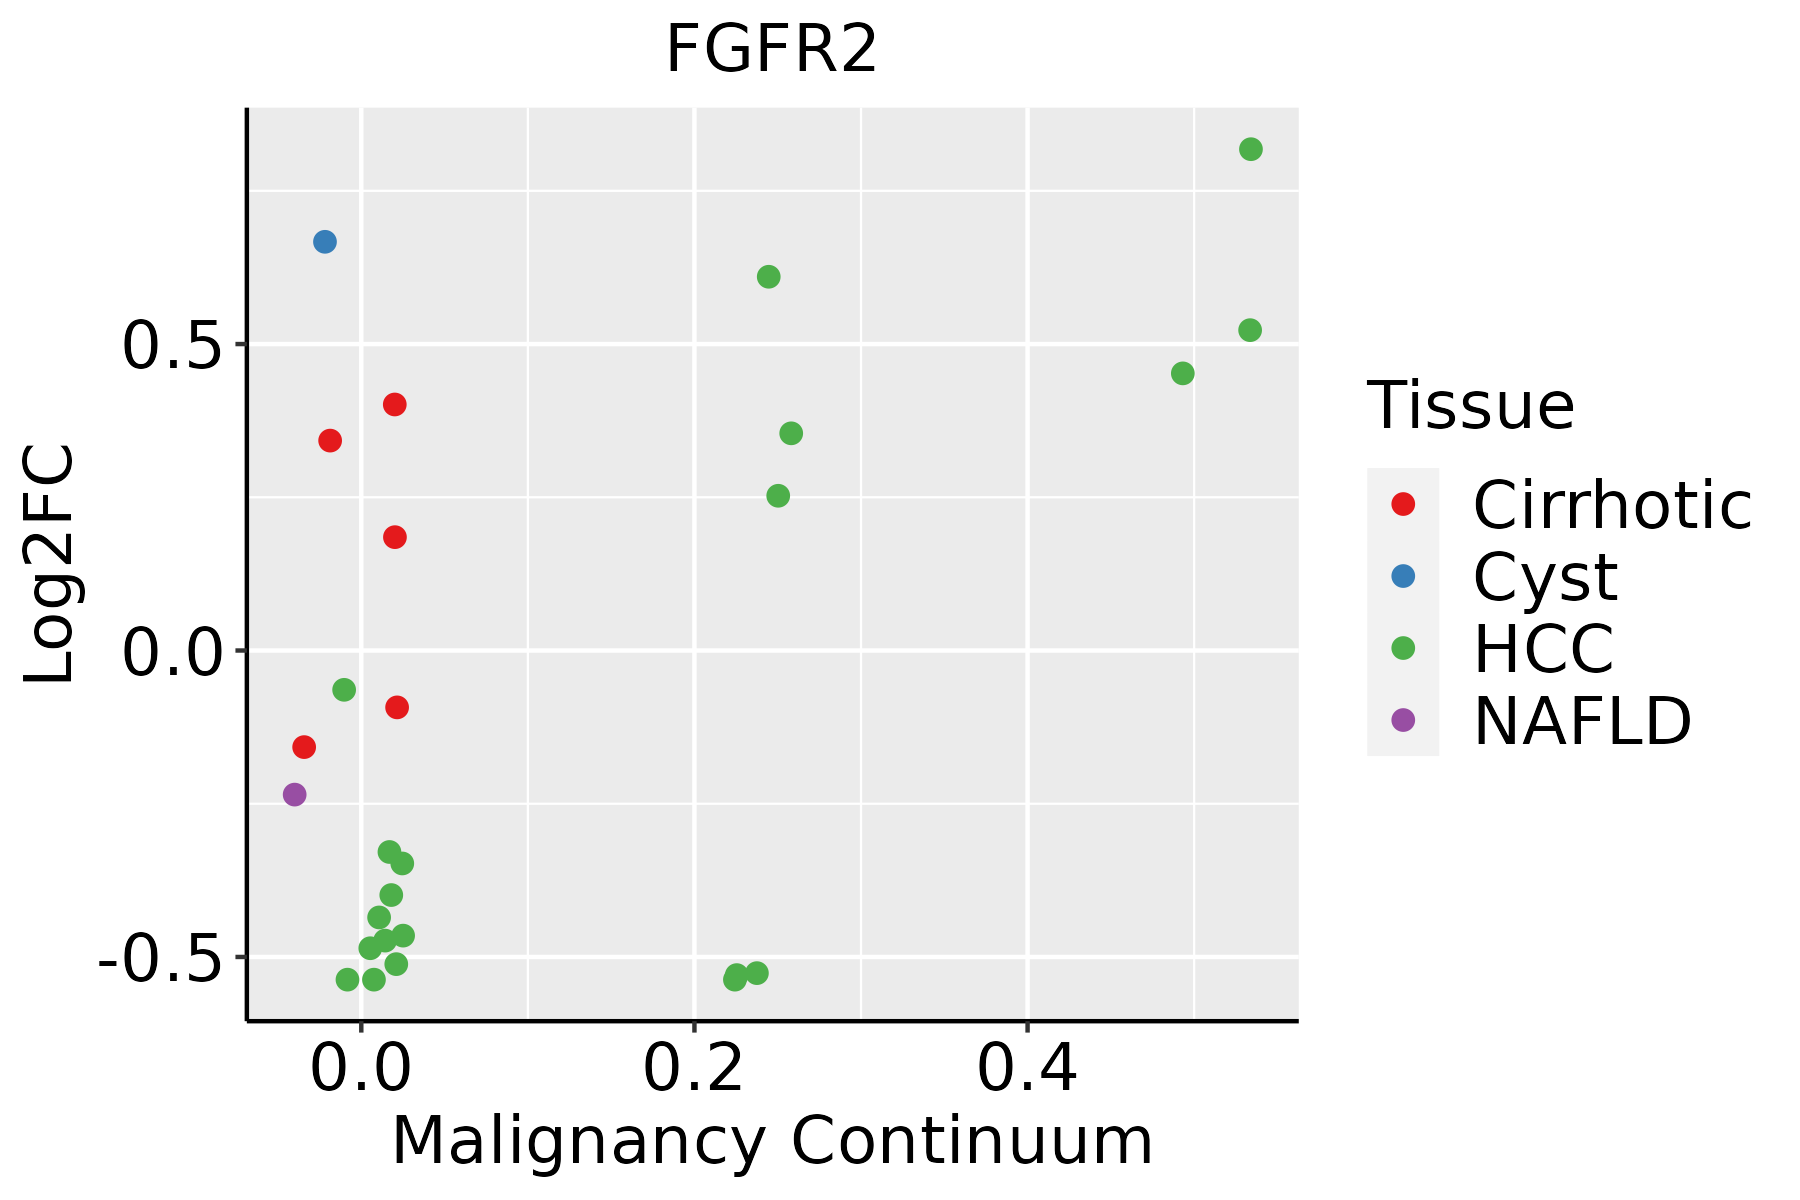 | HCC: Hepatocellular carcinoma |
| NAFLD: Non-alcoholic fatty liver disease | ||
| Oral Cavity | 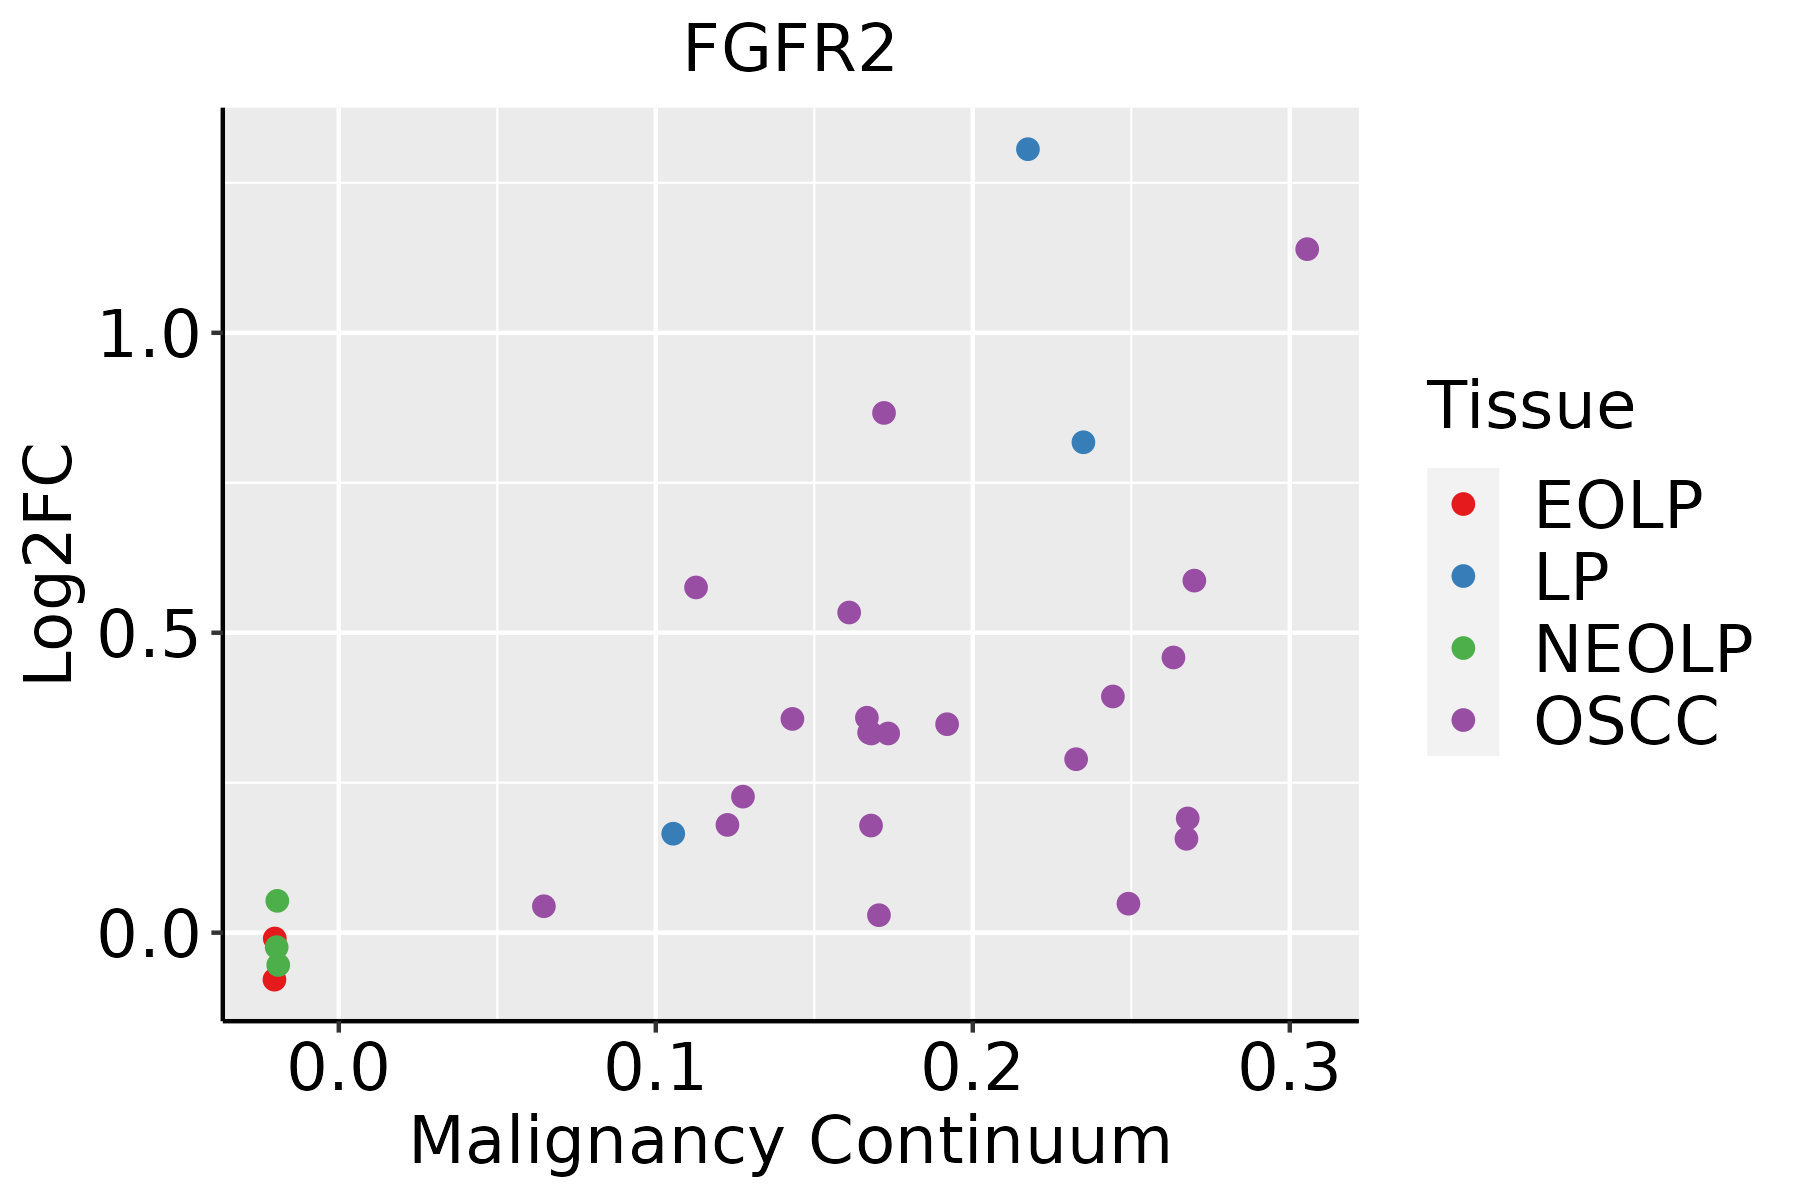 | EOLP: Erosive Oral lichen planus |
| LP: leukoplakia | ||
| NEOLP: Non-erosive oral lichen planus | ||
| OSCC: Oral squamous cell carcinoma | ||
| Prostate | 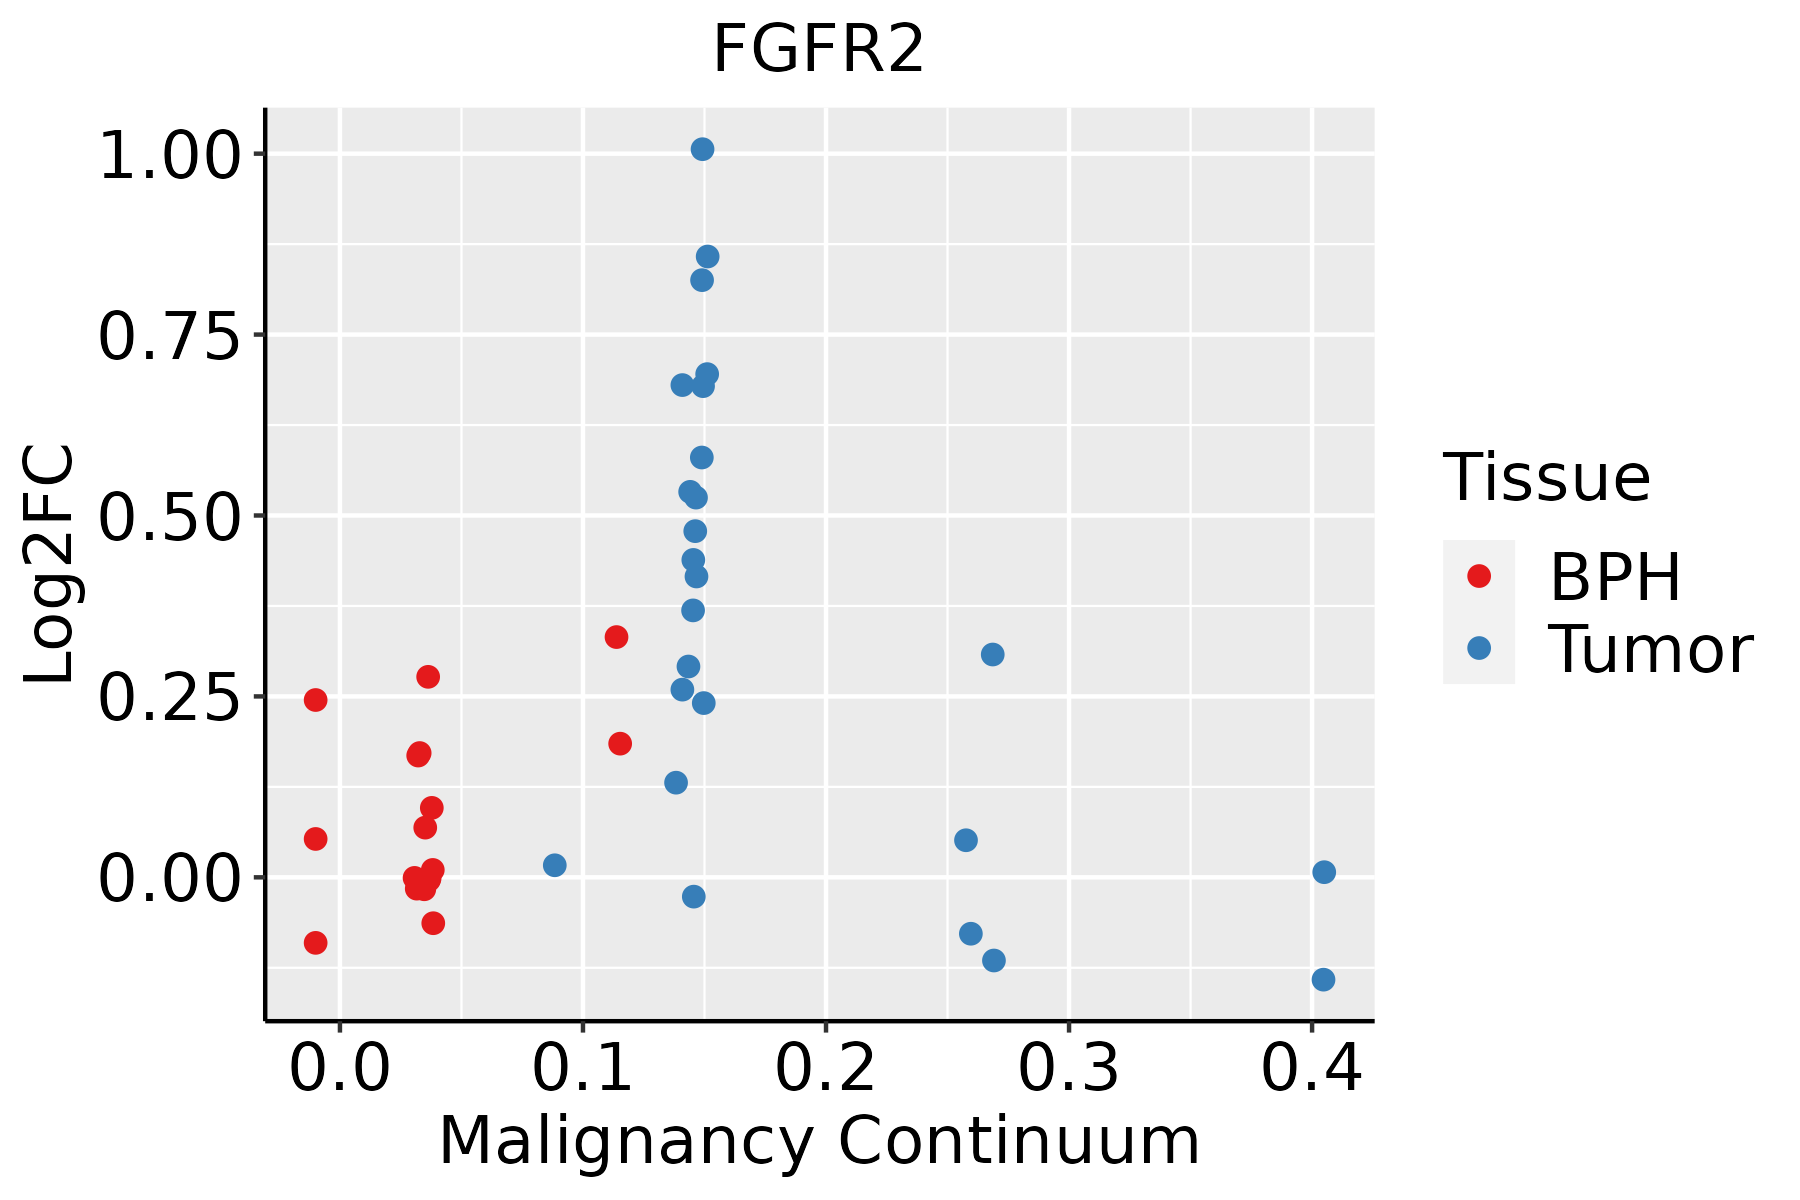 | BPH: Benign Prostatic Hyperplasia |
| Skin |  | AK: Actinic keratosis |
| cSCC: Cutaneous squamous cell carcinoma | ||
| SCCIS:squamous cell carcinoma in situ | ||
| Thyroid | 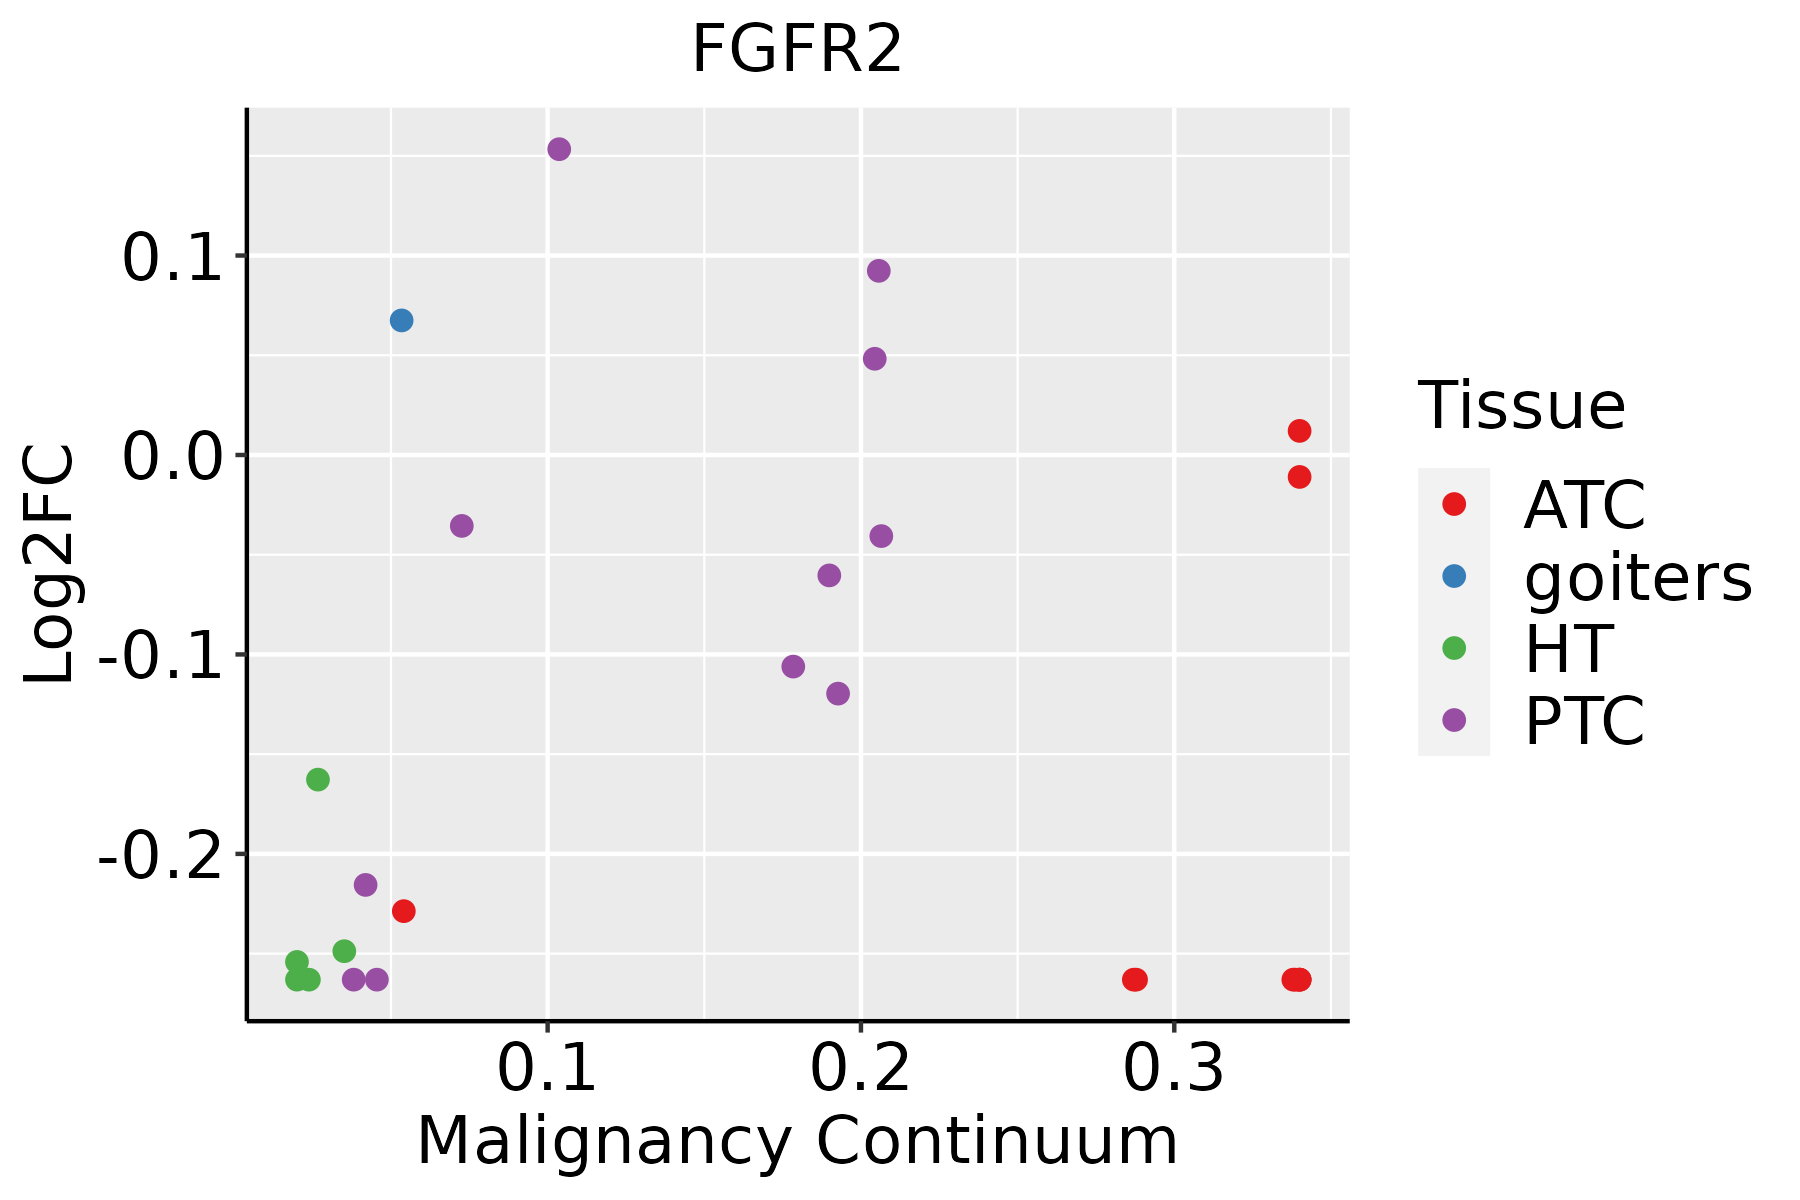 | ATC: Anaplastic thyroid cancer |
| HT: Hashimoto's thyroiditis | ||
| PTC: Papillary thyroid cancer |
| ∗log2FC in expression of this searched gene in stem-like cells from each diseased tissue sample relative to stem-like cells in normal samples in each tissue plotted against the malignancy continuum. Samples are colored based on if they are from different disease stage. |
Top |
Malignant transformation related pathway analysis |
| Find out the enriched GO biological processes and KEGG pathways involved in transition from healthy to precancer to cancer |
| Tissue | Disease Stage | Enriched GO biological Processes |
| Colorectum | AD |  |
| Colorectum | SER |  |
| Colorectum | MSS |  |
| Colorectum | MSI-H |  |
| Colorectum | FAP |  |
| ∗Top 15 enriched GO BP terms are showed in the bar plot of each disease state in each tissue. Each row represents a significant GO biological process which is colored according to the -log10(p.adjust). |
| Page: 1 2 3 4 5 6 7 8 9 |
| GO ID | Tissue | Disease Stage | Description | Gene Ratio | Bg Ratio | pvalue | p.adjust | Count |
| GO:004206010 | Cervix | CC | wound healing | 109/2311 | 422/18723 | 1.84e-14 | 1.57e-11 | 109 |
| GO:00085446 | Cervix | CC | epidermis development | 83/2311 | 324/18723 | 3.91e-11 | 8.54e-09 | 83 |
| GO:00435884 | Cervix | CC | skin development | 71/2311 | 263/18723 | 8.04e-11 | 1.46e-08 | 71 |
| GO:00506737 | Cervix | CC | epithelial cell proliferation | 98/2311 | 437/18723 | 2.01e-09 | 2.15e-07 | 98 |
| GO:00160557 | Cervix | CC | Wnt signaling pathway | 98/2311 | 444/18723 | 4.82e-09 | 4.65e-07 | 98 |
| GO:01987387 | Cervix | CC | cell-cell signaling by wnt | 98/2311 | 446/18723 | 6.16e-09 | 5.58e-07 | 98 |
| GO:003367410 | Cervix | CC | positive regulation of kinase activity | 101/2311 | 467/18723 | 8.66e-09 | 7.22e-07 | 101 |
| GO:00301117 | Cervix | CC | regulation of Wnt signaling pathway | 76/2311 | 328/18723 | 3.05e-08 | 2.08e-06 | 76 |
| GO:00506787 | Cervix | CC | regulation of epithelial cell proliferation | 83/2311 | 381/18723 | 1.31e-07 | 6.42e-06 | 83 |
| GO:00018908 | Cervix | CC | placenta development | 40/2311 | 144/18723 | 4.59e-07 | 1.77e-05 | 40 |
| GO:00022379 | Cervix | CC | response to molecule of bacterial origin | 78/2311 | 363/18723 | 5.55e-07 | 2.06e-05 | 78 |
| GO:00324969 | Cervix | CC | response to lipopolysaccharide | 74/2311 | 343/18723 | 9.15e-07 | 3.25e-05 | 74 |
| GO:00614588 | Cervix | CC | reproductive system development | 87/2311 | 427/18723 | 1.37e-06 | 4.55e-05 | 87 |
| GO:00608287 | Cervix | CC | regulation of canonical Wnt signaling pathway | 58/2311 | 253/18723 | 1.83e-06 | 5.89e-05 | 58 |
| GO:00486088 | Cervix | CC | reproductive structure development | 86/2311 | 424/18723 | 1.90e-06 | 5.97e-05 | 86 |
| GO:00600707 | Cervix | CC | canonical Wnt signaling pathway | 66/2311 | 303/18723 | 2.47e-06 | 7.35e-05 | 66 |
| GO:00457876 | Cervix | CC | positive regulation of cell cycle | 66/2311 | 313/18723 | 7.78e-06 | 1.81e-04 | 66 |
| GO:00615647 | Cervix | CC | axon development | 89/2311 | 467/18723 | 1.71e-05 | 3.27e-04 | 89 |
| GO:004873210 | Cervix | CC | gland development | 84/2311 | 436/18723 | 1.93e-05 | 3.54e-04 | 84 |
| GO:00309019 | Cervix | CC | midbrain development | 26/2311 | 90/18723 | 2.12e-05 | 3.82e-04 | 26 |
| Page: 1 2 3 4 5 6 7 8 9 10 11 12 13 14 15 16 17 18 19 20 21 22 23 24 25 26 27 28 29 30 31 32 33 34 35 36 37 38 39 40 41 42 43 44 45 46 47 48 49 50 51 52 53 54 55 56 57 58 59 60 61 62 63 64 65 66 67 68 69 70 |
| Pathway ID | Tissue | Disease Stage | Description | Gene Ratio | Bg Ratio | pvalue | p.adjust | qvalue | Count |
| hsa0481016 | Cervix | CC | Regulation of actin cytoskeleton | 64/1267 | 229/8465 | 2.24e-07 | 2.59e-06 | 1.53e-06 | 64 |
| hsa0401512 | Cervix | CC | Rap1 signaling pathway | 56/1267 | 210/8465 | 6.23e-06 | 5.61e-05 | 3.32e-05 | 56 |
| hsa0414418 | Cervix | CC | Endocytosis | 64/1267 | 251/8465 | 6.97e-06 | 6.10e-05 | 3.61e-05 | 64 |
| hsa052157 | Cervix | CC | Prostate cancer | 27/1267 | 97/8465 | 7.54e-04 | 3.39e-03 | 2.01e-03 | 27 |
| hsa040142 | Cervix | CC | Ras signaling pathway | 51/1267 | 236/8465 | 3.55e-03 | 1.34e-02 | 7.91e-03 | 51 |
| hsa040109 | Cervix | CC | MAPK signaling pathway | 62/1267 | 302/8465 | 4.89e-03 | 1.67e-02 | 9.86e-03 | 62 |
| hsa0523010 | Cervix | CC | Central carbon metabolism in cancer | 18/1267 | 70/8465 | 1.29e-02 | 3.87e-02 | 2.29e-02 | 18 |
| hsa0481017 | Cervix | CC | Regulation of actin cytoskeleton | 64/1267 | 229/8465 | 2.24e-07 | 2.59e-06 | 1.53e-06 | 64 |
| hsa0401513 | Cervix | CC | Rap1 signaling pathway | 56/1267 | 210/8465 | 6.23e-06 | 5.61e-05 | 3.32e-05 | 56 |
| hsa0414419 | Cervix | CC | Endocytosis | 64/1267 | 251/8465 | 6.97e-06 | 6.10e-05 | 3.61e-05 | 64 |
| hsa0521512 | Cervix | CC | Prostate cancer | 27/1267 | 97/8465 | 7.54e-04 | 3.39e-03 | 2.01e-03 | 27 |
| hsa0401411 | Cervix | CC | Ras signaling pathway | 51/1267 | 236/8465 | 3.55e-03 | 1.34e-02 | 7.91e-03 | 51 |
| hsa0401012 | Cervix | CC | MAPK signaling pathway | 62/1267 | 302/8465 | 4.89e-03 | 1.67e-02 | 9.86e-03 | 62 |
| hsa0523013 | Cervix | CC | Central carbon metabolism in cancer | 18/1267 | 70/8465 | 1.29e-02 | 3.87e-02 | 2.29e-02 | 18 |
| hsa04144 | Colorectum | AD | Endocytosis | 111/2092 | 251/8465 | 5.95e-12 | 1.42e-10 | 9.08e-11 | 111 |
| hsa05230 | Colorectum | AD | Central carbon metabolism in cancer | 33/2092 | 70/8465 | 3.61e-05 | 3.19e-04 | 2.03e-04 | 33 |
| hsa04015 | Colorectum | AD | Rap1 signaling pathway | 71/2092 | 210/8465 | 1.72e-03 | 9.68e-03 | 6.18e-03 | 71 |
| hsa04810 | Colorectum | AD | Regulation of actin cytoskeleton | 75/2092 | 229/8465 | 3.36e-03 | 1.76e-02 | 1.12e-02 | 75 |
| hsa05215 | Colorectum | AD | Prostate cancer | 35/2092 | 97/8465 | 7.95e-03 | 3.13e-02 | 2.00e-02 | 35 |
| hsa01521 | Colorectum | AD | EGFR tyrosine kinase inhibitor resistance | 29/2092 | 79/8465 | 1.15e-02 | 4.24e-02 | 2.71e-02 | 29 |
| Page: 1 2 3 4 5 6 7 8 |
Top |
Cell-cell communication analysis |
| Identification of potential cell-cell interactions between two cell types and their ligand-receptor pairs for different disease states |
| Ligand | Receptor | LRpair | Pathway | Tissue | Disease Stage |
| FGF7 | FGFR2 | FGF7_FGFR2 | FGF | Cervix | ADJ |
| FGF1 | FGFR2 | FGF1_FGFR2 | FGF | Cervix | CC |
| FGF7 | FGFR2 | FGF7_FGFR2 | FGF | Cervix | CC |
| FGF2 | FGFR2 | FGF2_FGFR2 | FGF | CRC | ADJ |
| FGF7 | FGFR2 | FGF7_FGFR2 | FGF | CRC | CRC |
| FGF2 | FGFR2 | FGF2_FGFR2 | FGF | Endometrium | ADJ |
| FGF2 | FGFR2 | FGF2_FGFR2 | FGF | Endometrium | AEH |
| FGF2 | FGFR2 | FGF2_FGFR2 | FGF | Endometrium | EEC |
| FGF7 | FGFR2 | FGF7_FGFR2 | FGF | Endometrium | EEC |
| FGF1 | FGFR2 | FGF1_FGFR2 | FGF | HNSCC | OSCC |
| FGF2 | FGFR2 | FGF2_FGFR2 | FGF | HNSCC | OSCC |
| FGF7 | FGFR2 | FGF7_FGFR2 | FGF | HNSCC | OSCC |
| FGF18 | FGFR2 | FGF18_FGFR2 | FGF | HNSCC | OSCC |
| FGF2 | FGFR2 | FGF2_FGFR2 | FGF | HNSCC | Precancer |
| FGF7 | FGFR2 | FGF7_FGFR2 | FGF | HNSCC | Precancer |
| FGF7 | FGFR2 | FGF7_FGFR2 | FGF | Lung | AAH |
| FGF7 | FGFR2 | FGF7_FGFR2 | FGF | Lung | ADJ |
| FGF7 | FGFR2 | FGF7_FGFR2 | FGF | Lung | AIS |
| FGF7 | FGFR2 | FGF7_FGFR2 | FGF | Lung | IAC |
| FGF7 | FGFR2 | FGF7_FGFR2 | FGF | Lung | Precancer |
| Page: 1 |
Top |
Single-cell gene regulatory network inference analysis |
| Find out the significant the regulons (TFs) and the target genes of each regulon across cell types for different disease states |
| TF | Cell Type | Tissue | Disease Stage | Target Gene | RSS | Regulon Activity |
| ∗The dot plots of a searched regulon are shown for all cell subpopulations in each disease state of each tissue based on the regulon specific score inferred using pySCENIC and by calculating the average expression. |
| Page: 1 |
Top |
Somatic mutation of malignant transformation related genes |
| Annotation of somatic variants for genes involved in malignant transformation |
| Hugo Symbol | Variant Class | Variant Classification | dbSNP RS | HGVSc | HGVSp | HGVSp Short | SWISSPROT | BIOTYPE | SIFT | PolyPhen | Tumor Sample Barcode | Tissue | Histology | Sex | Age | Stage | Therapy Types | Drugs | Outcome |
| FGFR2 | SNV | Missense_Mutation | rs779423644 | c.364G>A | p.Val122Met | p.V122M | P21802 | protein_coding | deleterious(0.01) | possibly_damaging(0.902) | TCGA-3C-AALJ-01 | Breast | breast invasive carcinoma | Female | <65 | I/II | Chemotherapy | doxorubicin | SD |
| FGFR2 | SNV | Missense_Mutation | c.338N>C | p.Val113Ala | p.V113A | P21802 | protein_coding | tolerated(0.52) | benign(0.1) | TCGA-A8-A09D-01 | Breast | breast invasive carcinoma | Female | <65 | I/II | Chemotherapy | doxorubicin | CR | |
| FGFR2 | SNV | Missense_Mutation | c.1763N>G | p.Ser588Cys | p.S588C | P21802 | protein_coding | tolerated(0.31) | possibly_damaging(0.857) | TCGA-A8-A09X-01 | Breast | breast invasive carcinoma | Female | <65 | III/IV | Unknown | Unknown | SD | |
| FGFR2 | SNV | Missense_Mutation | c.785N>C | p.Leu262Pro | p.L262P | P21802 | protein_coding | deleterious(0.01) | probably_damaging(0.937) | TCGA-AN-A03X-01 | Breast | breast invasive carcinoma | Female | >=65 | I/II | Unknown | Unknown | SD | |
| FGFR2 | SNV | Missense_Mutation | novel | c.1904N>C | p.Val635Ala | p.V635A | P21802 | protein_coding | deleterious(0) | probably_damaging(0.997) | TCGA-AN-A046-01 | Breast | breast invasive carcinoma | Female | >=65 | I/II | Unknown | Unknown | SD |
| FGFR2 | SNV | Missense_Mutation | rs121913474 | c.1147T>C | p.Cys383Arg | p.C383R | P21802 | protein_coding | deleterious(0.02) | possibly_damaging(0.865) | TCGA-AN-A0AK-01 | Breast | breast invasive carcinoma | Female | >=65 | I/II | Unknown | Unknown | SD |
| FGFR2 | SNV | Missense_Mutation | c.1650T>G | p.Asn550Lys | p.N550K | P21802 | protein_coding | deleterious(0) | probably_damaging(1) | TCGA-AN-A0FL-01 | Breast | breast invasive carcinoma | Female | <65 | I/II | Unknown | Unknown | SD | |
| FGFR2 | SNV | Missense_Mutation | c.1099N>C | p.Glu367Gln | p.E367Q | P21802 | protein_coding | tolerated(0.19) | benign(0.156) | TCGA-D8-A1JA-01 | Breast | breast invasive carcinoma | Female | <65 | III/IV | Chemotherapy | adriamycin | PD | |
| FGFR2 | SNV | Missense_Mutation | rs121913476 | c.1650T>A | p.Asn550Lys | p.N550K | P21802 | protein_coding | deleterious(0) | probably_damaging(1) | TCGA-D8-A1XL-01 | Breast | breast invasive carcinoma | Female | <65 | I/II | Chemotherapy | doxorubicine+cyclophosphamide+tamoxifen | SD |
| FGFR2 | SNV | Missense_Mutation | c.1414G>T | p.Asp472Tyr | p.D472Y | P21802 | protein_coding | deleterious(0) | probably_damaging(1) | TCGA-E2-A14W-01 | Breast | breast invasive carcinoma | Male | >=65 | I/II | Chemotherapy | cytoxan | SD |
| Page: 1 2 3 4 5 6 7 8 9 10 11 12 13 14 15 16 17 18 |
Top |
Related drugs of malignant transformation related genes |
| Identification of chemicals and drugs interact with genes involved in malignant transfromation |
| (DGIdb 4.0) |
| Entrez ID | Symbol | Category | Interaction Types | Drug Claim Name | Drug Name | PMIDs |
| 2263 | FGFR2 | KINASE, DRUGGABLE GENOME, TYROSINE KINASE, CLINICALLY ACTIONABLE, CELL SURFACE | AZ6089 | 22869148 | ||
| 2263 | FGFR2 | KINASE, DRUGGABLE GENOME, TYROSINE KINASE, CLINICALLY ACTIONABLE, CELL SURFACE | CVBT-141H | |||
| 2263 | FGFR2 | KINASE, DRUGGABLE GENOME, TYROSINE KINASE, CLINICALLY ACTIONABLE, CELL SURFACE | inhibitor | BGJ398 | INFIGRATINIB | |
| 2263 | FGFR2 | KINASE, DRUGGABLE GENOME, TYROSINE KINASE, CLINICALLY ACTIONABLE, CELL SURFACE | DOVITINIB | DOVITINIB | ||
| 2263 | FGFR2 | KINASE, DRUGGABLE GENOME, TYROSINE KINASE, CLINICALLY ACTIONABLE, CELL SURFACE | inhibitor | 252827519 | ||
| 2263 | FGFR2 | KINASE, DRUGGABLE GENOME, TYROSINE KINASE, CLINICALLY ACTIONABLE, CELL SURFACE | TRAFERMIN | TRAFERMIN | ||
| 2263 | FGFR2 | KINASE, DRUGGABLE GENOME, TYROSINE KINASE, CLINICALLY ACTIONABLE, CELL SURFACE | inhibitor | NINTEDANIB | NINTEDANIB | |
| 2263 | FGFR2 | KINASE, DRUGGABLE GENOME, TYROSINE KINASE, CLINICALLY ACTIONABLE, CELL SURFACE | Trametinib | TRAMETINIB | 27338794 | |
| 2263 | FGFR2 | KINASE, DRUGGABLE GENOME, TYROSINE KINASE, CLINICALLY ACTIONABLE, CELL SURFACE | inhibitor | CHEMBL1852688 | INFIGRATINIB | |
| 2263 | FGFR2 | KINASE, DRUGGABLE GENOME, TYROSINE KINASE, CLINICALLY ACTIONABLE, CELL SURFACE | inhibitor | LENVATINIB | LENVATINIB |
| Page: 1 2 3 4 5 6 7 8 9 10 11 12 13 14 |

Copyright 2023-Present -The University of Texas Health Science Center at Houston |