
|
|||||
|
 | |
| |
| |
| |
| |
| |
|
Gene: FAM193A |
Gene summary for FAM193A |
| Gene information | Species | Human | Gene symbol | FAM193A | Gene ID | 8603 |
| Gene name | family with sequence similarity 193 member A | |
| Gene Alias | C4orf8 | |
| Cytomap | 4p16.3 | |
| Gene Type | protein-coding | GO ID | NA | UniProtAcc | P78312 |
Top |
Malignant transformation analysis |
| Identification of the aberrant gene expression in precancerous and cancerous lesions by comparing the gene expression of stem-like cells in diseased tissues with normal stem cells |
| Entrez ID | Symbol | Replicates | Species | Organ | Tissue | Adj P-value | Log2FC | Malignancy |
| 8603 | FAM193A | P107T-E | Human | Esophagus | ESCC | 1.81e-11 | 1.92e-01 | 0.171 |
| 8603 | FAM193A | P127T-E | Human | Esophagus | ESCC | 4.78e-07 | 6.02e-02 | 0.0826 |
| 8603 | FAM193A | P128T-E | Human | Esophagus | ESCC | 2.61e-09 | 2.77e-01 | 0.1241 |
| 8603 | FAM193A | P130T-E | Human | Esophagus | ESCC | 1.19e-24 | 2.56e-01 | 0.1676 |
| 8603 | FAM193A | RNA-P25T1-P25T1-1 | Human | Lung | AIS | 6.29e-06 | 4.21e-01 | -0.2116 |
| 8603 | FAM193A | RNA-P25T1-P25T1-4 | Human | Lung | AIS | 1.21e-04 | 4.56e-01 | -0.2119 |
| 8603 | FAM193A | RNA-P6T1-P6T1-2 | Human | Lung | MIAC | 3.44e-02 | 7.08e-01 | -0.0186 |
| 8603 | FAM193A | RNA-P6T1-P6T1-4 | Human | Lung | MIAC | 6.97e-04 | 6.72e-01 | -0.0263 |
| 8603 | FAM193A | RNA-P6T2-P6T2-1 | Human | Lung | IAC | 5.67e-12 | 4.90e-01 | -0.0166 |
| 8603 | FAM193A | RNA-P6T2-P6T2-2 | Human | Lung | IAC | 1.80e-12 | 5.10e-01 | -0.0132 |
| 8603 | FAM193A | RNA-P6T2-P6T2-3 | Human | Lung | IAC | 3.15e-15 | 5.10e-01 | -0.013 |
| 8603 | FAM193A | RNA-P6T2-P6T2-4 | Human | Lung | IAC | 3.79e-12 | 4.94e-01 | -0.0121 |
| 8603 | FAM193A | HTA12-23-1 | Human | Pancreas | PDAC | 1.26e-03 | 5.46e-01 | 0.3405 |
| 8603 | FAM193A | HTA12-25-1 | Human | Pancreas | PDAC | 3.84e-04 | 4.77e-01 | 0.313 |
| 8603 | FAM193A | HTA12-26-1 | Human | Pancreas | PDAC | 2.69e-11 | 5.64e-01 | 0.3728 |
| 8603 | FAM193A | HTA12-29-1 | Human | Pancreas | PDAC | 5.38e-23 | 5.78e-01 | 0.3722 |
| 8603 | FAM193A | male-WTA | Human | Thyroid | PTC | 2.37e-15 | 1.86e-01 | 0.1037 |
| 8603 | FAM193A | PTC01 | Human | Thyroid | PTC | 1.80e-03 | 9.18e-02 | 0.1899 |
| 8603 | FAM193A | PTC03 | Human | Thyroid | PTC | 2.51e-04 | 1.75e-01 | 0.1784 |
| 8603 | FAM193A | PTC04 | Human | Thyroid | PTC | 1.25e-13 | 2.47e-01 | 0.1927 |
| Page: 1 2 3 4 5 |
| Tissue | Expression Dynamics | Abbreviation |
| Endometrium |  | AEH: Atypical endometrial hyperplasia |
| EEC: Endometrioid Cancer | ||
| Esophagus | 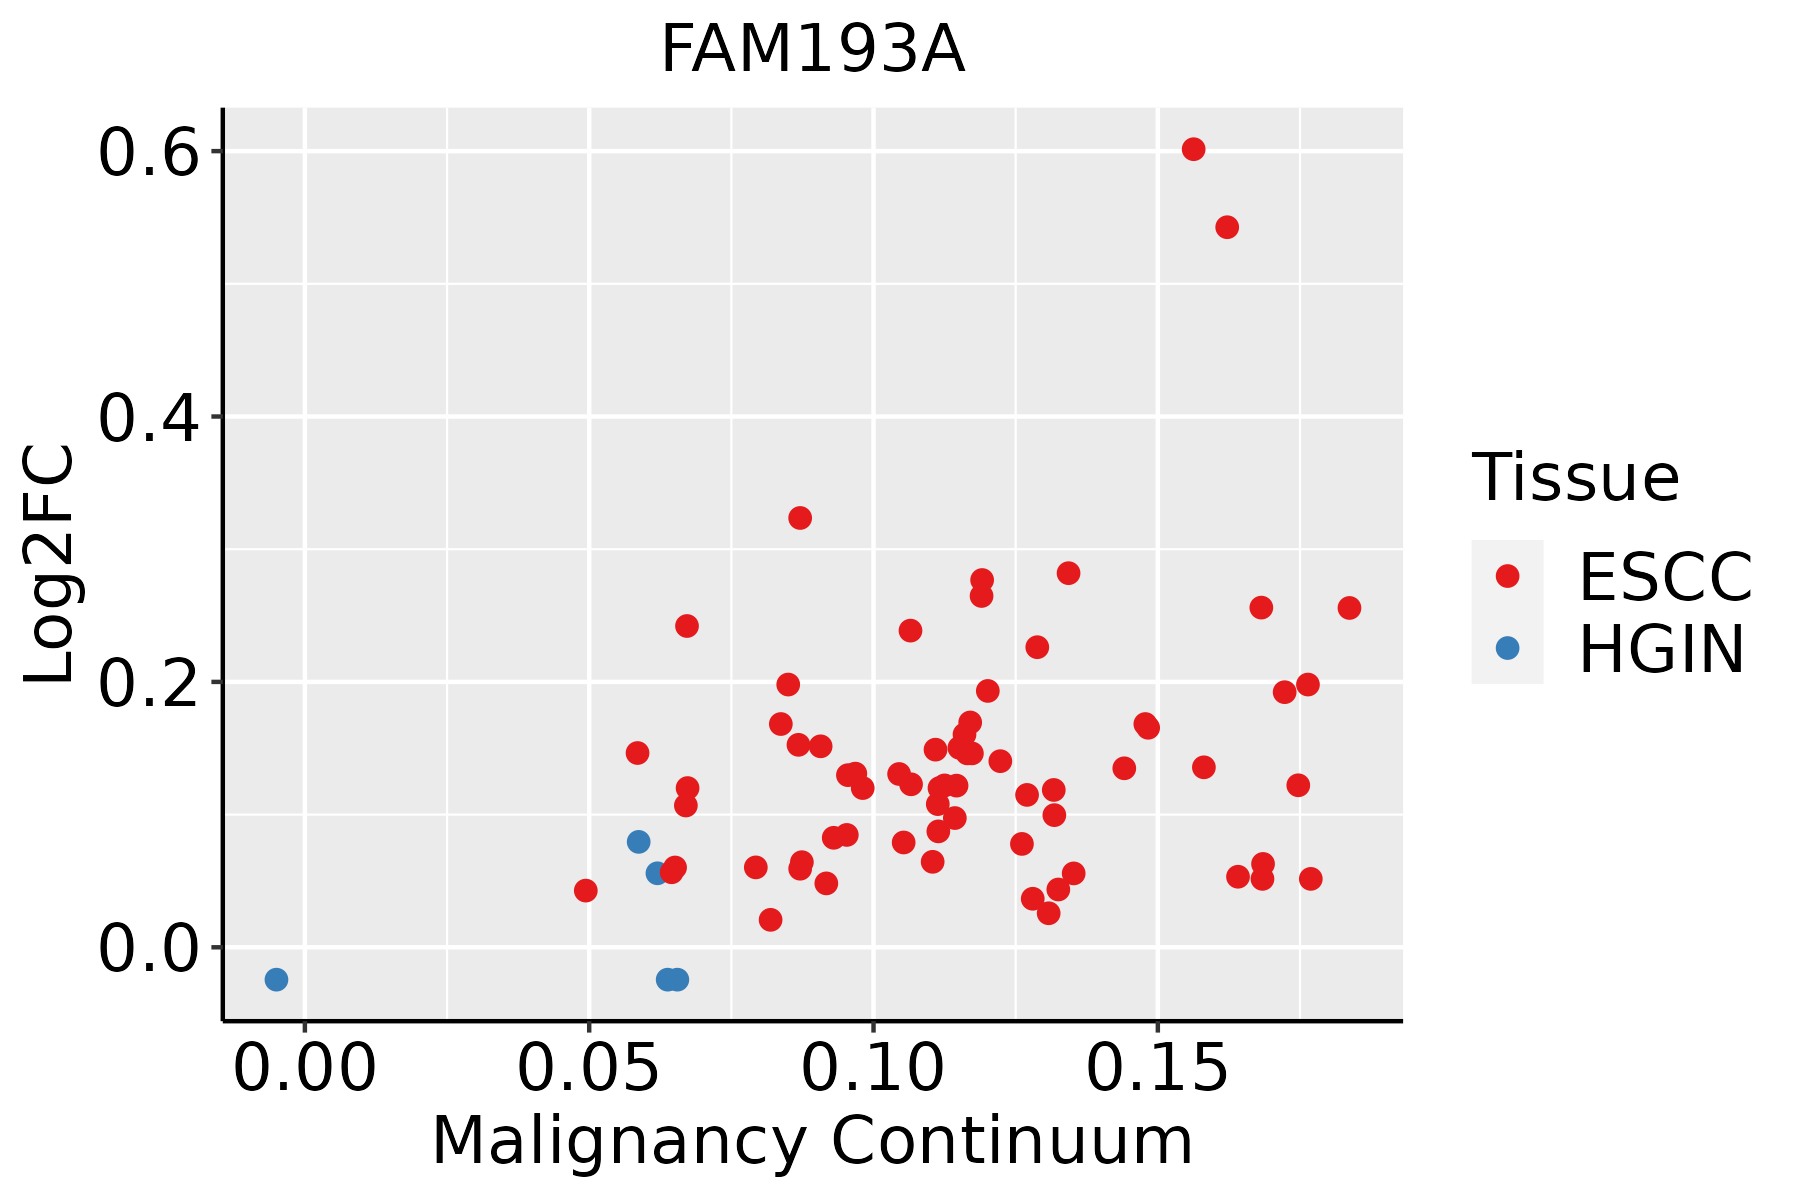 | ESCC: Esophageal squamous cell carcinoma |
| HGIN: High-grade intraepithelial neoplasias | ||
| LGIN: Low-grade intraepithelial neoplasias | ||
| Lung | 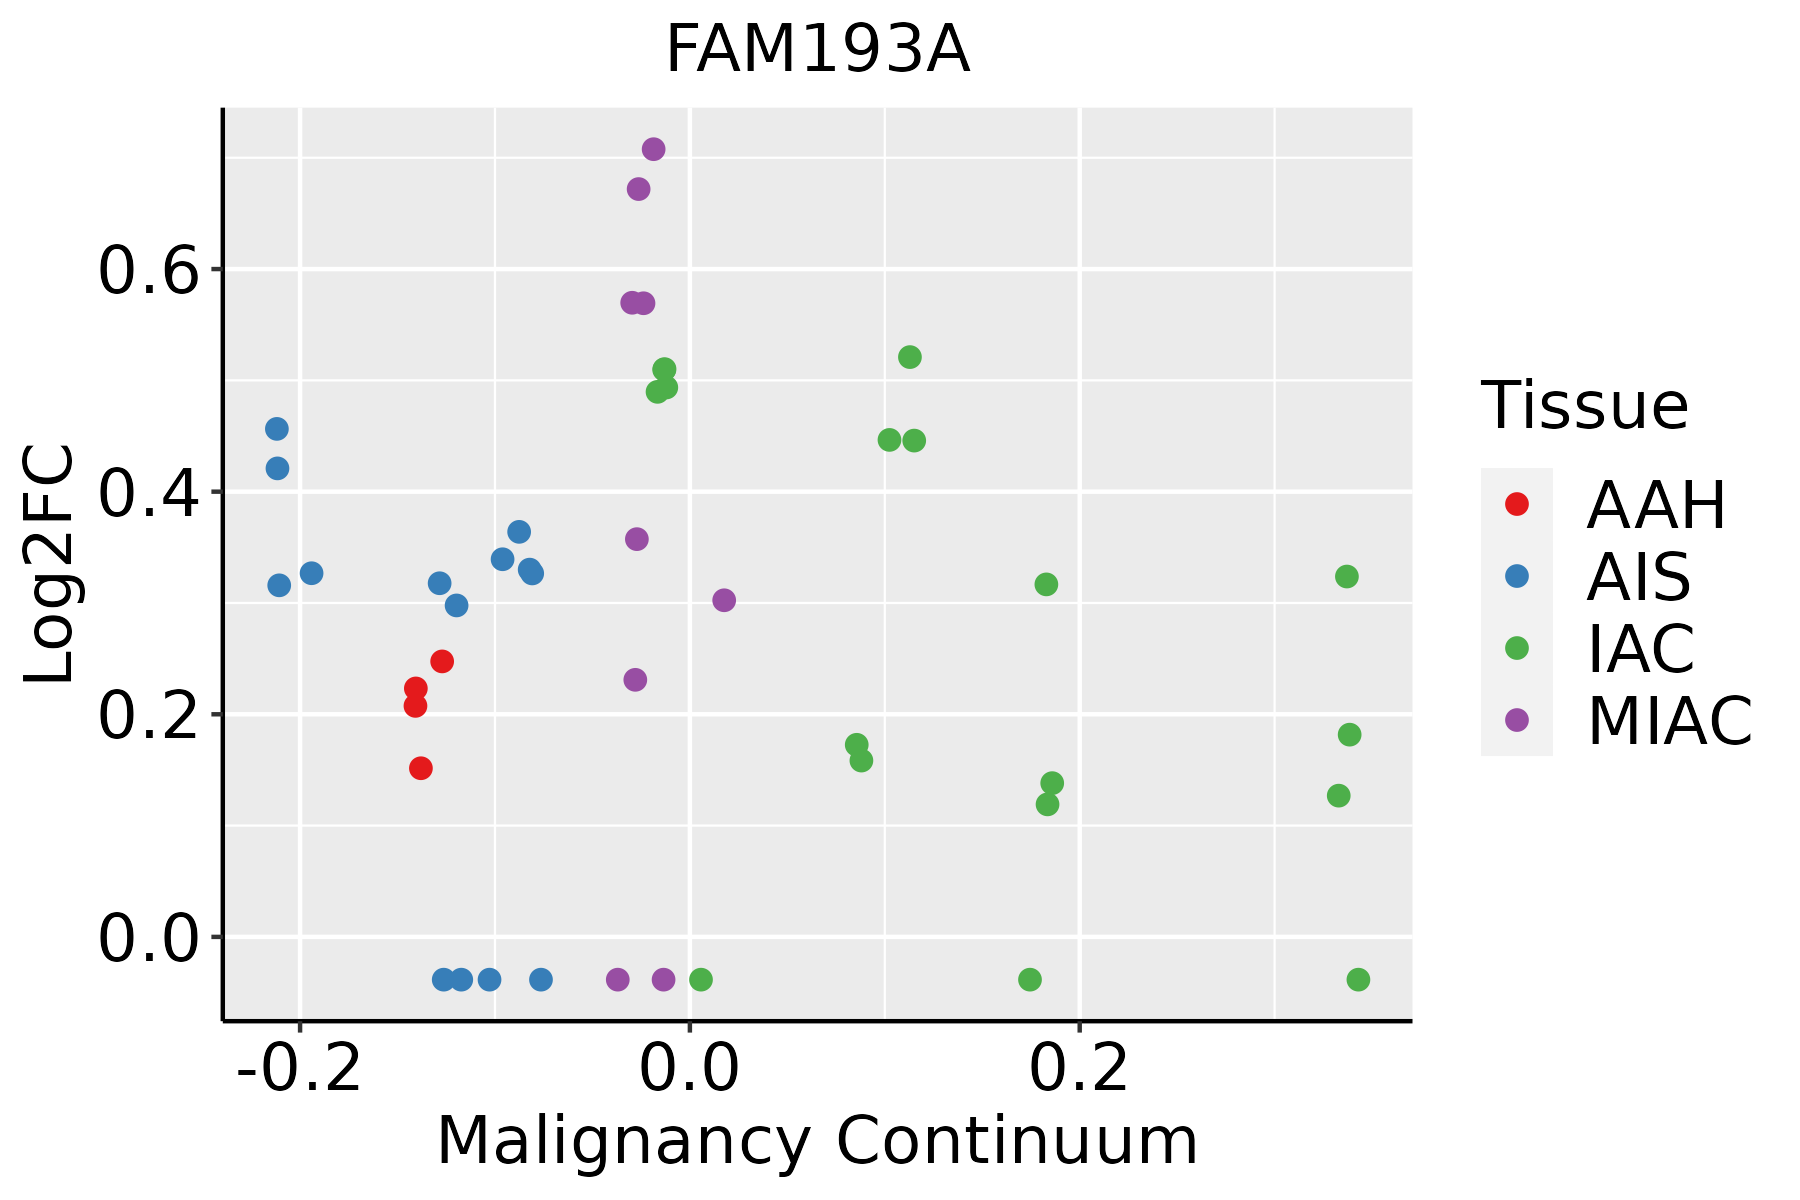 | AAH: Atypical adenomatous hyperplasia |
| AIS: Adenocarcinoma in situ | ||
| IAC: Invasive lung adenocarcinoma | ||
| MIA: Minimally invasive adenocarcinoma | ||
| Thyroid | 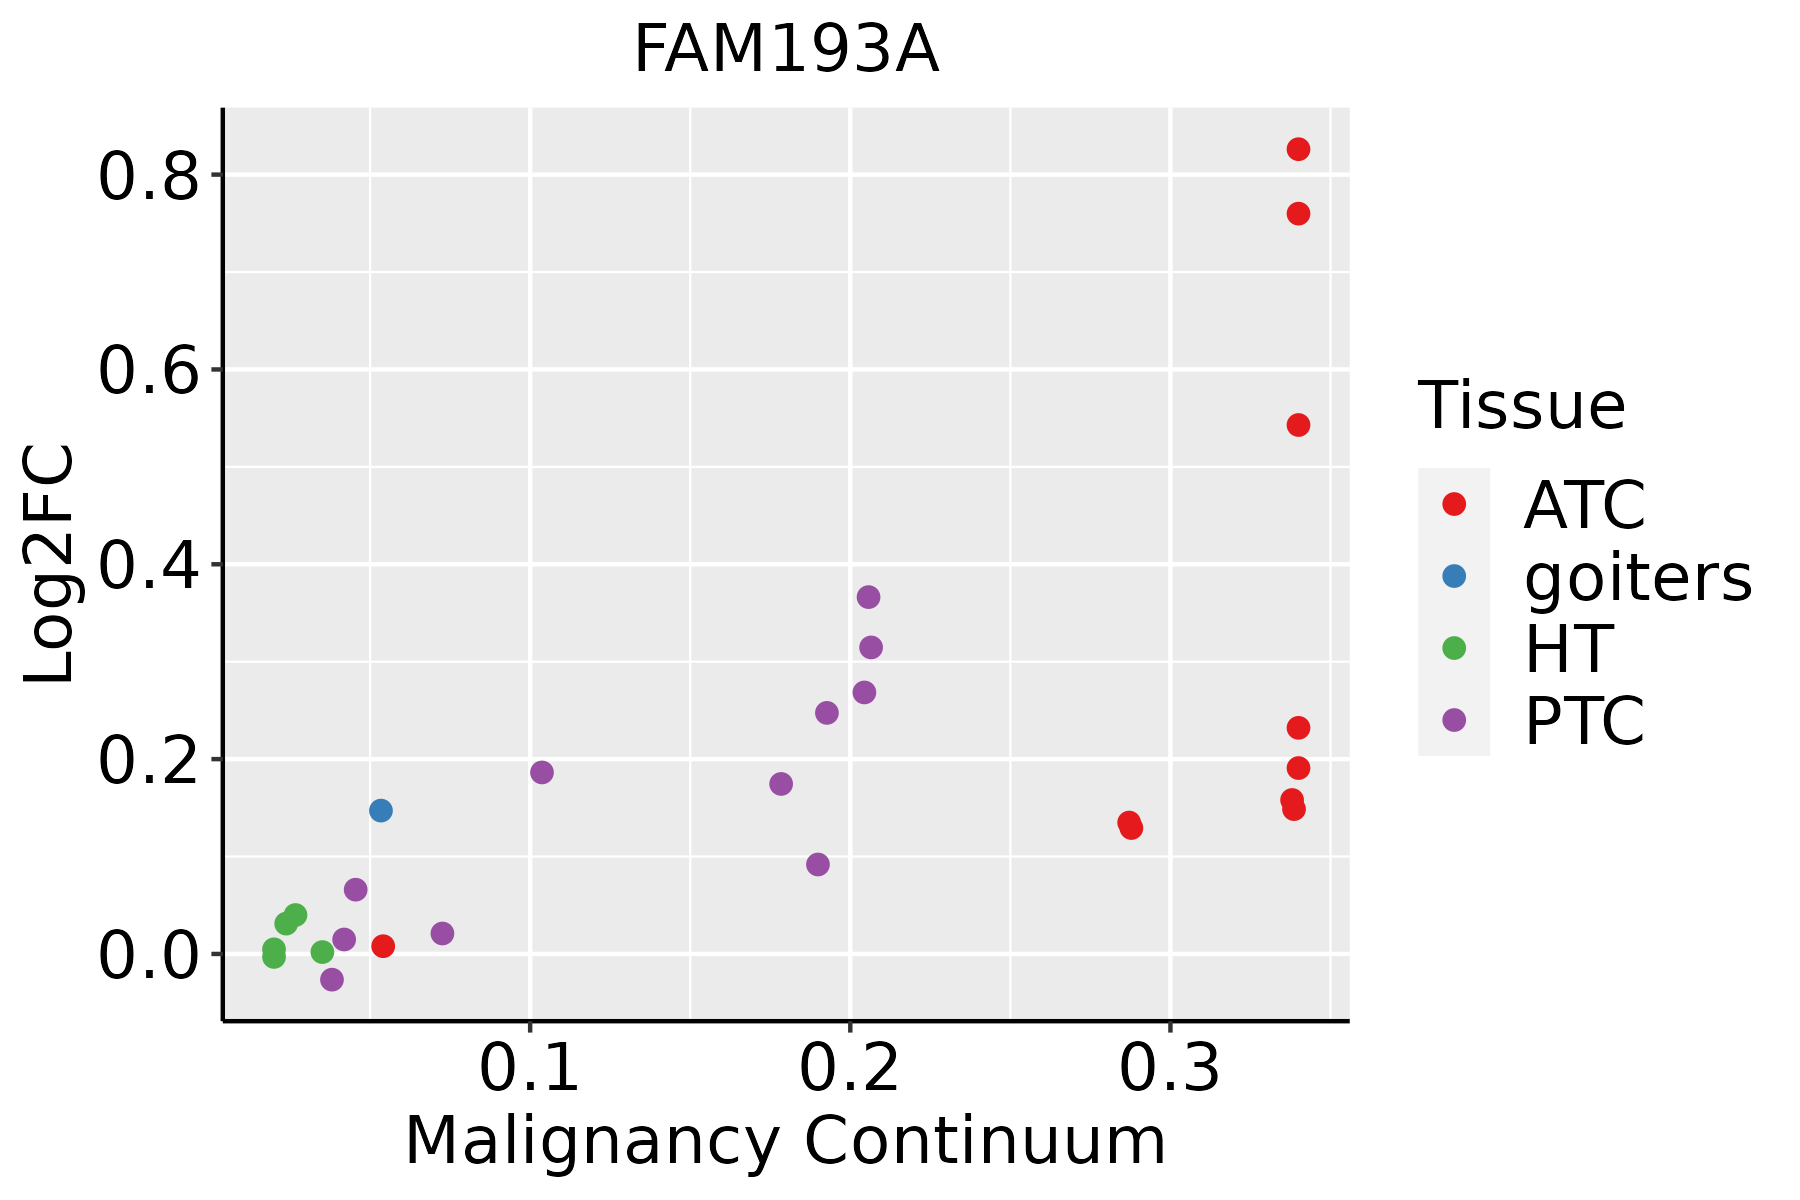 | ATC: Anaplastic thyroid cancer |
| HT: Hashimoto's thyroiditis | ||
| PTC: Papillary thyroid cancer |
| ∗log2FC in expression of this searched gene in stem-like cells from each diseased tissue sample relative to stem-like cells in normal samples in each tissue plotted against the malignancy continuum. Samples are colored based on if they are from different disease stage. |
Top |
Malignant transformation related pathway analysis |
| Find out the enriched GO biological processes and KEGG pathways involved in transition from healthy to precancer to cancer |
| Tissue | Disease Stage | Enriched GO biological Processes |
| Colorectum | AD |  |
| Colorectum | SER |  |
| Colorectum | MSS |  |
| Colorectum | MSI-H |  |
| Colorectum | FAP |  |
| ∗Top 15 enriched GO BP terms are showed in the bar plot of each disease state in each tissue. Each row represents a significant GO biological process which is colored according to the -log10(p.adjust). |
| Page: 1 2 3 4 5 6 7 8 9 |
| GO ID | Tissue | Disease Stage | Description | Gene Ratio | Bg Ratio | pvalue | p.adjust | Count |
| Page: 1 |
| Pathway ID | Tissue | Disease Stage | Description | Gene Ratio | Bg Ratio | pvalue | p.adjust | qvalue | Count |
| Page: 1 |
Top |
Cell-cell communication analysis |
| Identification of potential cell-cell interactions between two cell types and their ligand-receptor pairs for different disease states |
| Ligand | Receptor | LRpair | Pathway | Tissue | Disease Stage |
| Page: 1 |
Top |
Single-cell gene regulatory network inference analysis |
| Find out the significant the regulons (TFs) and the target genes of each regulon across cell types for different disease states |
| TF | Cell Type | Tissue | Disease Stage | Target Gene | RSS | Regulon Activity |
| ∗The dot plots of a searched regulon are shown for all cell subpopulations in each disease state of each tissue based on the regulon specific score inferred using pySCENIC and by calculating the average expression. |
| Page: 1 |
Top |
Somatic mutation of malignant transformation related genes |
| Annotation of somatic variants for genes involved in malignant transformation |
| Hugo Symbol | Variant Class | Variant Classification | dbSNP RS | HGVSc | HGVSp | HGVSp Short | SWISSPROT | BIOTYPE | SIFT | PolyPhen | Tumor Sample Barcode | Tissue | Histology | Sex | Age | Stage | Therapy Types | Drugs | Outcome |
| FAM193A | SNV | Missense_Mutation | rs746576848 | c.422N>C | p.His141Pro | p.H141P | protein_coding | deleterious(0.05) | benign(0.007) | TCGA-5L-AAT0-01 | Breast | breast invasive carcinoma | Female | <65 | I/II | Hormone Therapy | tamoxiphen | SD | |
| FAM193A | SNV | Missense_Mutation | c.3704N>C | p.Arg1235Thr | p.R1235T | P78312 | protein_coding | deleterious(0) | probably_damaging(0.998) | TCGA-A2-A0T4-01 | Breast | breast invasive carcinoma | Female | <65 | I/II | Hormone Therapy | femara | SD | |
| FAM193A | SNV | Missense_Mutation | novel | c.208N>T | p.His70Tyr | p.H70Y | P78312 | protein_coding | tolerated(0.05) | probably_damaging(0.997) | TCGA-A8-A09E-01 | Breast | breast invasive carcinoma | Female | >=65 | III/IV | Hormone Therapy | anastrozole | SD |
| FAM193A | SNV | Missense_Mutation | novel | c.2383G>A | p.Glu795Lys | p.E795K | P78312 | protein_coding | deleterious(0) | probably_damaging(0.997) | TCGA-AN-A046-01 | Breast | breast invasive carcinoma | Female | >=65 | I/II | Unknown | Unknown | SD |
| FAM193A | SNV | Missense_Mutation | novel | c.2600N>A | p.Arg867His | p.R867H | P78312 | protein_coding | deleterious(0) | probably_damaging(0.973) | TCGA-AO-A12D-01 | Breast | breast invasive carcinoma | Female | <65 | I/II | Chemotherapy | cyclophosphamide | SD |
| FAM193A | SNV | Missense_Mutation | c.1566G>C | p.Trp522Cys | p.W522C | P78312 | protein_coding | deleterious(0) | probably_damaging(0.998) | TCGA-AR-A250-01 | Breast | breast invasive carcinoma | Female | <65 | I/II | Chemotherapy | doxorubicin | SD | |
| FAM193A | SNV | Missense_Mutation | c.2162N>T | p.Pro721Leu | p.P721L | P78312 | protein_coding | tolerated(0.15) | benign(0.051) | TCGA-BH-A0GZ-01 | Breast | breast invasive carcinoma | Female | <65 | I/II | Hormone Therapy | arimidex | SD | |
| FAM193A | SNV | Missense_Mutation | rs145959580 | c.29C>T | p.Ser10Leu | p.S10L | P78312 | protein_coding | deleterious(0) | probably_damaging(0.992) | TCGA-BH-A1F8-01 | Breast | breast invasive carcinoma | Female | >=65 | III/IV | Unknown | Unknown | PD |
| FAM193A | SNV | Missense_Mutation | c.3754N>C | p.Trp1252Arg | p.W1252R | P78312 | protein_coding | deleterious(0) | possibly_damaging(0.481) | TCGA-D8-A1XK-01 | Breast | breast invasive carcinoma | Female | <65 | I/II | Chemotherapy | doxorubicine+cyclophosphamide | SD | |
| FAM193A | SNV | Missense_Mutation | novel | c.3004N>A | p.Asp1002Asn | p.D1002N | P78312 | protein_coding | tolerated(0.31) | benign(0) | TCGA-D8-A27V-01 | Breast | breast invasive carcinoma | Female | <65 | I/II | Hormone Therapy | tamoxiphen | SD |
| Page: 1 2 3 4 5 6 7 8 9 10 11 12 13 14 |
Top |
Related drugs of malignant transformation related genes |
| Identification of chemicals and drugs interact with genes involved in malignant transfromation |
| (DGIdb 4.0) |
| Entrez ID | Symbol | Category | Interaction Types | Drug Claim Name | Drug Name | PMIDs |
| Page: 1 |

Copyright 2023-Present -The University of Texas Health Science Center at Houston |