
|
|||||
|
 | |
| |
| |
| |
| |
| |
|
Gene: FAM135A |
Gene summary for FAM135A |
| Gene information | Species | Human | Gene symbol | FAM135A | Gene ID | 57579 |
| Gene name | family with sequence similarity 135 member A | |
| Gene Alias | KIAA1411 | |
| Cytomap | 6q13 | |
| Gene Type | protein-coding | GO ID | GO:0006629 | UniProtAcc | Q9P2D6 |
Top |
Malignant transformation analysis |
| Identification of the aberrant gene expression in precancerous and cancerous lesions by comparing the gene expression of stem-like cells in diseased tissues with normal stem cells |
| Entrez ID | Symbol | Replicates | Species | Organ | Tissue | Adj P-value | Log2FC | Malignancy |
| 57579 | FAM135A | LZE21T | Human | Esophagus | ESCC | 2.70e-04 | 5.83e-01 | 0.0655 |
| 57579 | FAM135A | P1T-E | Human | Esophagus | ESCC | 1.41e-05 | 2.74e-01 | 0.0875 |
| 57579 | FAM135A | P2T-E | Human | Esophagus | ESCC | 6.00e-14 | 1.82e-01 | 0.1177 |
| 57579 | FAM135A | P4T-E | Human | Esophagus | ESCC | 4.62e-16 | 3.99e-01 | 0.1323 |
| 57579 | FAM135A | P5T-E | Human | Esophagus | ESCC | 1.76e-20 | 4.59e-01 | 0.1327 |
| 57579 | FAM135A | P8T-E | Human | Esophagus | ESCC | 1.35e-13 | 2.72e-01 | 0.0889 |
| 57579 | FAM135A | P9T-E | Human | Esophagus | ESCC | 4.24e-10 | 2.21e-01 | 0.1131 |
| 57579 | FAM135A | P10T-E | Human | Esophagus | ESCC | 1.55e-09 | 1.46e-01 | 0.116 |
| 57579 | FAM135A | P11T-E | Human | Esophagus | ESCC | 5.03e-11 | 4.64e-01 | 0.1426 |
| 57579 | FAM135A | P12T-E | Human | Esophagus | ESCC | 1.30e-34 | 6.58e-01 | 0.1122 |
| 57579 | FAM135A | P15T-E | Human | Esophagus | ESCC | 3.67e-17 | 3.71e-01 | 0.1149 |
| 57579 | FAM135A | P16T-E | Human | Esophagus | ESCC | 3.21e-21 | 2.89e-01 | 0.1153 |
| 57579 | FAM135A | P17T-E | Human | Esophagus | ESCC | 3.11e-02 | 1.19e-01 | 0.1278 |
| 57579 | FAM135A | P19T-E | Human | Esophagus | ESCC | 1.73e-03 | 2.44e-01 | 0.1662 |
| 57579 | FAM135A | P20T-E | Human | Esophagus | ESCC | 3.09e-18 | 4.09e-01 | 0.1124 |
| 57579 | FAM135A | P21T-E | Human | Esophagus | ESCC | 1.46e-09 | 2.29e-01 | 0.1617 |
| 57579 | FAM135A | P22T-E | Human | Esophagus | ESCC | 6.72e-07 | 1.71e-01 | 0.1236 |
| 57579 | FAM135A | P23T-E | Human | Esophagus | ESCC | 2.63e-21 | 6.19e-01 | 0.108 |
| 57579 | FAM135A | P24T-E | Human | Esophagus | ESCC | 1.18e-04 | 1.37e-01 | 0.1287 |
| 57579 | FAM135A | P26T-E | Human | Esophagus | ESCC | 6.29e-74 | 1.38e+00 | 0.1276 |
| Page: 1 2 3 4 5 6 7 8 |
| Tissue | Expression Dynamics | Abbreviation |
| Cervix | 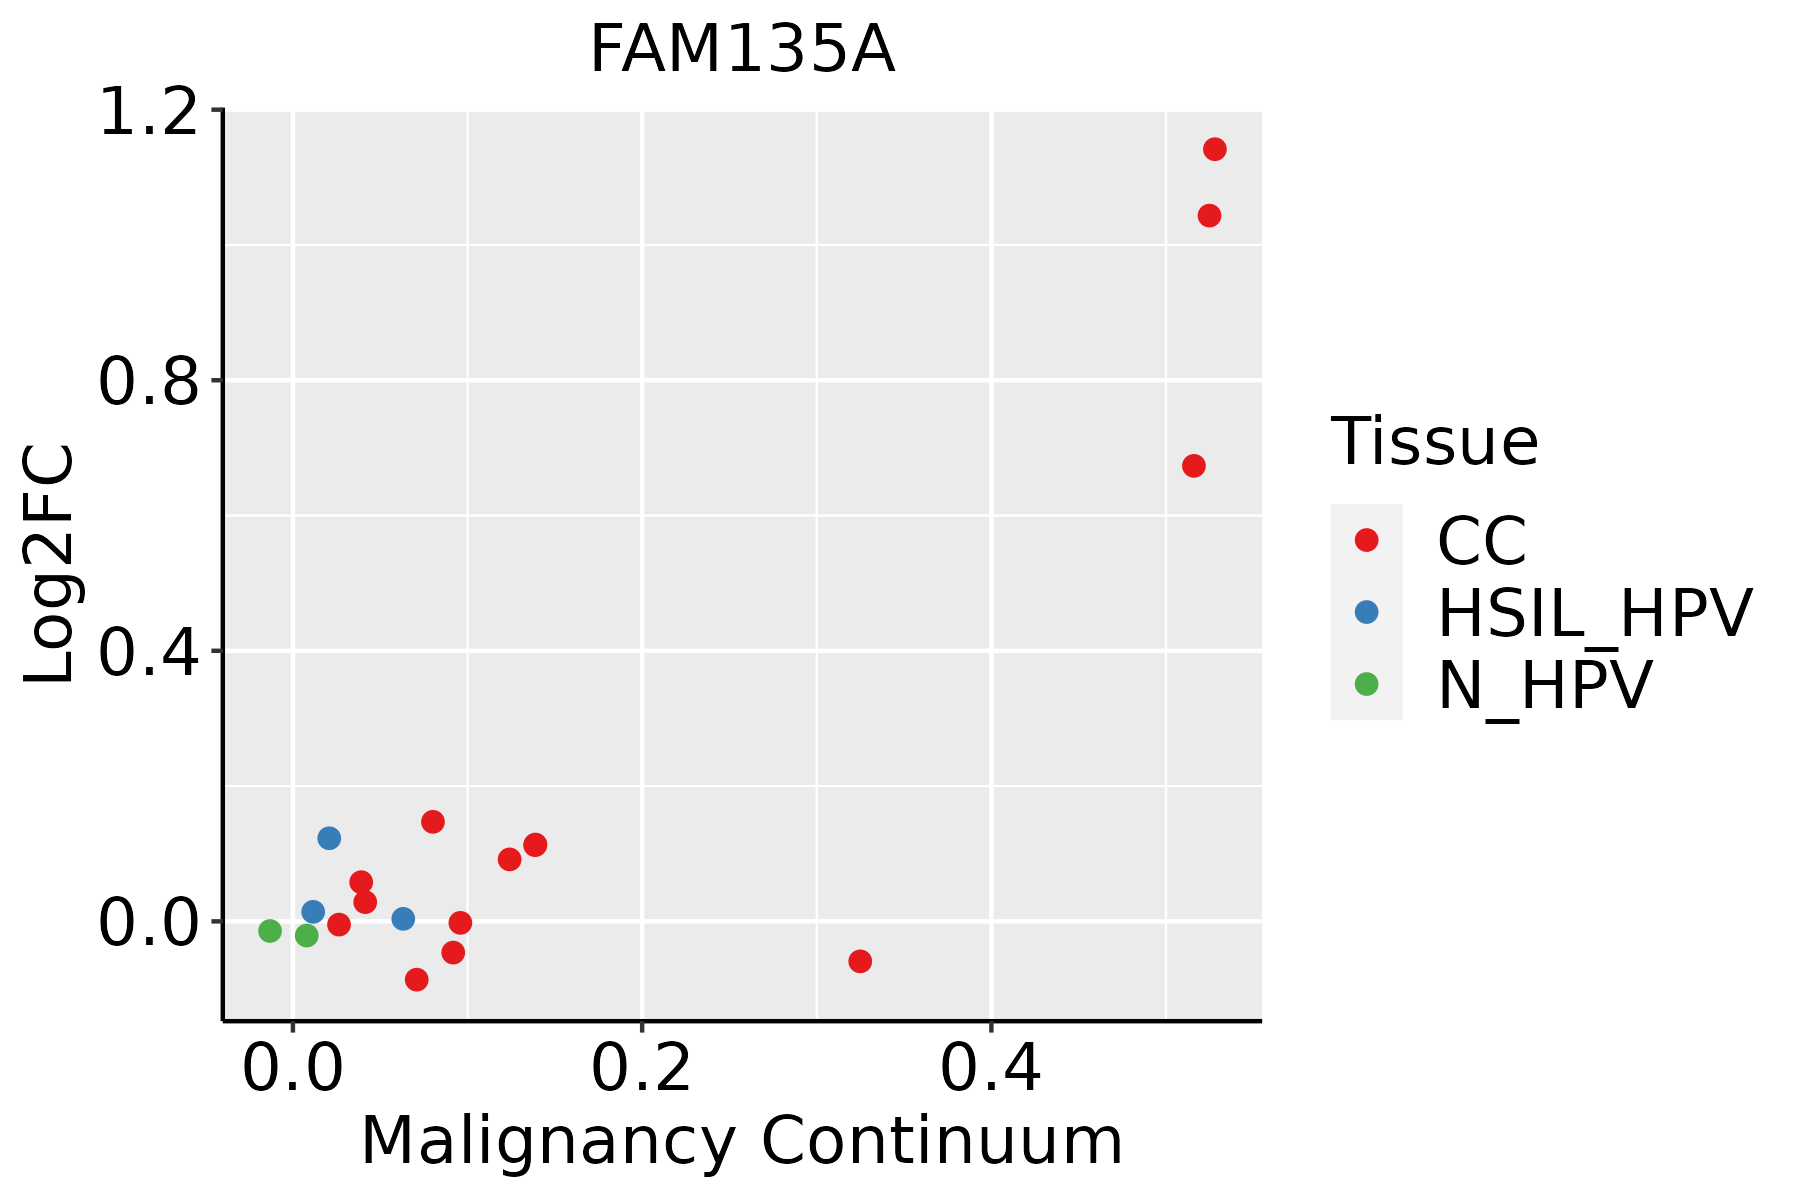 | CC: Cervix cancer |
| HSIL_HPV: HPV-infected high-grade squamous intraepithelial lesions | ||
| N_HPV: HPV-infected normal cervix | ||
| Colorectum (GSE201348) |  | FAP: Familial adenomatous polyposis |
| CRC: Colorectal cancer | ||
| Colorectum (HTA11) |  | AD: Adenomas |
| SER: Sessile serrated lesions | ||
| MSI-H: Microsatellite-high colorectal cancer | ||
| MSS: Microsatellite stable colorectal cancer | ||
| Esophagus | 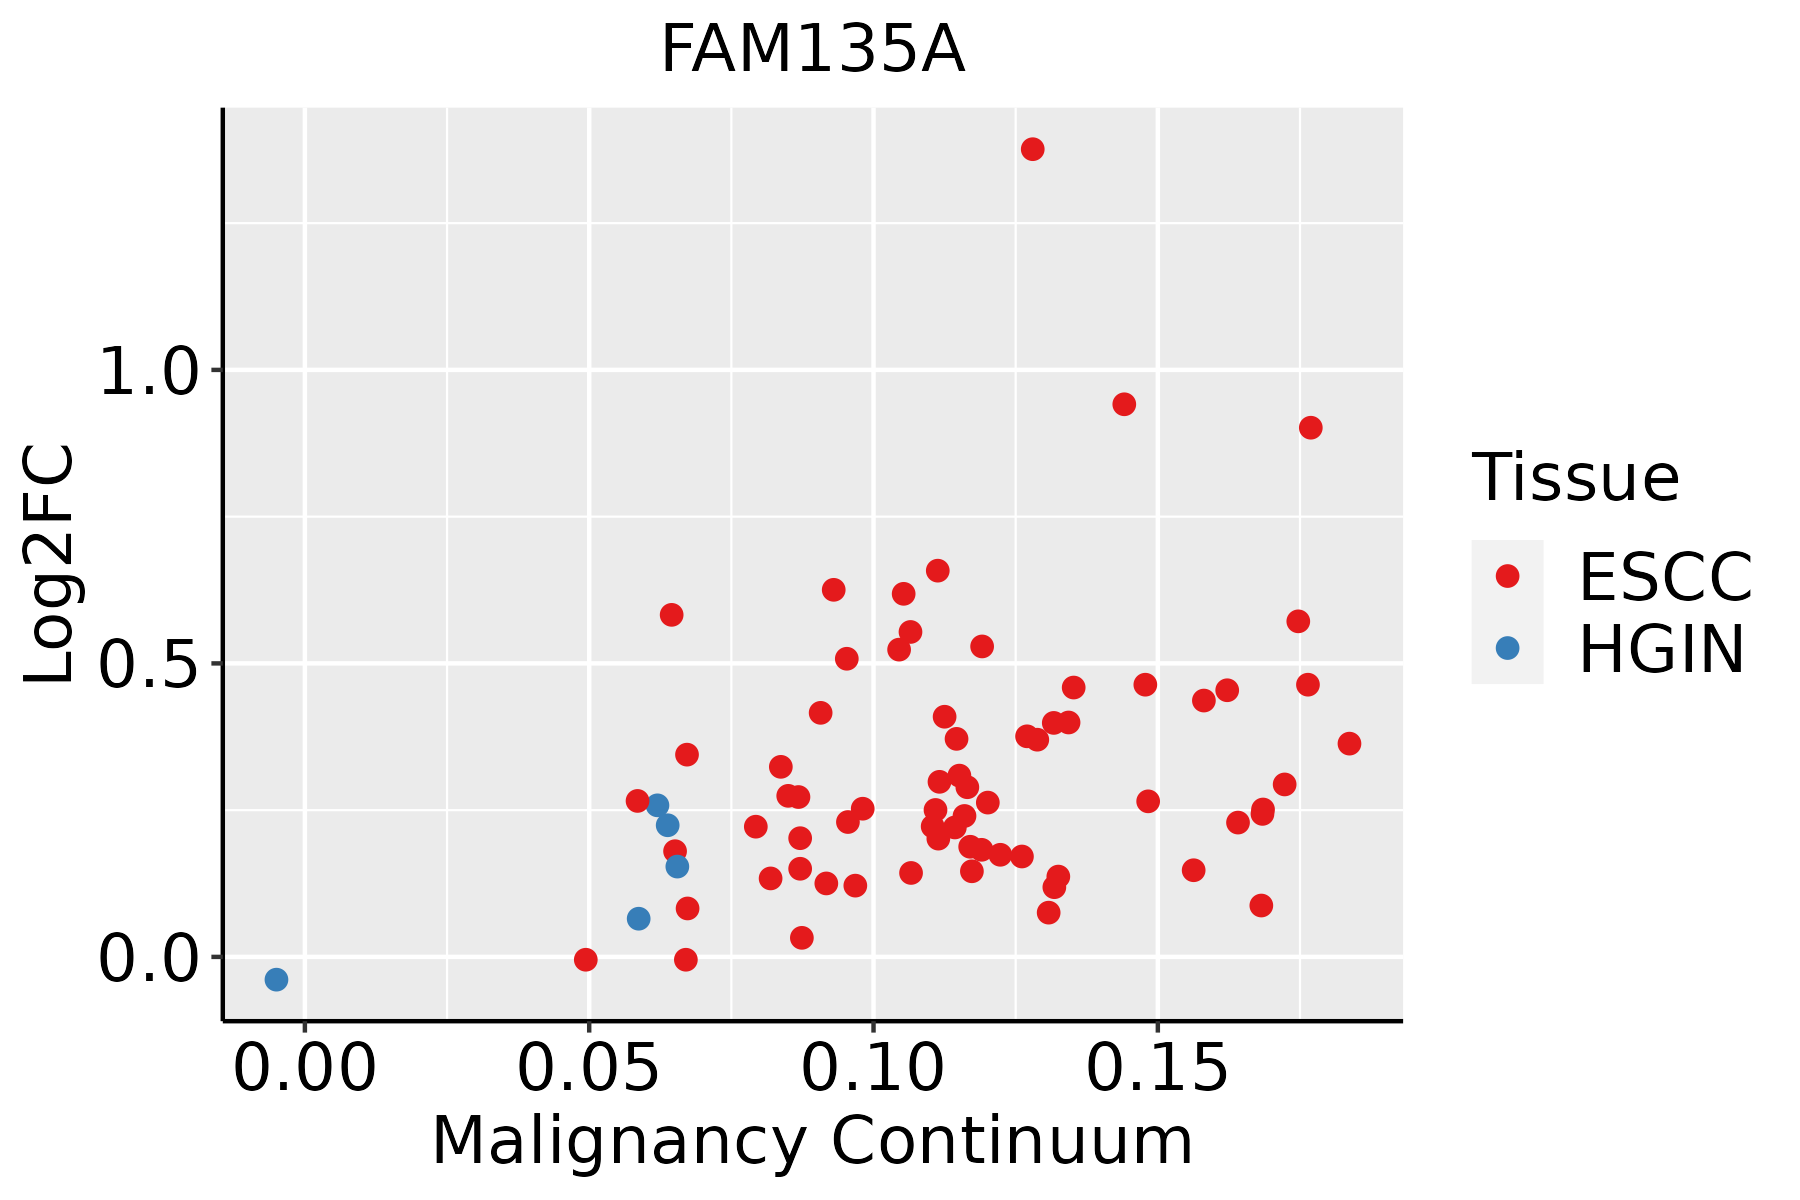 | ESCC: Esophageal squamous cell carcinoma |
| HGIN: High-grade intraepithelial neoplasias | ||
| LGIN: Low-grade intraepithelial neoplasias | ||
| GC |  | CAG: Chronic atrophic gastritis |
| CAG with IM: Chronic atrophic gastritis with intestinal metaplasia | ||
| CSG: Chronic superficial gastritis | ||
| GC: Gastric cancer | ||
| SIM: Severe intestinal metaplasia | ||
| WIM: Wild intestinal metaplasia | ||
| Lung |  | AAH: Atypical adenomatous hyperplasia |
| AIS: Adenocarcinoma in situ | ||
| IAC: Invasive lung adenocarcinoma | ||
| MIA: Minimally invasive adenocarcinoma | ||
| Prostate | 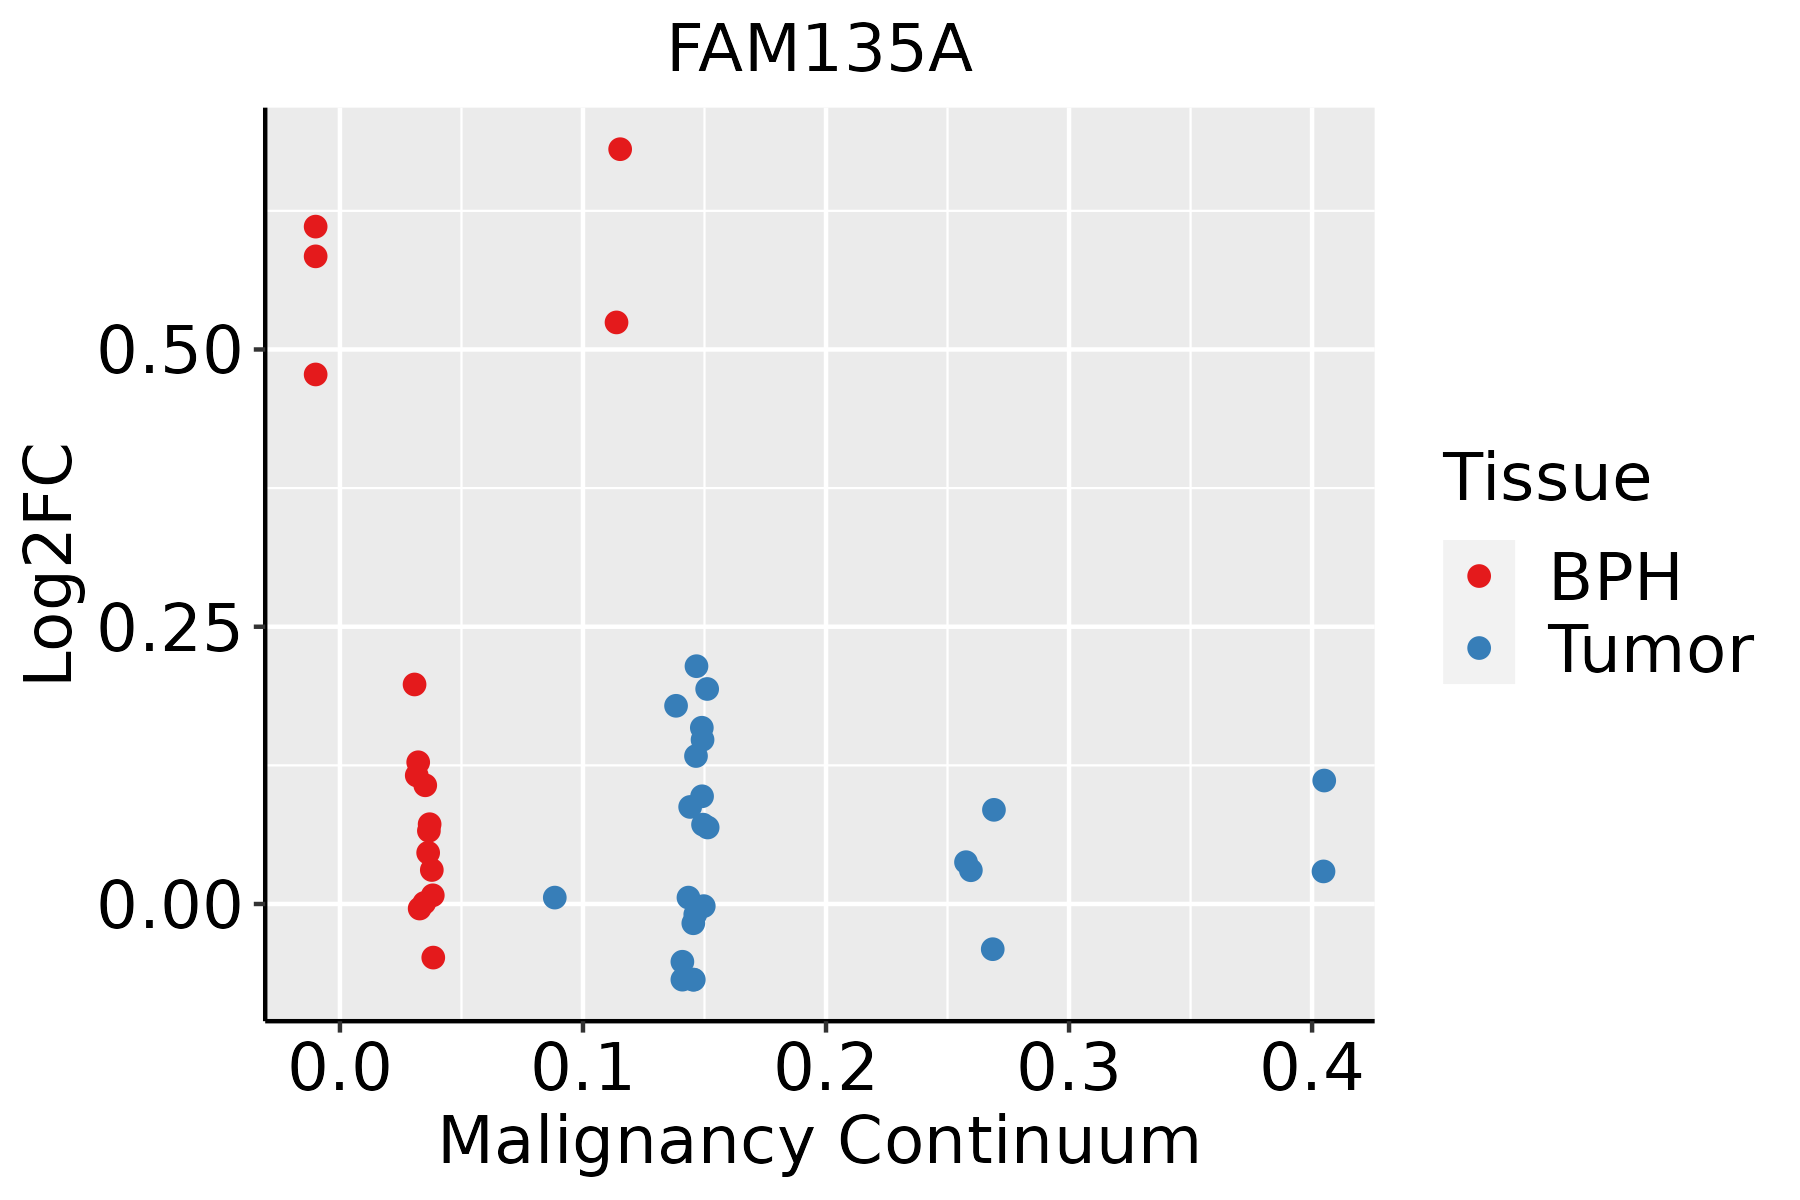 | BPH: Benign Prostatic Hyperplasia |
| ∗log2FC in expression of this searched gene in stem-like cells from each diseased tissue sample relative to stem-like cells in normal samples in each tissue plotted against the malignancy continuum. Samples are colored based on if they are from different disease stage. |
Top |
Malignant transformation related pathway analysis |
| Find out the enriched GO biological processes and KEGG pathways involved in transition from healthy to precancer to cancer |
| Tissue | Disease Stage | Enriched GO biological Processes |
| Colorectum | AD |  |
| Colorectum | SER |  |
| Colorectum | MSS |  |
| Colorectum | MSI-H |  |
| Colorectum | FAP |  |
| ∗Top 15 enriched GO BP terms are showed in the bar plot of each disease state in each tissue. Each row represents a significant GO biological process which is colored according to the -log10(p.adjust). |
| Page: 1 2 3 4 5 6 7 8 9 |
| GO ID | Tissue | Disease Stage | Description | Gene Ratio | Bg Ratio | pvalue | p.adjust | Count |
| Page: 1 |
| Pathway ID | Tissue | Disease Stage | Description | Gene Ratio | Bg Ratio | pvalue | p.adjust | qvalue | Count |
| Page: 1 |
Top |
Cell-cell communication analysis |
| Identification of potential cell-cell interactions between two cell types and their ligand-receptor pairs for different disease states |
| Ligand | Receptor | LRpair | Pathway | Tissue | Disease Stage |
| Page: 1 |
Top |
Single-cell gene regulatory network inference analysis |
| Find out the significant the regulons (TFs) and the target genes of each regulon across cell types for different disease states |
| TF | Cell Type | Tissue | Disease Stage | Target Gene | RSS | Regulon Activity |
| ∗The dot plots of a searched regulon are shown for all cell subpopulations in each disease state of each tissue based on the regulon specific score inferred using pySCENIC and by calculating the average expression. |
| Page: 1 |
Top |
Somatic mutation of malignant transformation related genes |
| Annotation of somatic variants for genes involved in malignant transformation |
| Hugo Symbol | Variant Class | Variant Classification | dbSNP RS | HGVSc | HGVSp | HGVSp Short | SWISSPROT | BIOTYPE | SIFT | PolyPhen | Tumor Sample Barcode | Tissue | Histology | Sex | Age | Stage | Therapy Types | Drugs | Outcome |
| FAM135A | SNV | Missense_Mutation | c.2260N>G | p.Lys754Glu | p.K754E | Q9P2D6 | protein_coding | tolerated(0.06) | benign(0.164) | TCGA-AN-A0AK-01 | Breast | breast invasive carcinoma | Female | >=65 | I/II | Unknown | Unknown | SD | |
| FAM135A | SNV | Missense_Mutation | c.3889G>C | p.Asp1297His | p.D1297H | Q9P2D6 | protein_coding | deleterious(0) | probably_damaging(0.998) | TCGA-BH-A0H5-01 | Breast | breast invasive carcinoma | Female | <65 | I/II | Chemotherapy | cytoxan | CR | |
| FAM135A | SNV | Missense_Mutation | rs757683614 | c.1525N>A | p.Leu509Ile | p.L509I | Q9P2D6 | protein_coding | tolerated(0.28) | benign(0.003) | TCGA-BH-A18G-01 | Breast | breast invasive carcinoma | Female | >=65 | I/II | Unknown | Unknown | SD |
| FAM135A | SNV | Missense_Mutation | c.868N>C | p.Val290Leu | p.V290L | Q9P2D6 | protein_coding | tolerated(0.58) | benign(0.051) | TCGA-D8-A13Z-01 | Breast | breast invasive carcinoma | Female | <65 | I/II | Chemotherapy | doxorubicine | SD | |
| FAM135A | SNV | Missense_Mutation | rs762402721 | c.3130G>T | p.Gly1044Cys | p.G1044C | Q9P2D6 | protein_coding | deleterious(0) | probably_damaging(1) | TCGA-D8-A147-01 | Breast | breast invasive carcinoma | Female | <65 | I/II | Chemotherapy | doxorubicine | SD |
| FAM135A | SNV | Missense_Mutation | c.4022G>C | p.Arg1341Thr | p.R1341T | Q9P2D6 | protein_coding | deleterious(0) | probably_damaging(0.999) | TCGA-GI-A2C9-01 | Breast | breast invasive carcinoma | Female | <65 | I/II | Unspecific | SD | ||
| FAM135A | SNV | Missense_Mutation | novel | c.1148N>T | p.Ser383Phe | p.S383F | Q9P2D6 | protein_coding | deleterious(0) | probably_damaging(0.994) | TCGA-XX-A899-01 | Breast | breast invasive carcinoma | Female | <65 | III/IV | Chemotherapy | cytoxan | CR |
| FAM135A | insertion | Frame_Shift_Ins | novel | c.749_750insAGCCTTCAAGGGATTGCTATGTTGCTCAGGCTGGTATCAAACTCTTGGCCTCAAGCAATCCTCCAGGCTA | p.His256LeufsTer53 | p.H256Lfs*53 | Q9P2D6 | protein_coding | TCGA-AO-A128-01 | Breast | breast invasive carcinoma | Female | <65 | I/II | Chemotherapy | doxorubicin | SD | ||
| FAM135A | deletion | Frame_Shift_Del | novel | c.3503_3506delATTC | p.Tyr1168PhefsTer45 | p.Y1168Ffs*45 | Q9P2D6 | protein_coding | TCGA-B6-A3ZX-01 | Breast | breast invasive carcinoma | Female | <65 | III/IV | Chemotherapy | cyclophosphamide | PD | ||
| FAM135A | SNV | Missense_Mutation | rs868795794 | c.2339C>T | p.Ala780Val | p.A780V | Q9P2D6 | protein_coding | deleterious(0) | possibly_damaging(0.836) | TCGA-2W-A8YY-01 | Cervix | cervical & endocervical cancer | Female | <65 | I/II | Chemotherapy | cisplatin | CR |
| Page: 1 2 3 4 5 6 7 8 9 10 11 12 13 14 15 16 17 |
Top |
Related drugs of malignant transformation related genes |
| Identification of chemicals and drugs interact with genes involved in malignant transfromation |
| (DGIdb 4.0) |
| Entrez ID | Symbol | Category | Interaction Types | Drug Claim Name | Drug Name | PMIDs |
| Page: 1 |

Copyright 2023-Present -The University of Texas Health Science Center at Houston |