
|
|||||
|
 | |
| |
| |
| |
| |
| |
|
Gene: FAM120B |
Gene summary for FAM120B |
| Gene information | Species | Human | Gene symbol | FAM120B | Gene ID | 84498 |
| Gene name | family with sequence similarity 120B | |
| Gene Alias | CCPG | |
| Cytomap | 6q27 | |
| Gene Type | protein-coding | GO ID | GO:0007154 | UniProtAcc | A0A0D9SEJ5 |
Top |
Malignant transformation analysis |
| Identification of the aberrant gene expression in precancerous and cancerous lesions by comparing the gene expression of stem-like cells in diseased tissues with normal stem cells |
| Entrez ID | Symbol | Replicates | Species | Organ | Tissue | Adj P-value | Log2FC | Malignancy |
| 84498 | FAM120B | P32T-E | Human | Esophagus | ESCC | 3.69e-12 | 1.60e-01 | 0.1666 |
| 84498 | FAM120B | P36T-E | Human | Esophagus | ESCC | 5.75e-18 | 3.21e-01 | 0.1187 |
| 84498 | FAM120B | P37T-E | Human | Esophagus | ESCC | 4.80e-06 | 3.23e-01 | 0.1371 |
| 84498 | FAM120B | P39T-E | Human | Esophagus | ESCC | 6.14e-15 | 2.84e-01 | 0.0894 |
| 84498 | FAM120B | P40T-E | Human | Esophagus | ESCC | 1.45e-09 | 2.10e-01 | 0.109 |
| 84498 | FAM120B | P42T-E | Human | Esophagus | ESCC | 3.94e-11 | 1.51e-01 | 0.1175 |
| 84498 | FAM120B | P44T-E | Human | Esophagus | ESCC | 4.95e-10 | 1.89e-01 | 0.1096 |
| 84498 | FAM120B | P47T-E | Human | Esophagus | ESCC | 3.16e-10 | 6.88e-02 | 0.1067 |
| 84498 | FAM120B | P48T-E | Human | Esophagus | ESCC | 3.90e-16 | 2.59e-01 | 0.0959 |
| 84498 | FAM120B | P52T-E | Human | Esophagus | ESCC | 5.21e-18 | 2.99e-01 | 0.1555 |
| 84498 | FAM120B | P54T-E | Human | Esophagus | ESCC | 1.20e-14 | 3.14e-01 | 0.0975 |
| 84498 | FAM120B | P56T-E | Human | Esophagus | ESCC | 1.72e-04 | 8.94e-01 | 0.1613 |
| 84498 | FAM120B | P57T-E | Human | Esophagus | ESCC | 5.43e-12 | 2.67e-01 | 0.0926 |
| 84498 | FAM120B | P61T-E | Human | Esophagus | ESCC | 4.78e-10 | 2.35e-01 | 0.099 |
| 84498 | FAM120B | P62T-E | Human | Esophagus | ESCC | 3.25e-12 | 2.69e-01 | 0.1302 |
| 84498 | FAM120B | P65T-E | Human | Esophagus | ESCC | 8.67e-12 | 2.08e-01 | 0.0978 |
| 84498 | FAM120B | P74T-E | Human | Esophagus | ESCC | 1.54e-13 | 2.71e-01 | 0.1479 |
| 84498 | FAM120B | P75T-E | Human | Esophagus | ESCC | 8.45e-13 | 1.18e-01 | 0.1125 |
| 84498 | FAM120B | P76T-E | Human | Esophagus | ESCC | 1.06e-10 | 1.33e-01 | 0.1207 |
| 84498 | FAM120B | P79T-E | Human | Esophagus | ESCC | 1.40e-12 | 1.65e-01 | 0.1154 |
| Page: 1 2 3 4 5 6 |
| Tissue | Expression Dynamics | Abbreviation |
| Colorectum (GSE201348) |  | FAP: Familial adenomatous polyposis |
| CRC: Colorectal cancer | ||
| Colorectum (HTA11) |  | AD: Adenomas |
| SER: Sessile serrated lesions | ||
| MSI-H: Microsatellite-high colorectal cancer | ||
| MSS: Microsatellite stable colorectal cancer | ||
| Esophagus | 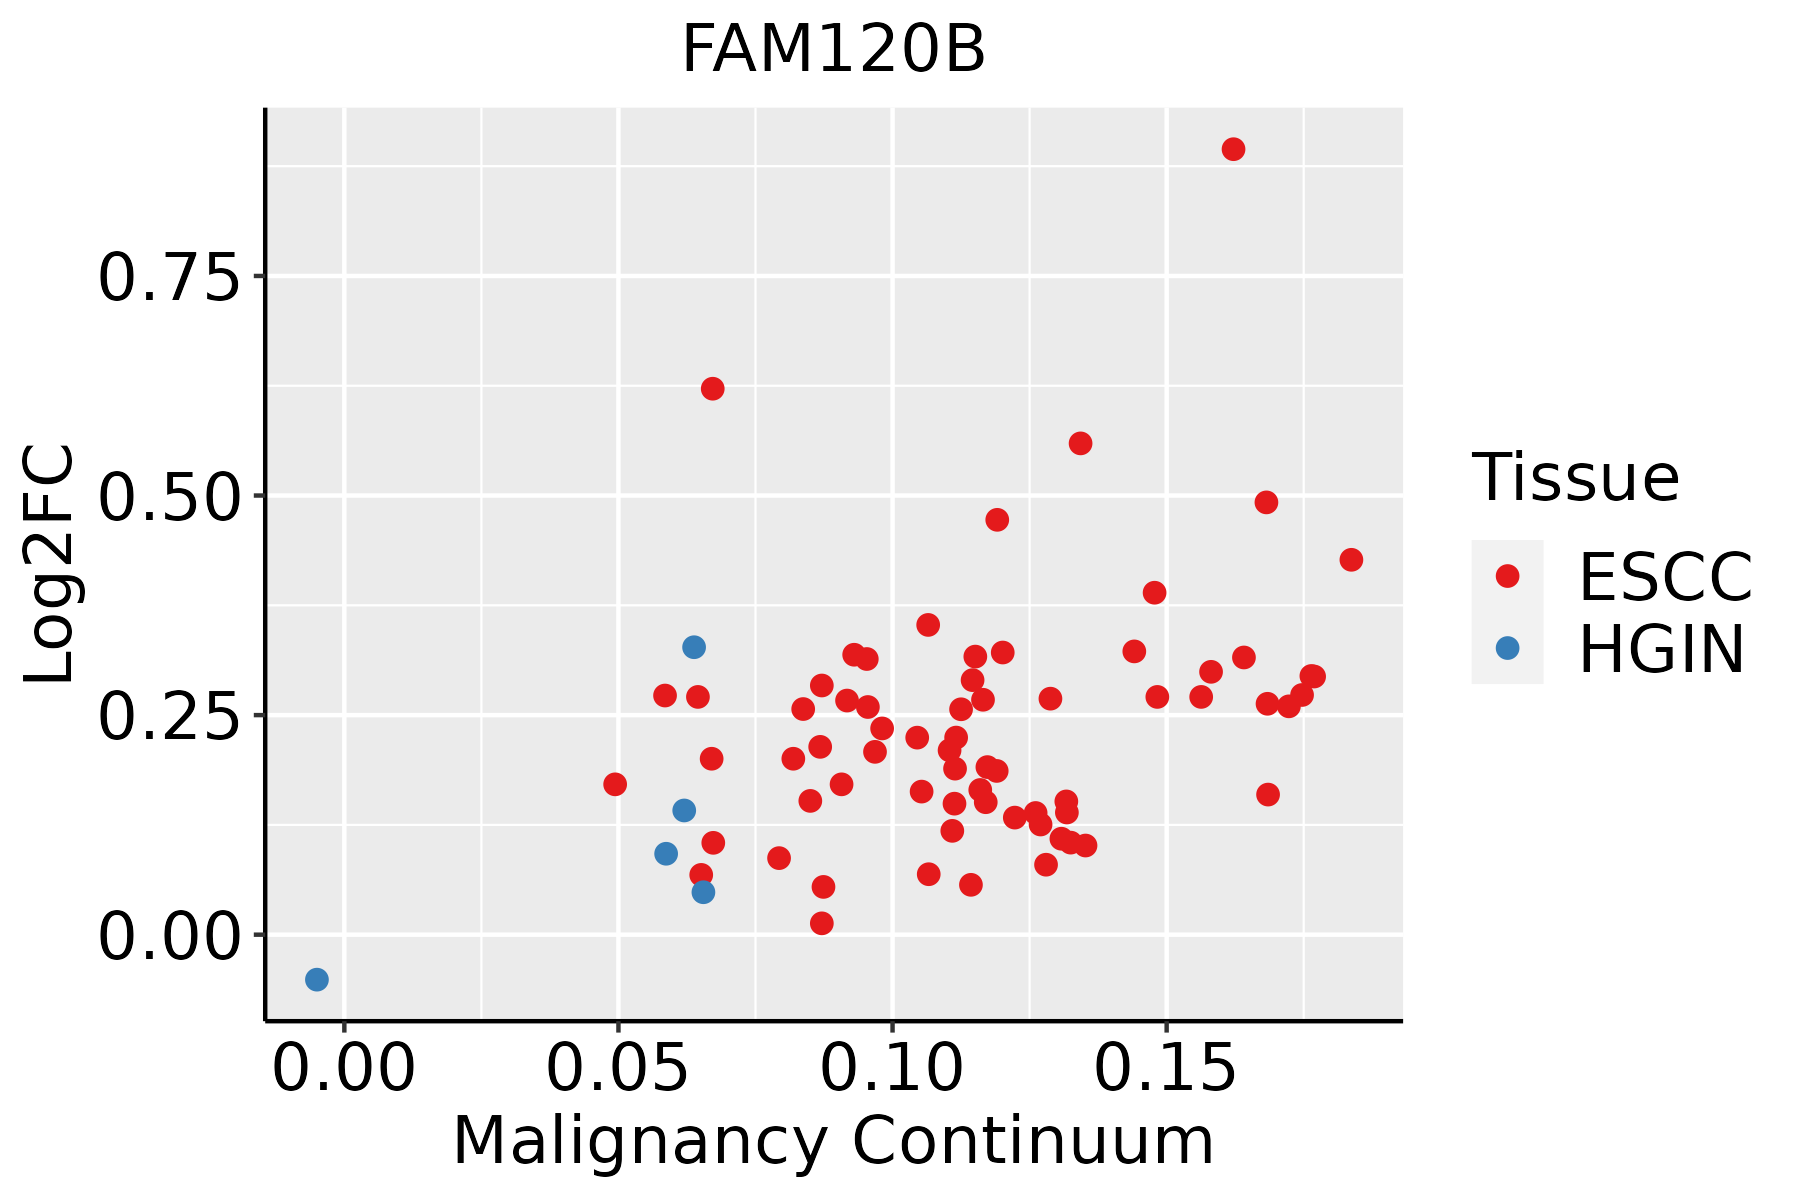 | ESCC: Esophageal squamous cell carcinoma |
| HGIN: High-grade intraepithelial neoplasias | ||
| LGIN: Low-grade intraepithelial neoplasias | ||
| Lung | 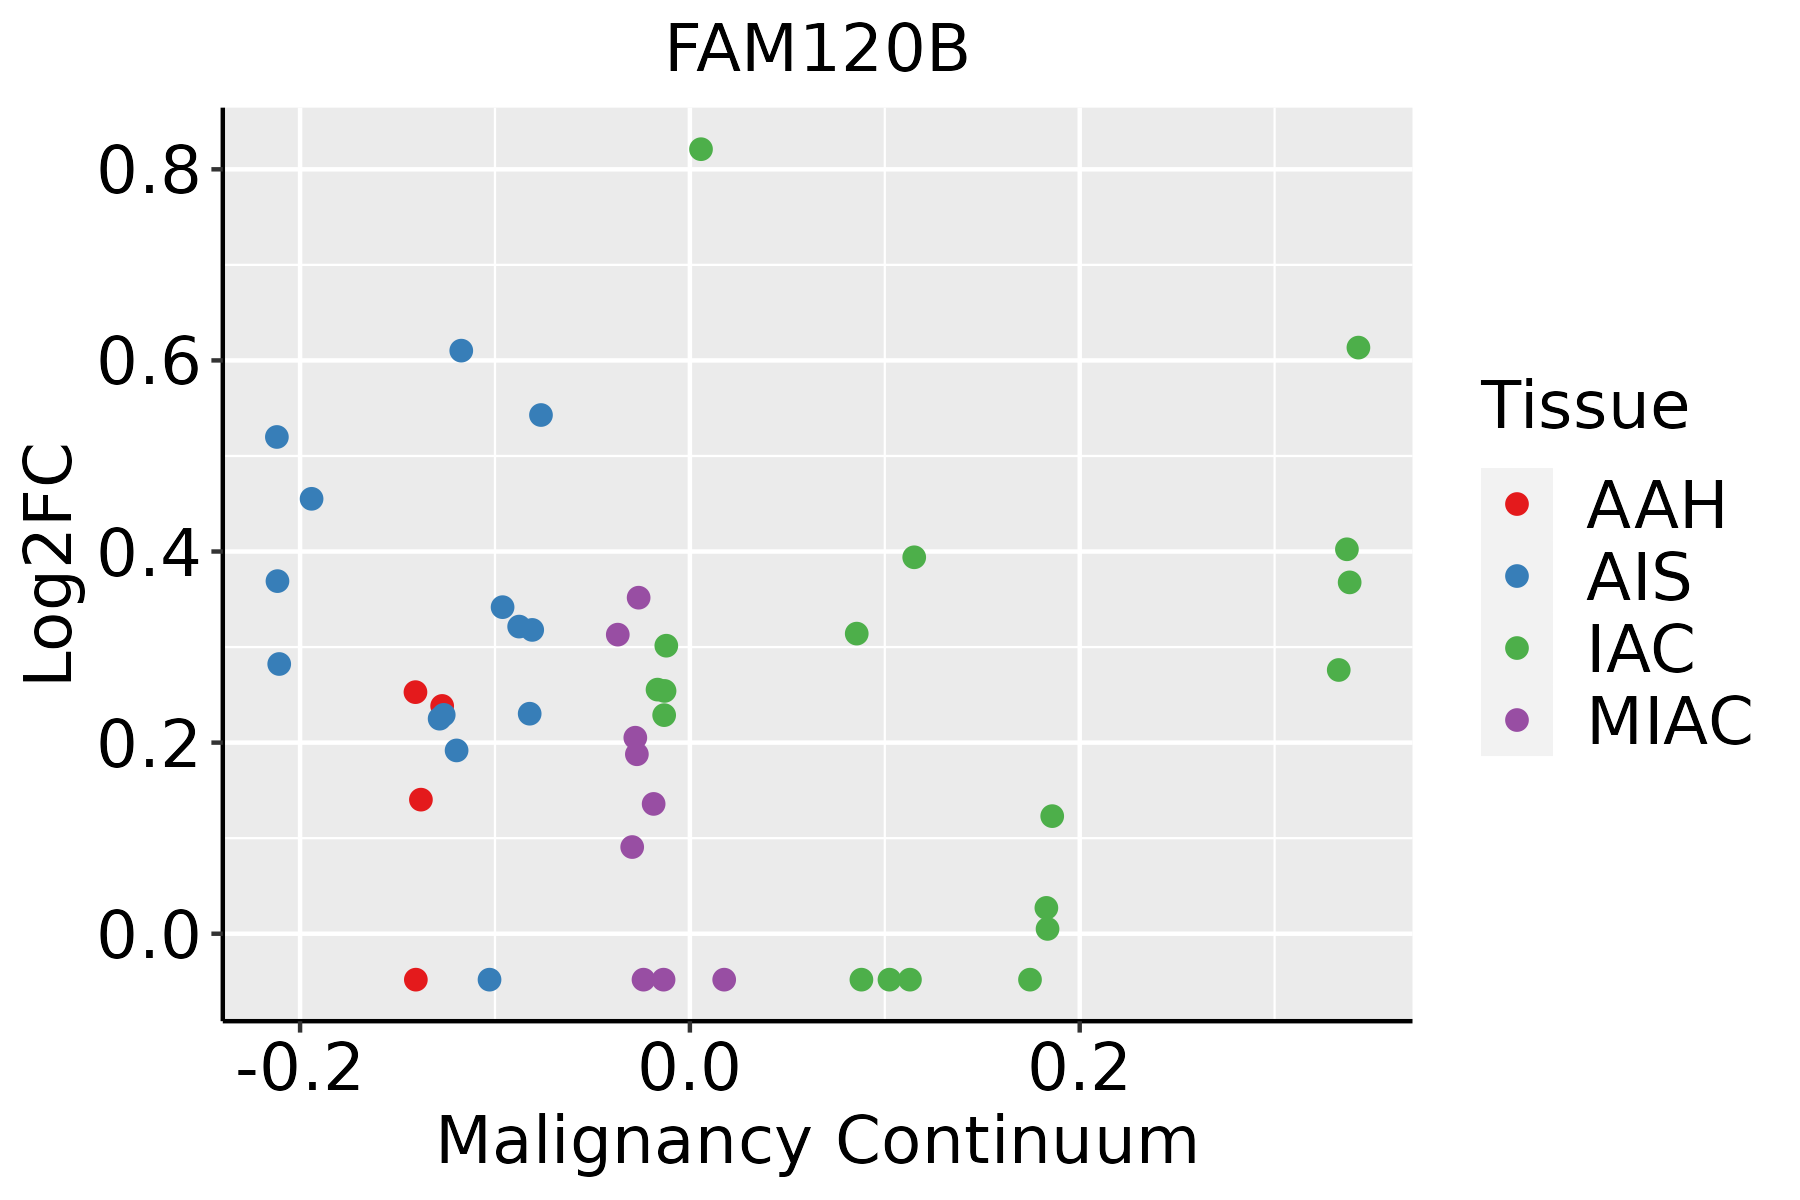 | AAH: Atypical adenomatous hyperplasia |
| AIS: Adenocarcinoma in situ | ||
| IAC: Invasive lung adenocarcinoma | ||
| MIA: Minimally invasive adenocarcinoma |
| ∗log2FC in expression of this searched gene in stem-like cells from each diseased tissue sample relative to stem-like cells in normal samples in each tissue plotted against the malignancy continuum. Samples are colored based on if they are from different disease stage. |
Top |
Malignant transformation related pathway analysis |
| Find out the enriched GO biological processes and KEGG pathways involved in transition from healthy to precancer to cancer |
| Tissue | Disease Stage | Enriched GO biological Processes |
| Colorectum | AD |  |
| Colorectum | SER |  |
| Colorectum | MSS |  |
| Colorectum | MSI-H |  |
| Colorectum | FAP |  |
| ∗Top 15 enriched GO BP terms are showed in the bar plot of each disease state in each tissue. Each row represents a significant GO biological process which is colored according to the -log10(p.adjust). |
| Page: 1 2 3 4 5 6 7 8 9 |
| GO ID | Tissue | Disease Stage | Description | Gene Ratio | Bg Ratio | pvalue | p.adjust | Count |
| GO:0030522 | Colorectum | AD | intracellular receptor signaling pathway | 87/3918 | 265/18723 | 3.69e-06 | 1.03e-04 | 87 |
| GO:00305222 | Colorectum | MSS | intracellular receptor signaling pathway | 84/3467 | 265/18723 | 1.47e-07 | 6.79e-06 | 84 |
| GO:00305223 | Colorectum | FAP | intracellular receptor signaling pathway | 67/2622 | 265/18723 | 6.84e-07 | 3.28e-05 | 67 |
| GO:00305224 | Colorectum | CRC | intracellular receptor signaling pathway | 61/2078 | 265/18723 | 2.00e-08 | 3.23e-06 | 61 |
| GO:0030522110 | Esophagus | ESCC | intracellular receptor signaling pathway | 170/8552 | 265/18723 | 8.58e-10 | 2.09e-08 | 170 |
| GO:00454449 | Esophagus | ESCC | fat cell differentiation | 135/8552 | 229/18723 | 3.38e-05 | 2.78e-04 | 135 |
| GO:00305227 | Lung | IAC | intracellular receptor signaling pathway | 59/2061 | 265/18723 | 8.88e-08 | 8.50e-06 | 59 |
| GO:00454443 | Lung | IAC | fat cell differentiation | 42/2061 | 229/18723 | 6.19e-04 | 8.50e-03 | 42 |
| GO:003052213 | Lung | AIS | intracellular receptor signaling pathway | 53/1849 | 265/18723 | 4.57e-07 | 3.55e-05 | 53 |
| GO:004544411 | Lung | AIS | fat cell differentiation | 37/1849 | 229/18723 | 1.88e-03 | 2.08e-02 | 37 |
| Page: 1 |
| Pathway ID | Tissue | Disease Stage | Description | Gene Ratio | Bg Ratio | pvalue | p.adjust | qvalue | Count |
| Page: 1 |
Top |
Cell-cell communication analysis |
| Identification of potential cell-cell interactions between two cell types and their ligand-receptor pairs for different disease states |
| Ligand | Receptor | LRpair | Pathway | Tissue | Disease Stage |
| Page: 1 |
Top |
Single-cell gene regulatory network inference analysis |
| Find out the significant the regulons (TFs) and the target genes of each regulon across cell types for different disease states |
| TF | Cell Type | Tissue | Disease Stage | Target Gene | RSS | Regulon Activity |
| ∗The dot plots of a searched regulon are shown for all cell subpopulations in each disease state of each tissue based on the regulon specific score inferred using pySCENIC and by calculating the average expression. |
| Page: 1 |
Top |
Somatic mutation of malignant transformation related genes |
| Annotation of somatic variants for genes involved in malignant transformation |
| Hugo Symbol | Variant Class | Variant Classification | dbSNP RS | HGVSc | HGVSp | HGVSp Short | SWISSPROT | BIOTYPE | SIFT | PolyPhen | Tumor Sample Barcode | Tissue | Histology | Sex | Age | Stage | Therapy Types | Drugs | Outcome |
| FAM120B | SNV | Missense_Mutation | rs546217680 | c.1748N>G | p.Val583Gly | p.V583G | protein_coding | tolerated(0.21) | benign(0.366) | TCGA-A8-A08H-01 | Breast | breast invasive carcinoma | Female | >=65 | I/II | Unknown | Unknown | SD | |
| FAM120B | SNV | Missense_Mutation | rs774898725 | c.586N>T | p.Leu196Phe | p.L196F | protein_coding | deleterious(0) | benign(0.19) | TCGA-BH-A0B7-01 | Breast | breast invasive carcinoma | Female | <65 | I/II | Chemotherapy | adriamycin | CR | |
| FAM120B | deletion | In_Frame_Del | c.387_392delNNNNNN | p.Lys130_Asn131del | p.K130_N131del | protein_coding | TCGA-A8-A06Y-01 | Breast | breast invasive carcinoma | Female | >=65 | I/II | Hormone Therapy | anastrozole | PD | ||||
| FAM120B | insertion | Nonsense_Mutation | novel | c.2216_2217insGCTAACATTTTACCGCATTTATGAAAAGAAGTAACTTTGTA | p.Phe740LeufsTer11 | p.F740Lfs*11 | protein_coding | TCGA-BH-A0BR-01 | Breast | breast invasive carcinoma | Female | <65 | I/II | Unknown | Unknown | SD | |||
| FAM120B | SNV | Missense_Mutation | novel | c.485N>C | p.Val162Ala | p.V162A | protein_coding | deleterious(0.05) | benign(0.04) | TCGA-C5-A1MH-01 | Cervix | cervical & endocervical cancer | Female | >=65 | III/IV | Chemotherapy | cisplatin | PD | |
| FAM120B | SNV | Missense_Mutation | rs777800651 | c.380G>A | p.Arg127Gln | p.R127Q | protein_coding | deleterious(0) | probably_damaging(0.997) | TCGA-Q1-A73O-01 | Cervix | cervical & endocervical cancer | Female | <65 | I/II | Chemotherapy | cisplatin | CR | |
| FAM120B | SNV | Missense_Mutation | c.1978T>C | p.Cys660Arg | p.C660R | protein_coding | tolerated(0.42) | benign(0.003) | TCGA-A6-5665-01 | Colorectum | colon adenocarcinoma | Female | >=65 | I/II | Unknown | Unknown | PD | ||
| FAM120B | SNV | Missense_Mutation | rs546217680 | c.1748T>G | p.Val583Gly | p.V583G | protein_coding | tolerated(0.21) | benign(0.366) | TCGA-AA-3818-01 | Colorectum | colon adenocarcinoma | Female | >=65 | I/II | Unknown | Unknown | PD | |
| FAM120B | SNV | Missense_Mutation | novel | c.2306N>T | p.Ala769Val | p.A769V | protein_coding | tolerated(0.26) | benign(0.395) | TCGA-AA-3845-01 | Colorectum | colon adenocarcinoma | Female | >=65 | I/II | Unknown | Unknown | PD | |
| FAM120B | SNV | Missense_Mutation | rs544872777 | c.2642N>A | p.Arg881Gln | p.R881Q | protein_coding | tolerated(0.05) | benign(0.051) | TCGA-AA-3864-01 | Colorectum | colon adenocarcinoma | Male | >=65 | I/II | Unknown | Unknown | SD |
| Page: 1 2 3 4 5 6 7 8 9 10 11 |
Top |
Related drugs of malignant transformation related genes |
| Identification of chemicals and drugs interact with genes involved in malignant transfromation |
| (DGIdb 4.0) |
| Entrez ID | Symbol | Category | Interaction Types | Drug Claim Name | Drug Name | PMIDs |
| Page: 1 |

Copyright 2023-Present -The University of Texas Health Science Center at Houston |