
|
|||||
|
 | |
| |
| |
| |
| |
| |
|
Gene: ERV3-1 |
Gene summary for ERV3-1 |
| Gene information | Species | Human | Gene symbol | ERV3-1 | Gene ID | 2086 |
| Gene name | endogenous retrovirus group 3 member 1, envelope | |
| Gene Alias | ERV-R | |
| Cytomap | 7q11.21 | |
| Gene Type | protein-coding | GO ID | GO:0008150 | UniProtAcc | Q14264 |
Top |
Malignant transformation analysis |
| Identification of the aberrant gene expression in precancerous and cancerous lesions by comparing the gene expression of stem-like cells in diseased tissues with normal stem cells |
| Entrez ID | Symbol | Replicates | Species | Organ | Tissue | Adj P-value | Log2FC | Malignancy |
| 2086 | ERV3-1 | HCC1_Meng | Human | Liver | HCC | 6.66e-27 | 2.76e-03 | 0.0246 |
| 2086 | ERV3-1 | HCC2_Meng | Human | Liver | HCC | 3.98e-11 | 2.83e-02 | 0.0107 |
| 2086 | ERV3-1 | cirrhotic1 | Human | Liver | Cirrhotic | 3.61e-04 | 1.07e-01 | 0.0202 |
| 2086 | ERV3-1 | cirrhotic2 | Human | Liver | Cirrhotic | 7.01e-04 | 1.07e-01 | 0.0201 |
| 2086 | ERV3-1 | HCC5 | Human | Liver | HCC | 8.99e-16 | 4.08e-01 | 0.4932 |
| 2086 | ERV3-1 | S027 | Human | Liver | HCC | 5.84e-12 | 1.20e+00 | 0.2446 |
| 2086 | ERV3-1 | S028 | Human | Liver | HCC | 9.57e-33 | 1.38e+00 | 0.2503 |
| 2086 | ERV3-1 | S029 | Human | Liver | HCC | 1.98e-30 | 1.49e+00 | 0.2581 |
| 2086 | ERV3-1 | RNA-P17T-P17T-6 | Human | Lung | IAC | 6.21e-05 | 5.63e-01 | 0.3385 |
| 2086 | ERV3-1 | RNA-P17T-P17T-8 | Human | Lung | IAC | 9.17e-04 | 5.59e-01 | 0.3329 |
| 2086 | ERV3-1 | RNA-P3T-P3T-4 | Human | Lung | IAC | 4.76e-05 | 5.27e-01 | 0.1859 |
| 2086 | ERV3-1 | RNA-P6T2-P6T2-2 | Human | Lung | IAC | 6.80e-04 | 2.79e-01 | -0.0132 |
| 2086 | ERV3-1 | C04 | Human | Oral cavity | OSCC | 1.06e-13 | 5.12e-01 | 0.2633 |
| 2086 | ERV3-1 | C21 | Human | Oral cavity | OSCC | 1.00e-30 | 1.25e+00 | 0.2678 |
| 2086 | ERV3-1 | C43 | Human | Oral cavity | OSCC | 3.86e-06 | 2.08e-01 | 0.1704 |
| 2086 | ERV3-1 | C46 | Human | Oral cavity | OSCC | 4.73e-13 | 2.83e-01 | 0.1673 |
| 2086 | ERV3-1 | C51 | Human | Oral cavity | OSCC | 9.05e-10 | 3.83e-01 | 0.2674 |
| 2086 | ERV3-1 | C57 | Human | Oral cavity | OSCC | 2.73e-17 | 5.10e-01 | 0.1679 |
| 2086 | ERV3-1 | C08 | Human | Oral cavity | OSCC | 3.71e-25 | 5.12e-01 | 0.1919 |
| 2086 | ERV3-1 | SYSMH1 | Human | Oral cavity | OSCC | 3.03e-11 | 3.16e-01 | 0.1127 |
| Page: 1 2 3 4 5 |
| Tissue | Expression Dynamics | Abbreviation |
| Esophagus | 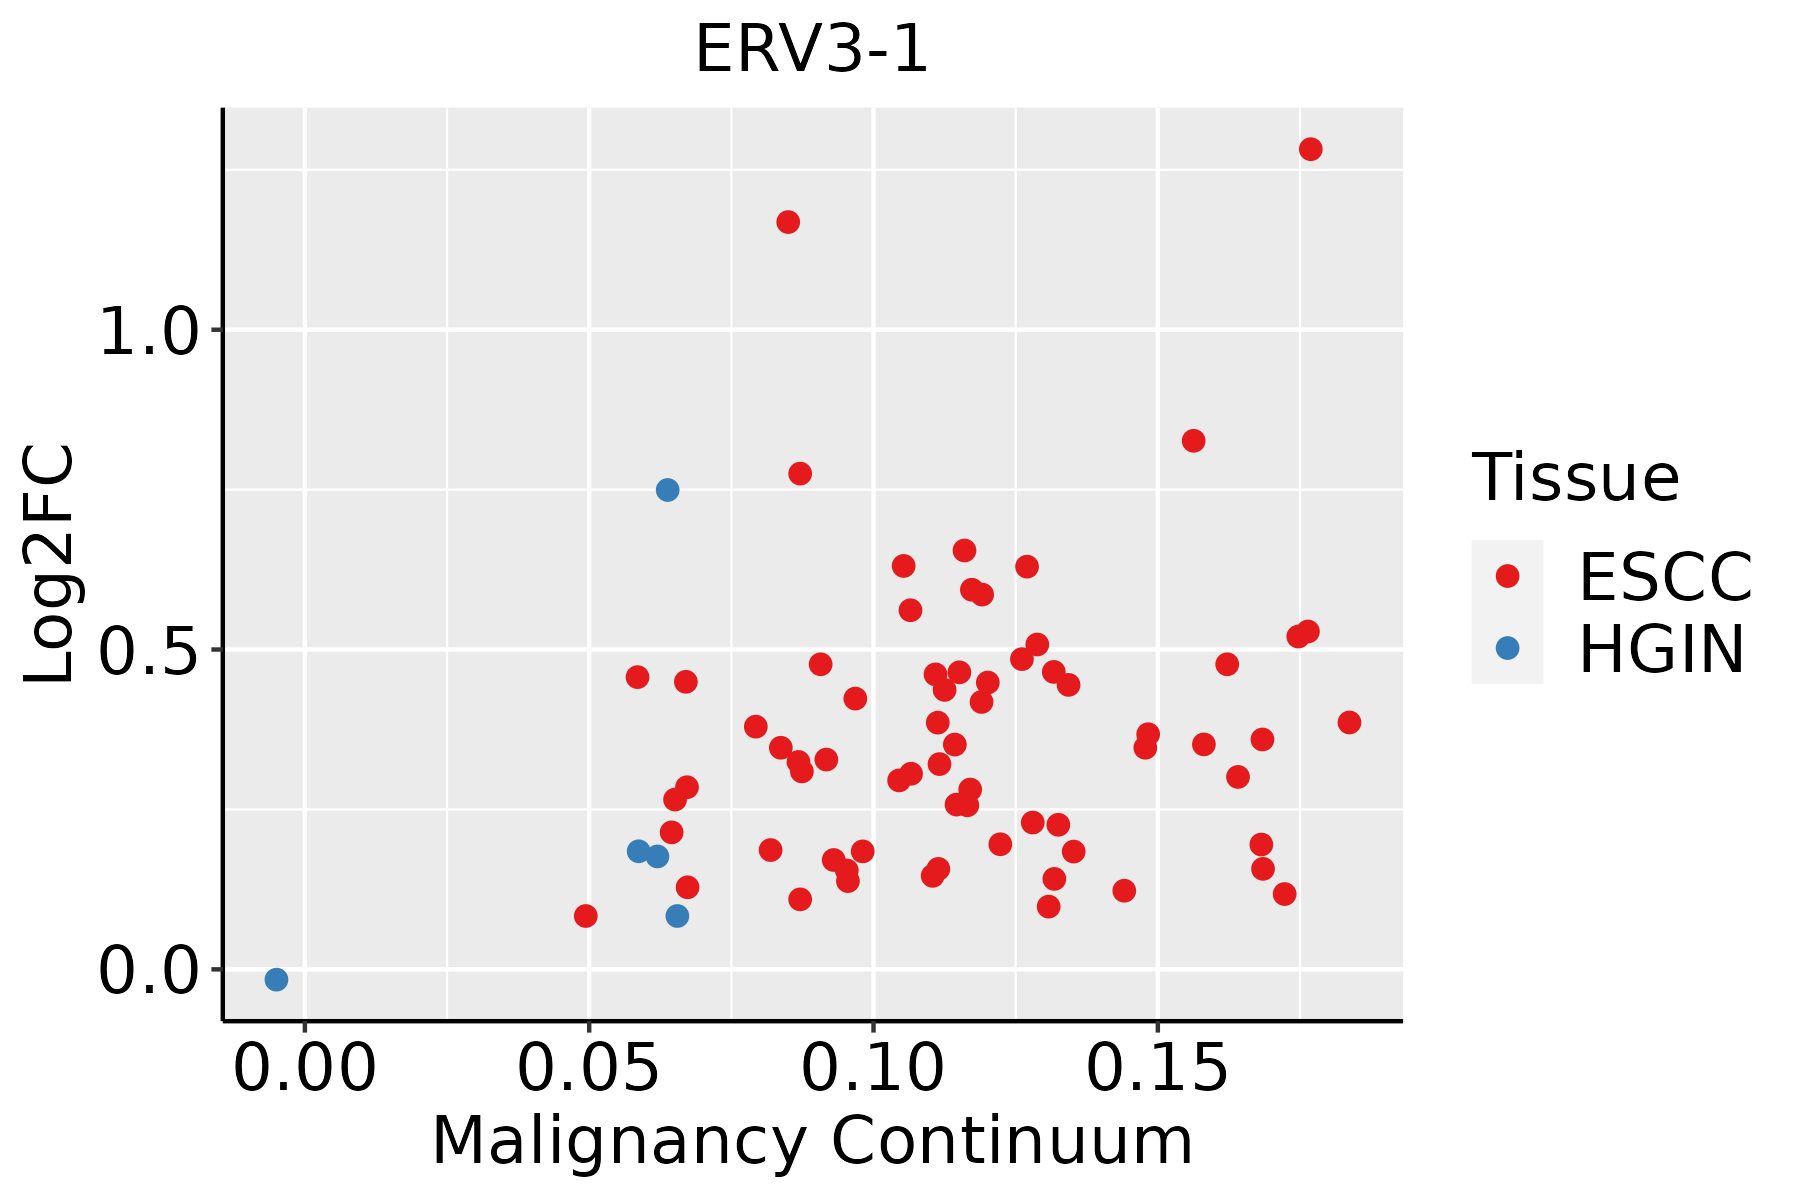 | ESCC: Esophageal squamous cell carcinoma |
| HGIN: High-grade intraepithelial neoplasias | ||
| LGIN: Low-grade intraepithelial neoplasias | ||
| Liver | 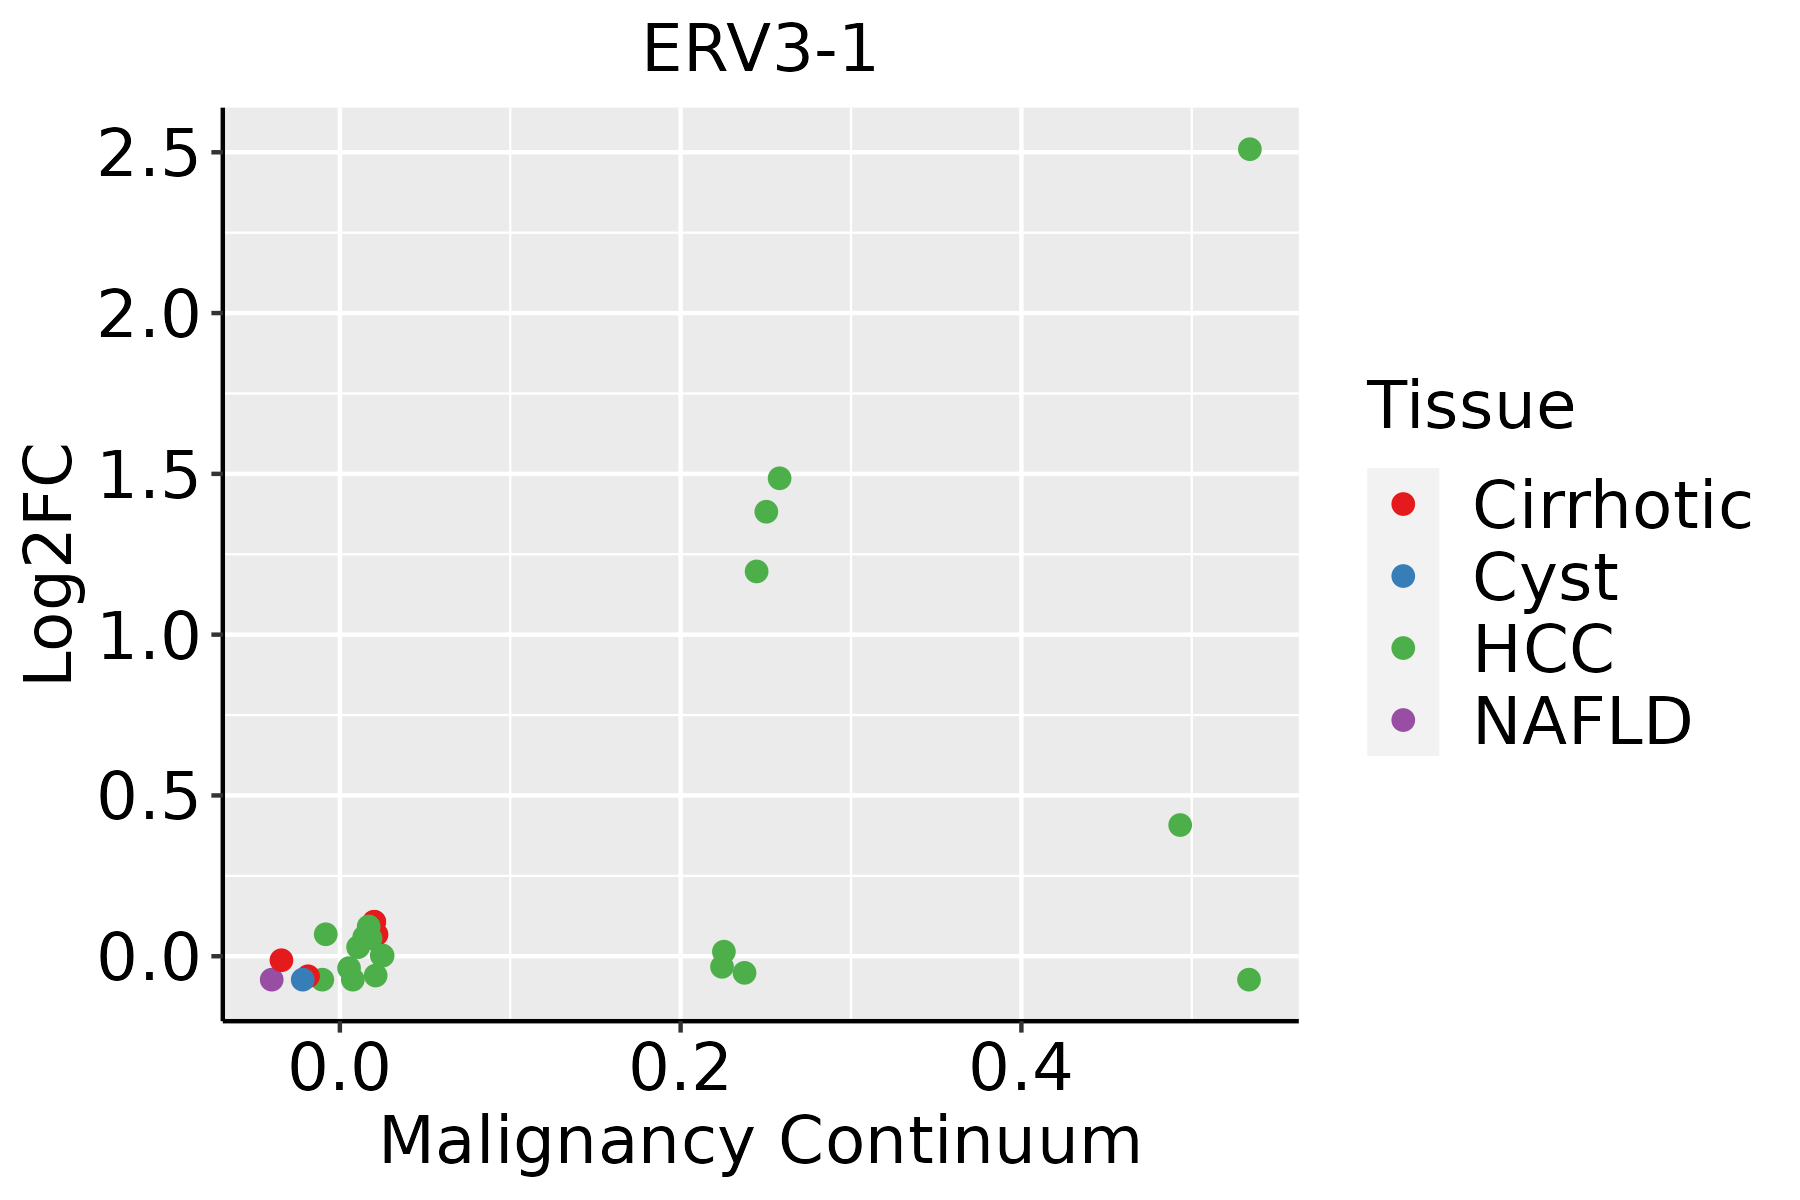 | HCC: Hepatocellular carcinoma |
| NAFLD: Non-alcoholic fatty liver disease | ||
| Lung | 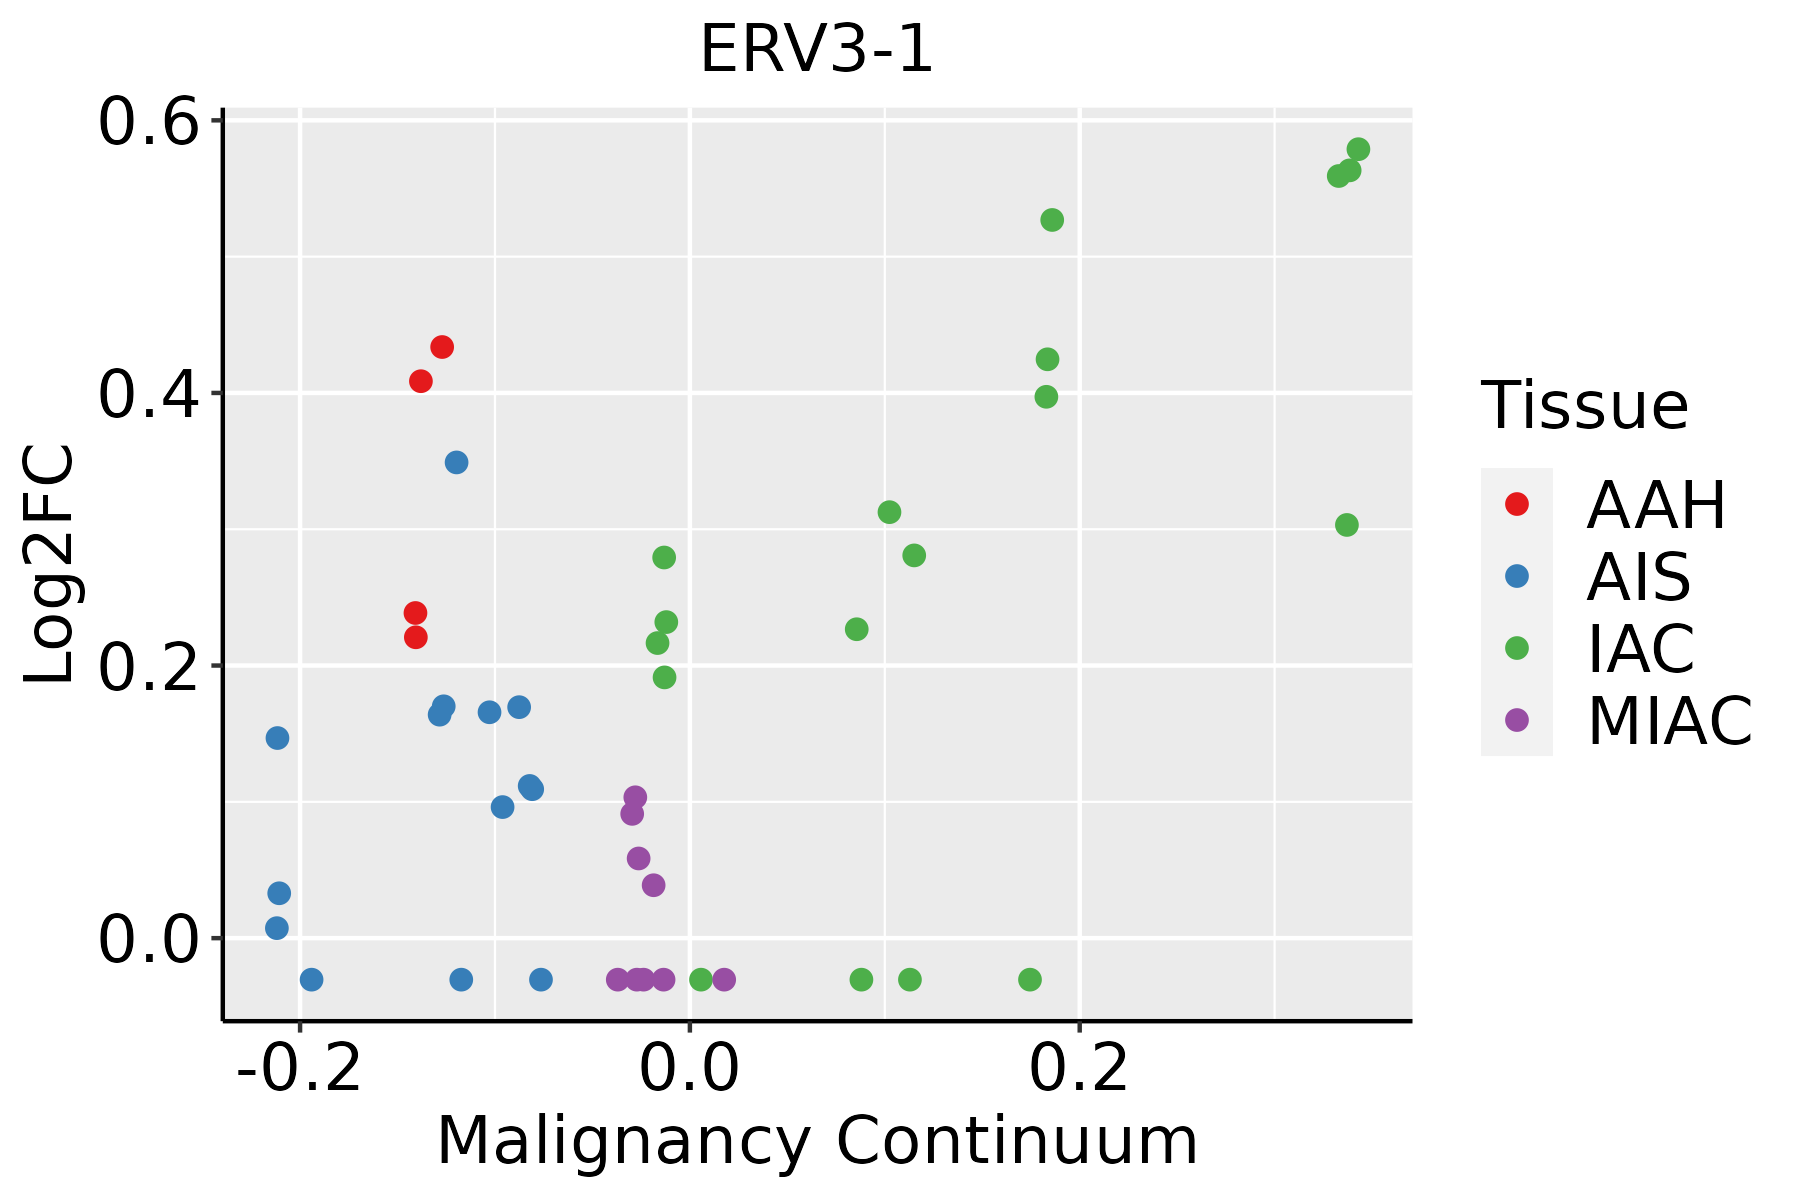 | AAH: Atypical adenomatous hyperplasia |
| AIS: Adenocarcinoma in situ | ||
| IAC: Invasive lung adenocarcinoma | ||
| MIA: Minimally invasive adenocarcinoma | ||
| Oral Cavity | 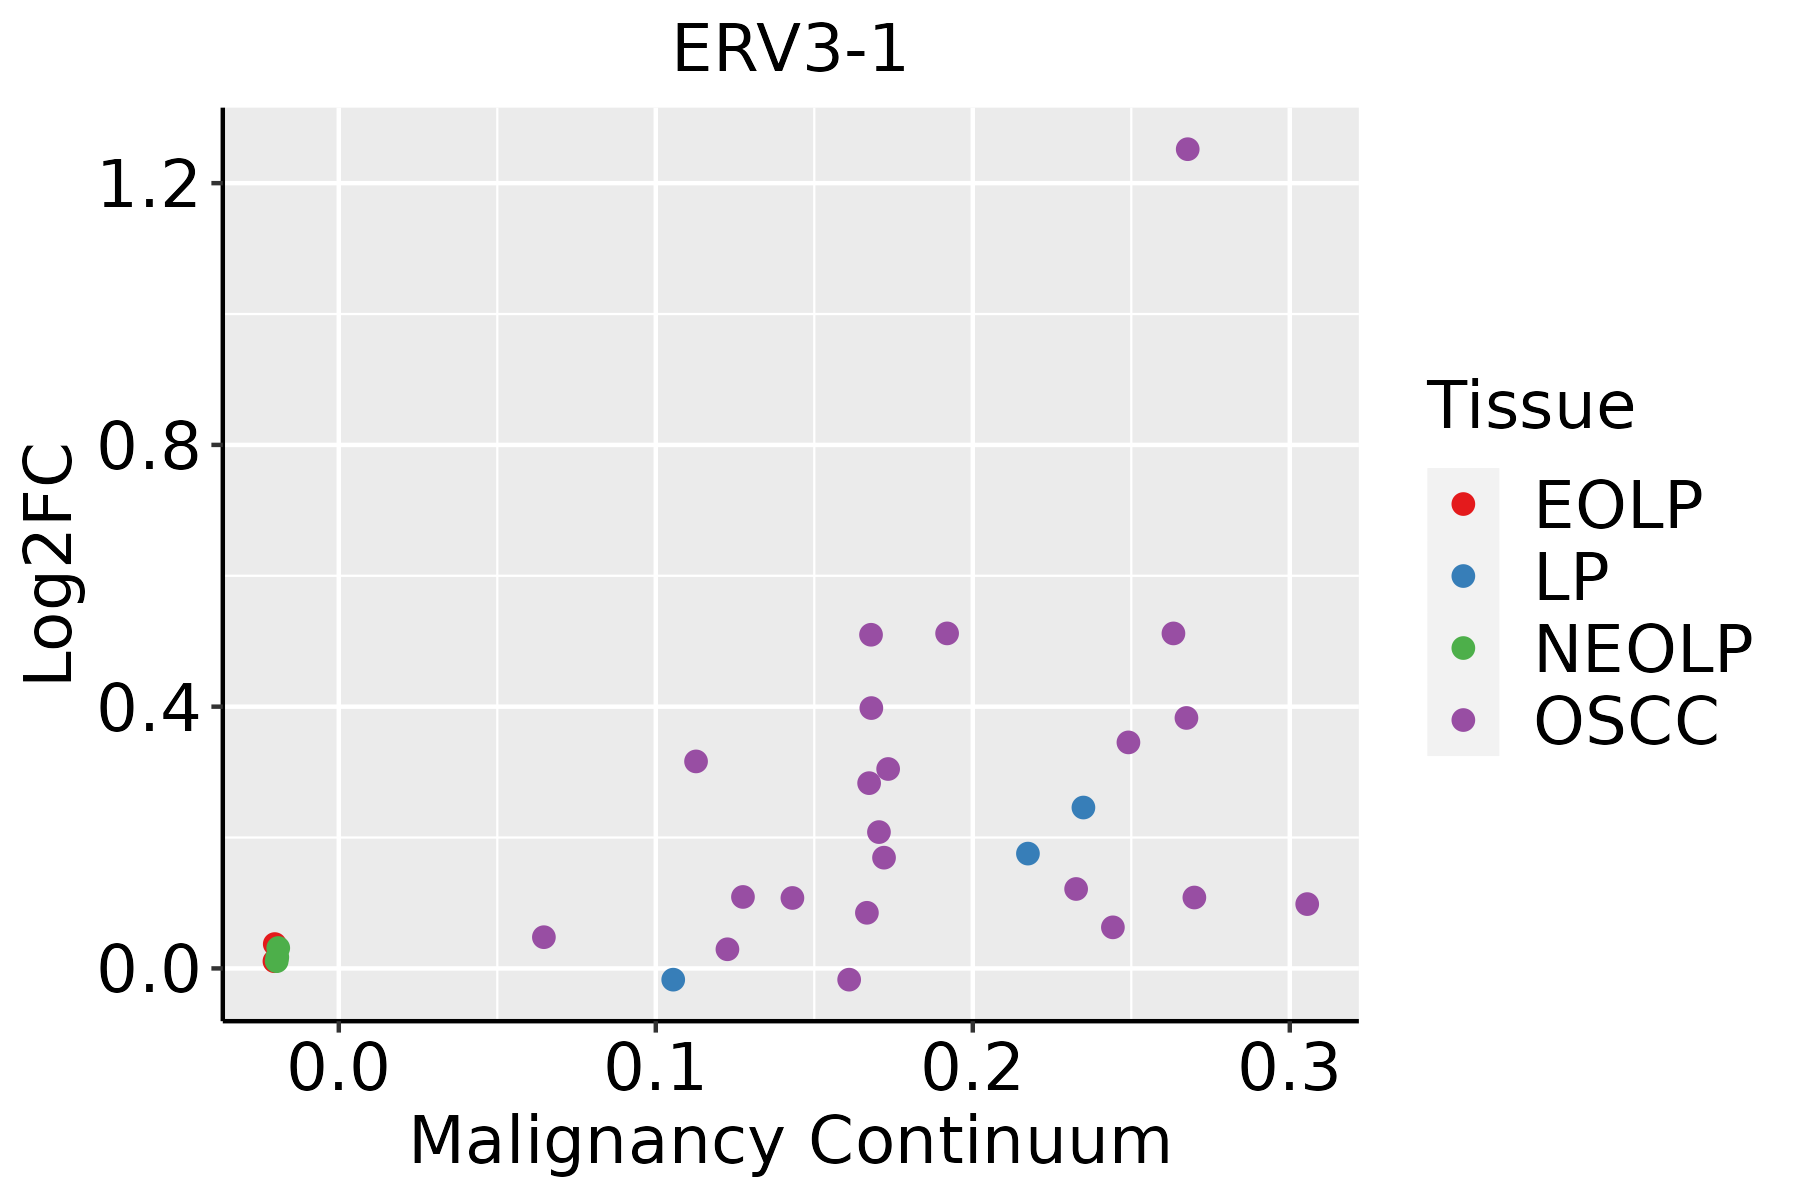 | EOLP: Erosive Oral lichen planus |
| LP: leukoplakia | ||
| NEOLP: Non-erosive oral lichen planus | ||
| OSCC: Oral squamous cell carcinoma | ||
| Thyroid |  | ATC: Anaplastic thyroid cancer |
| HT: Hashimoto's thyroiditis | ||
| PTC: Papillary thyroid cancer |
| ∗log2FC in expression of this searched gene in stem-like cells from each diseased tissue sample relative to stem-like cells in normal samples in each tissue plotted against the malignancy continuum. Samples are colored based on if they are from different disease stage. |
Top |
Malignant transformation related pathway analysis |
| Find out the enriched GO biological processes and KEGG pathways involved in transition from healthy to precancer to cancer |
| Tissue | Disease Stage | Enriched GO biological Processes |
| Colorectum | AD |  |
| Colorectum | SER |  |
| Colorectum | MSS |  |
| Colorectum | MSI-H |  |
| Colorectum | FAP |  |
| ∗Top 15 enriched GO BP terms are showed in the bar plot of each disease state in each tissue. Each row represents a significant GO biological process which is colored according to the -log10(p.adjust). |
| Page: 1 2 3 4 5 6 7 8 9 |
| GO ID | Tissue | Disease Stage | Description | Gene Ratio | Bg Ratio | pvalue | p.adjust | Count |
| Page: 1 |
| Pathway ID | Tissue | Disease Stage | Description | Gene Ratio | Bg Ratio | pvalue | p.adjust | qvalue | Count |
| Page: 1 |
Top |
Cell-cell communication analysis |
| Identification of potential cell-cell interactions between two cell types and their ligand-receptor pairs for different disease states |
| Ligand | Receptor | LRpair | Pathway | Tissue | Disease Stage |
| Page: 1 |
Top |
Single-cell gene regulatory network inference analysis |
| Find out the significant the regulons (TFs) and the target genes of each regulon across cell types for different disease states |
| TF | Cell Type | Tissue | Disease Stage | Target Gene | RSS | Regulon Activity |
| ∗The dot plots of a searched regulon are shown for all cell subpopulations in each disease state of each tissue based on the regulon specific score inferred using pySCENIC and by calculating the average expression. |
| Page: 1 |
Top |
Somatic mutation of malignant transformation related genes |
| Annotation of somatic variants for genes involved in malignant transformation |
| Hugo Symbol | Variant Class | Variant Classification | dbSNP RS | HGVSc | HGVSp | HGVSp Short | SWISSPROT | BIOTYPE | SIFT | PolyPhen | Tumor Sample Barcode | Tissue | Histology | Sex | Age | Stage | Therapy Types | Drugs | Outcome |
| ERV3-1 | SNV | Missense_Mutation | rs200537808 | c.1615N>A | p.Gln539Lys | p.Q539K | Q14264 | protein_coding | deleterious(0.05) | benign(0.106) | TCGA-A2-A25A-01 | Breast | breast invasive carcinoma | Female | <65 | I/II | Unspecific | Cytoxan | SD |
| ERV3-1 | SNV | Missense_Mutation | rs377605592 | c.403G>A | p.Val135Ile | p.V135I | Q14264 | protein_coding | tolerated(0.33) | benign(0.001) | TCGA-AN-A046-01 | Breast | breast invasive carcinoma | Female | >=65 | I/II | Unknown | Unknown | SD |
| ERV3-1 | SNV | Missense_Mutation | c.1310G>A | p.Cys437Tyr | p.C437Y | Q14264 | protein_coding | deleterious(0) | probably_damaging(0.955) | TCGA-BH-A0HF-01 | Breast | breast invasive carcinoma | Female | >=65 | I/II | Hormone Therapy | arimidex | SD | |
| ERV3-1 | SNV | Missense_Mutation | novel | c.1609N>C | p.Ala537Pro | p.A537P | Q14264 | protein_coding | deleterious(0.01) | possibly_damaging(0.537) | TCGA-BH-A1FN-01 | Breast | breast invasive carcinoma | Female | <65 | I/II | Unknown | Unknown | PD |
| ERV3-1 | SNV | Missense_Mutation | rs762732410 | c.227G>A | p.Gly76Asp | p.G76D | Q14264 | protein_coding | tolerated(0.49) | benign(0.012) | TCGA-C8-A12U-01 | Breast | breast invasive carcinoma | Female | <65 | I/II | Unknown | Unknown | SD |
| ERV3-1 | SNV | Missense_Mutation | rs200537808 | c.1615N>A | p.Gln539Lys | p.Q539K | Q14264 | protein_coding | deleterious(0.05) | benign(0.106) | TCGA-EW-A1J6-01 | Breast | breast invasive carcinoma | Female | >=65 | I/II | Hormone Therapy | femara | SD |
| ERV3-1 | insertion | Nonsense_Mutation | novel | c.1079_1080insCAGATGATTCTTCTGCTTCAGTCTCCTGAGTAGCTGGGATC | p.Leu360PhefsTer3 | p.L360Ffs*3 | Q14264 | protein_coding | TCGA-A8-A07P-01 | Breast | breast invasive carcinoma | Female | >=65 | I/II | Chemotherapy | 5-fluorouracil | SD | ||
| ERV3-1 | insertion | In_Frame_Ins | novel | c.776_777insATATTGTTGTCCTAG | p.Glu259_His260insTyrCysCysProArg | p.E259_H260insYCCPR | Q14264 | protein_coding | TCGA-AR-A0U0-01 | Breast | breast invasive carcinoma | Female | >=65 | I/II | Unknown | Unknown | SD | ||
| ERV3-1 | deletion | In_Frame_Del | c.74_88delGGGAGGGATGCCTCC | p.Trp25_His30delinsTyr | p.W25_H30delinsY | Q14264 | protein_coding | TCGA-E9-A22G-01 | Breast | breast invasive carcinoma | Female | <65 | I/II | Chemotherapy | doxorubicin | SD | |||
| ERV3-1 | SNV | Missense_Mutation | rs200537808 | c.1615N>A | p.Gln539Lys | p.Q539K | Q14264 | protein_coding | deleterious(0.05) | benign(0.106) | TCGA-C5-A8YT-01 | Cervix | cervical & endocervical cancer | Female | <65 | I/II | Chemotherapy | cisplatin | PD |
| Page: 1 2 3 4 5 6 7 8 |
Top |
Related drugs of malignant transformation related genes |
| Identification of chemicals and drugs interact with genes involved in malignant transfromation |
| (DGIdb 4.0) |
| Entrez ID | Symbol | Category | Interaction Types | Drug Claim Name | Drug Name | PMIDs |
| Page: 1 |

Copyright 2023-Present -The University of Texas Health Science Center at Houston |