Schematic overview of the cellular and molecular mechanisms involved in the cancer progression, including the proposed cellular and molecular mechanisms in cancer cells trajectory. AT1: alveolar type 1 cells; AT2: alveolar type 2 cells; AAH: atypical adenomatous hyperplasia; AIS: adenocarcinoma in situ; MIA: minimally invasive adenocarcinoma; IA: invasive adenocarcinoma; EMT: epithelial-mesenchymal transition

Home

Download

Statistics

Help

Contact

Center for Computational Systems Medicine
leaf

Gene summary

leaf

Malignant transformation analysis

leaf

Malignant transformation related pathway analysis

leaf

Cell-cell communication analysis

leaf

Single-cell gene regulatory network inference analysis

leaf

Somatic mutation of malignant transformation related genes

leaf

Related drugs of malignant transformation related genes

Gene: EPRS

Gene summary for EPRS

check button Gene summary.

Gene informationSpeciesHuman
Gene symbol

EPRS

Gene ID

2058

Gene nameglutamyl-prolyl-tRNA synthetase 1
Gene AliasEARS
Cytomap1q41
Gene Typeprotein-coding
GO ID

GO:0002376

UniProtAcc

P07814


Top

Malignant transformation analysis

check button Identification of the aberrant gene expression in precancerous and cancerous lesions by comparing the gene expression of stem-like cells in diseased tissues with normal stem cells
check button Malignant transformation involving gene list.
Entrez IDSymbolReplicatesSpeciesOrganTissueAdj P-valueLog2FCMalignancy
2058EPRSP127T-EHumanEsophagusESCC8.78e-123.02e-010.0826
2058EPRSP128T-EHumanEsophagusESCC1.47e-491.91e+000.1241
2058EPRSP130T-EHumanEsophagusESCC2.47e-701.85e+000.1676
2058EPRSHCC1_MengHumanLiverHCC8.18e-815.19e-010.0246
2058EPRSHCC2_MengHumanLiverHCC4.22e-371.98e-010.0107
2058EPRScirrhotic2HumanLiverCirrhotic1.17e-051.53e-010.0201
2058EPRSHCC1HumanLiverHCC6.77e-124.59e+000.5336
2058EPRSHCC2HumanLiverHCC2.90e-315.93e+000.5341
2058EPRSPt13.bHumanLiverHCC1.02e-162.95e-010.0251
2058EPRSPt14.aHumanLiverHCC2.17e-043.64e-010.0169
2058EPRSS014HumanLiverHCC3.26e-331.48e+000.2254
2058EPRSS015HumanLiverHCC2.10e-251.51e+000.2375
2058EPRSS016HumanLiverHCC1.45e-341.56e+000.2243
2058EPRSS027HumanLiverHCC3.38e-242.28e+000.2446
2058EPRSS028HumanLiverHCC2.08e-452.31e+000.2503
2058EPRSS029HumanLiverHCC5.62e-392.55e+000.2581
2058EPRSC04HumanOral cavityOSCC1.00e-191.16e+000.2633
2058EPRSC21HumanOral cavityOSCC1.47e-531.81e+000.2678
2058EPRSC30HumanOral cavityOSCC1.19e-281.24e+000.3055
2058EPRSC38HumanOral cavityOSCC1.40e-061.09e+000.172
Page: 1 2 3 4 5 6 7 

check button Transcriptomic changes along malignancy continuum.
TissueExpression DynamicsAbbreviation
EsophagusThe image shows the transcriptomic changes along malignancy continuum.log2FC in expression of this searched gene in stem-like cells from each diseased tissue sample relative to stem-like cells in normal samples in each tissue plotted against the malignancy continuum. Samples are colored based on if they are from different disease stage.
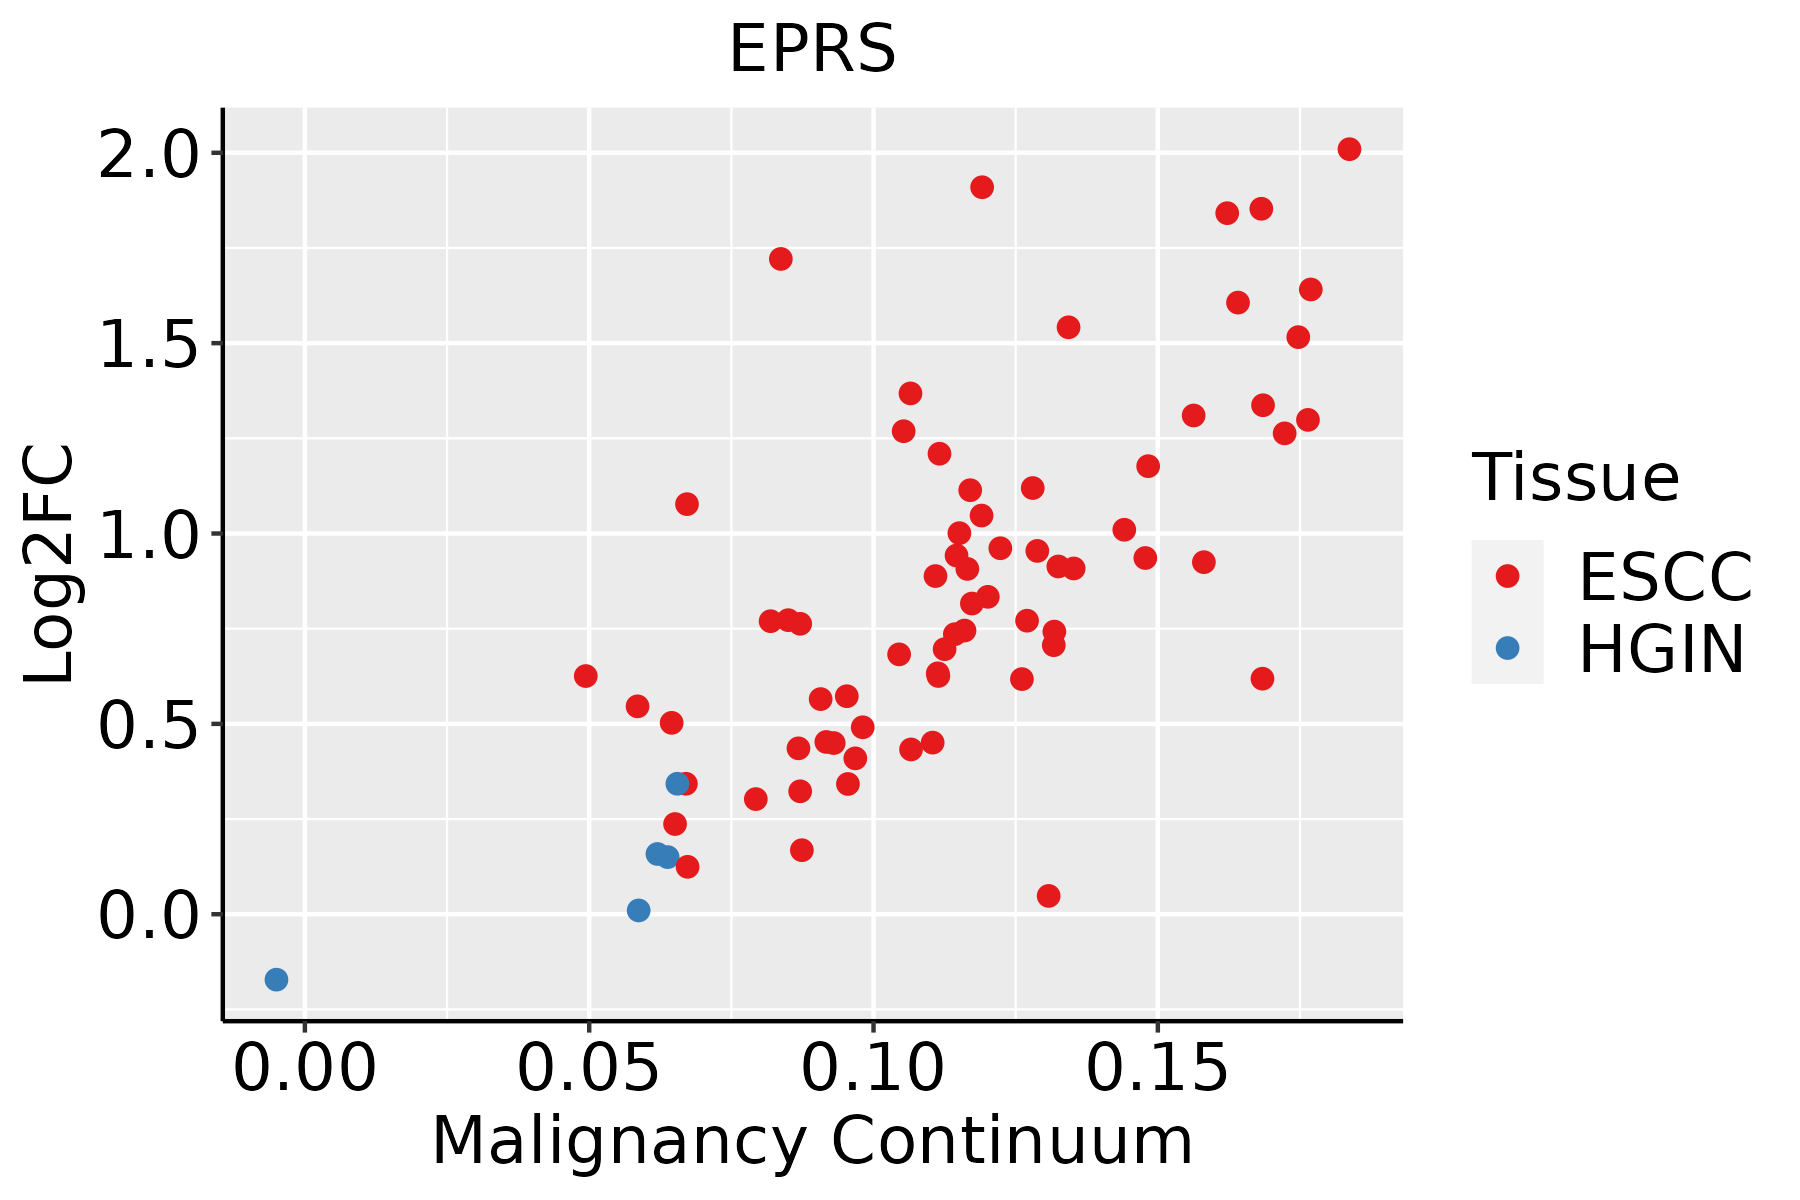
ESCC: Esophageal squamous cell carcinoma
HGIN: High-grade intraepithelial neoplasias
LGIN: Low-grade intraepithelial neoplasias
LiverThe image shows the transcriptomic changes along malignancy continuum.log2FC in expression of this searched gene in stem-like cells from each diseased tissue sample relative to stem-like cells in normal samples in each tissue plotted against the malignancy continuum. Samples are colored based on if they are from different disease stage.
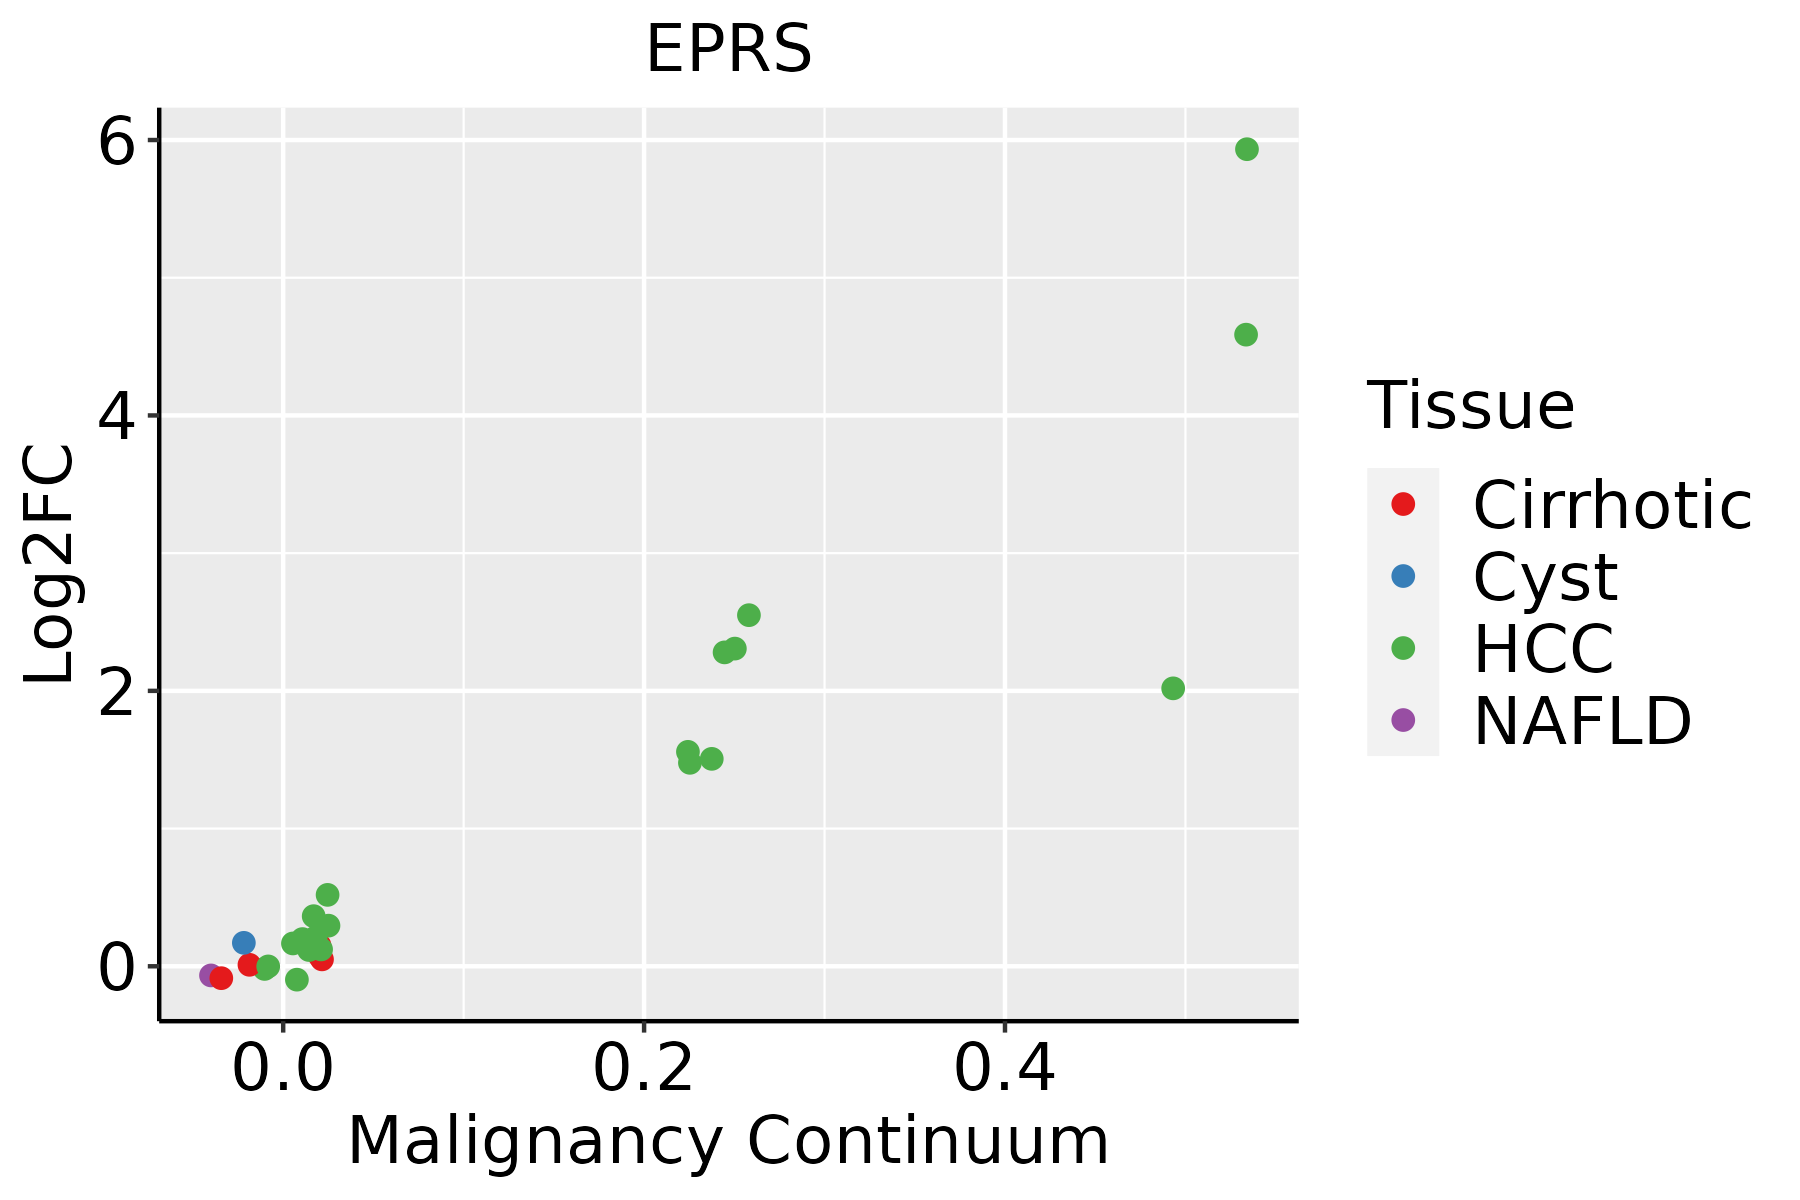
HCC: Hepatocellular carcinoma
NAFLD: Non-alcoholic fatty liver disease
Oral CavityThe image shows the transcriptomic changes along malignancy continuum.log2FC in expression of this searched gene in stem-like cells from each diseased tissue sample relative to stem-like cells in normal samples in each tissue plotted against the malignancy continuum. Samples are colored based on if they are from different disease stage.EOLP: Erosive Oral lichen planus
LP: leukoplakia
NEOLP: Non-erosive oral lichen planus
OSCC: Oral squamous cell carcinoma
ProstateThe image shows the transcriptomic changes along malignancy continuum.log2FC in expression of this searched gene in stem-like cells from each diseased tissue sample relative to stem-like cells in normal samples in each tissue plotted against the malignancy continuum. Samples are colored based on if they are from different disease stage.
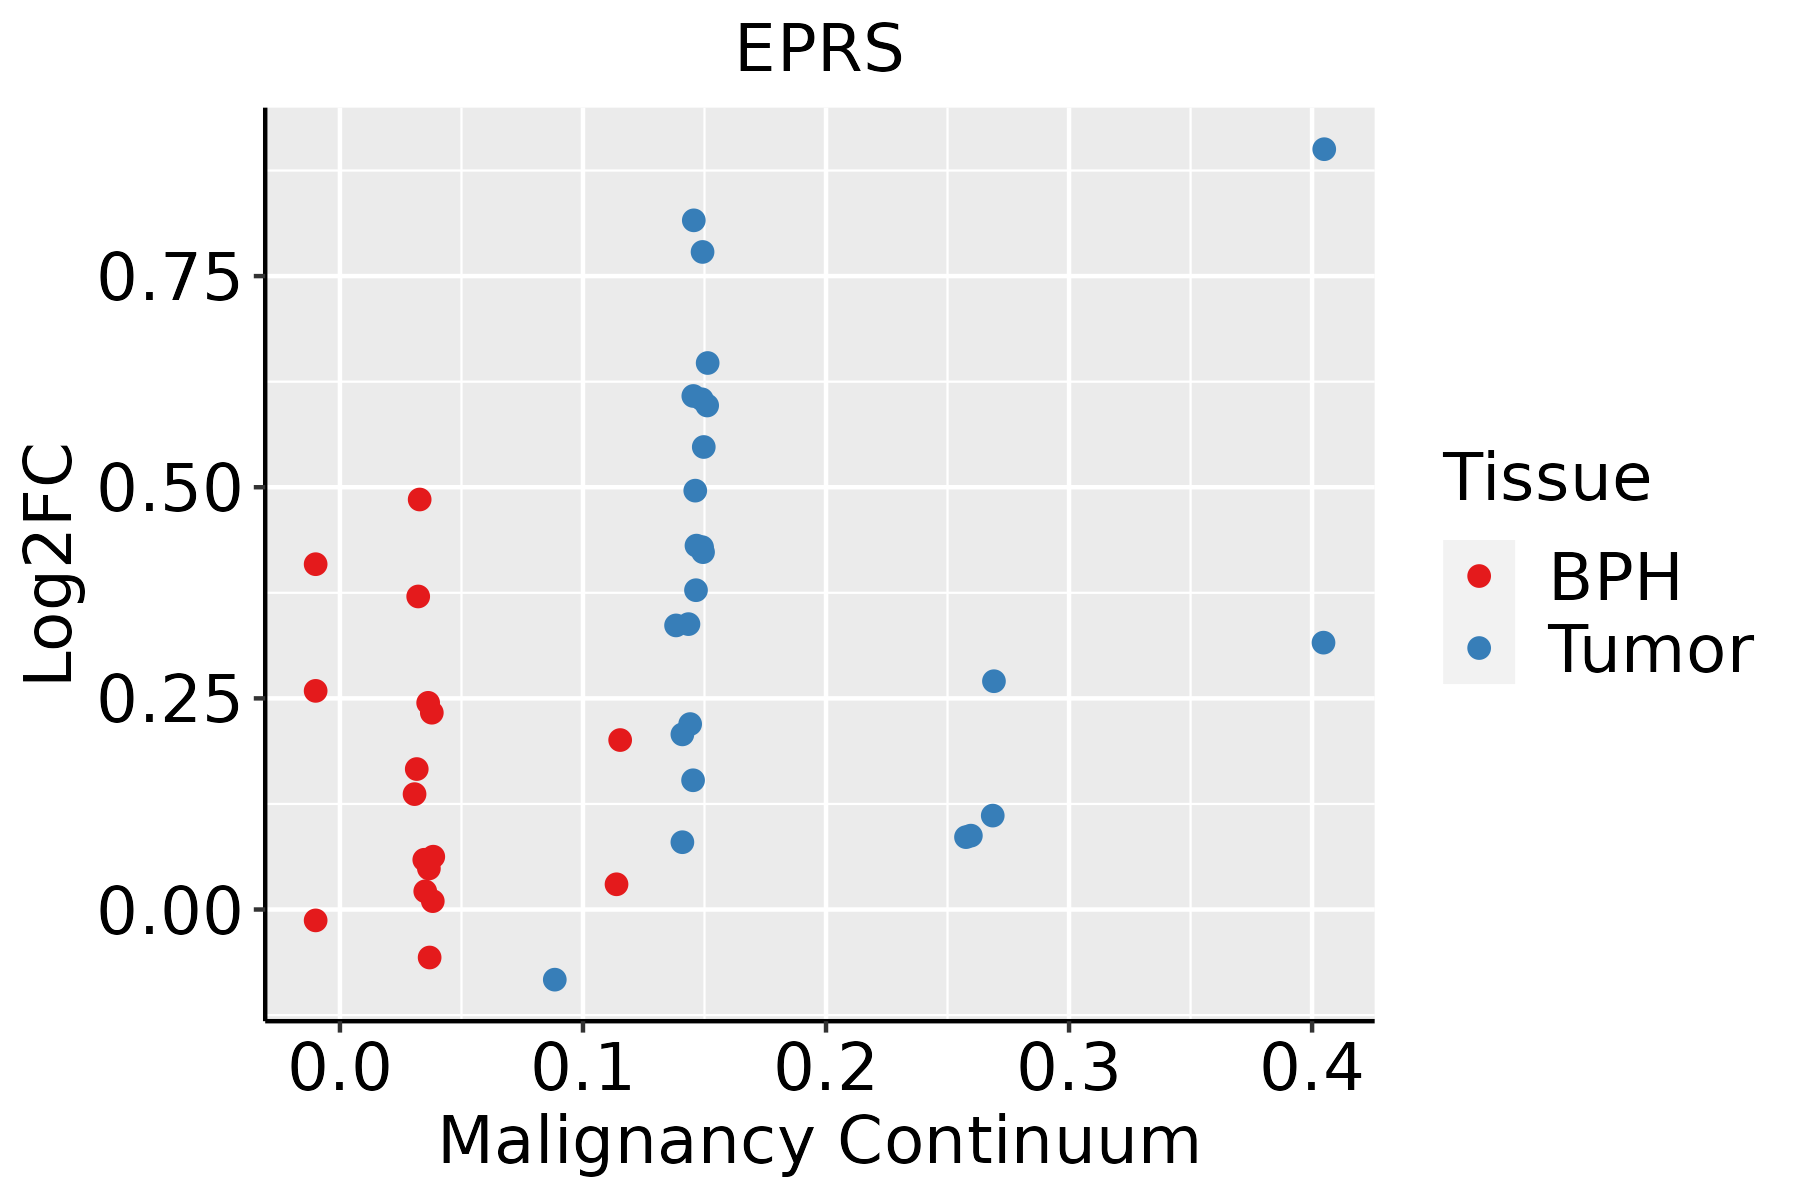
BPH: Benign Prostatic Hyperplasia
SkinThe image shows the transcriptomic changes along malignancy continuum.log2FC in expression of this searched gene in stem-like cells from each diseased tissue sample relative to stem-like cells in normal samples in each tissue plotted against the malignancy continuum. Samples are colored based on if they are from different disease stage.
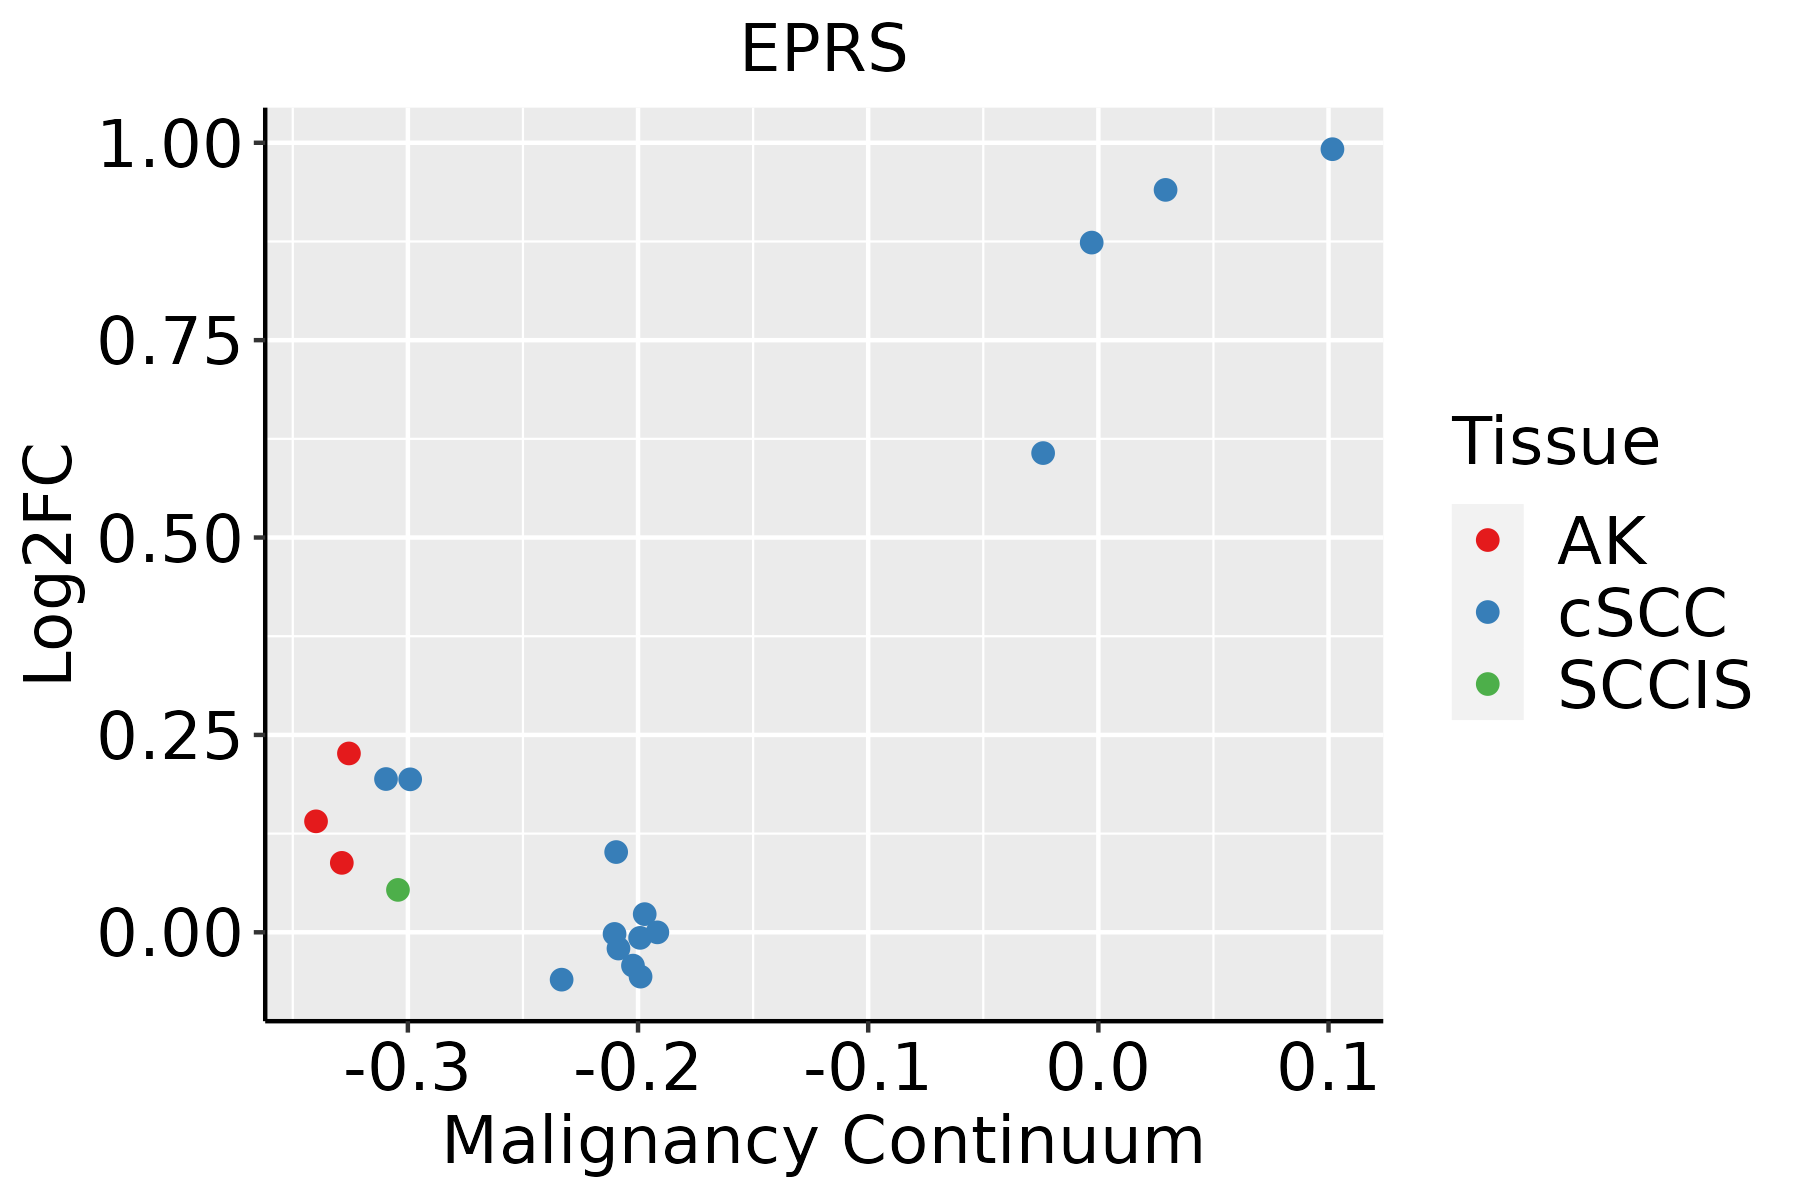
AK: Actinic keratosis
cSCC: Cutaneous squamous cell carcinoma
SCCIS:squamous cell carcinoma in situ
ThyroidThe image shows the transcriptomic changes along malignancy continuum.log2FC in expression of this searched gene in stem-like cells from each diseased tissue sample relative to stem-like cells in normal samples in each tissue plotted against the malignancy continuum. Samples are colored based on if they are from different disease stage.
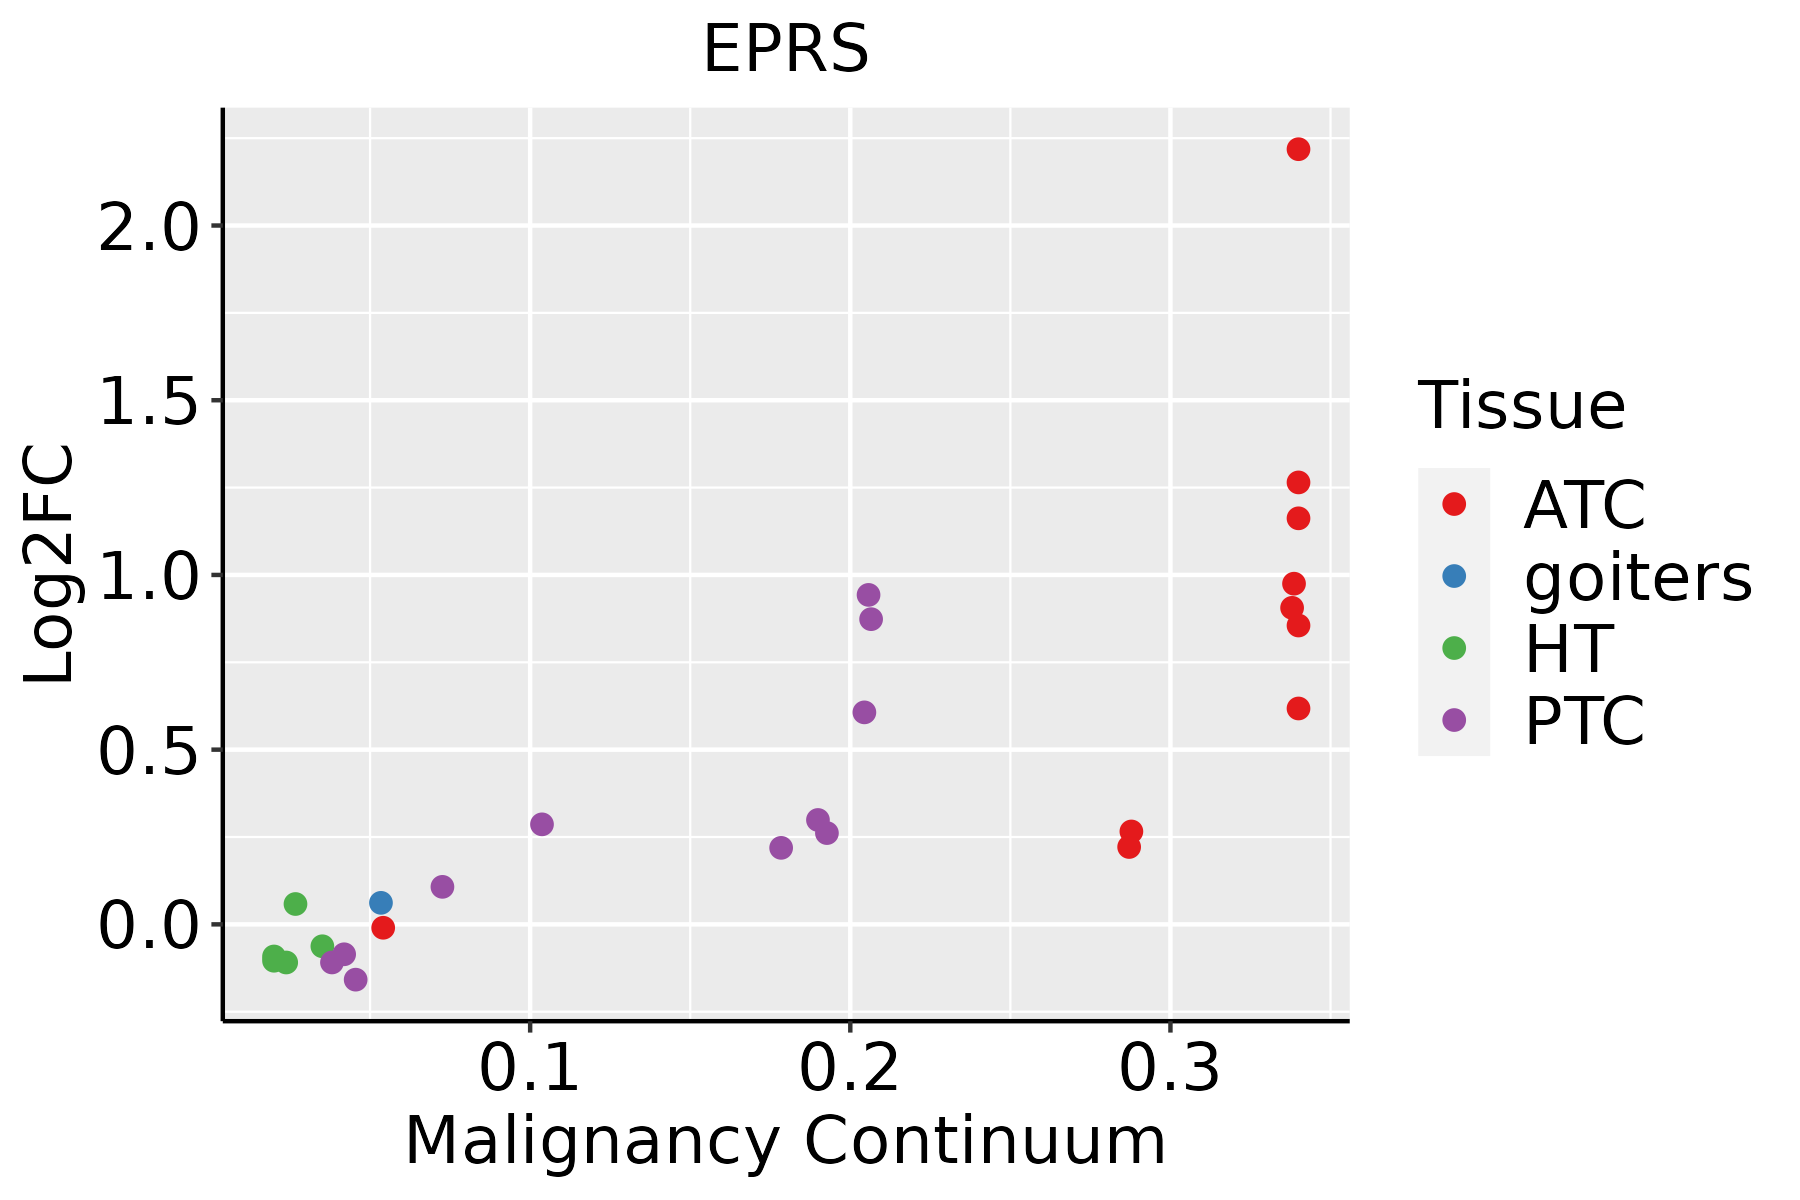
ATC: Anaplastic thyroid cancer
HT: Hashimoto's thyroiditis
PTC: Papillary thyroid cancer
∗log2FC in expression of this searched gene in stem-like cells from each diseased tissue sample relative to stem-like cells in normal samples in each tissue plotted against the malignancy continuum. Samples are colored based on if they are from different disease stage.

Top

Malignant transformation related pathway analysis

check buttonFind out the enriched GO biological processes and KEGG pathways involved in transition from healthy to precancer to cancer
check button Figure of enriched GO biological processes.
TissueDisease StageEnriched GO biological Processes
ColorectumADGO analysis - Figure of enriched GO biological processes: Top 15 enriched GO BP terms are showed in the bar plot of each disease state in each tissue. Each row represents a significant GO biological process which is colored according to the -log10(p.adjust).
ColorectumSERGO analysis - Figure of enriched GO biological processes: Top 15 enriched GO BP terms are showed in the bar plot of each disease state in each tissue. Each row represents a significant GO biological process which is colored according to the -log10(p.adjust).
ColorectumMSSGO analysis - Figure of enriched GO biological processes: Top 15 enriched GO BP terms are showed in the bar plot of each disease state in each tissue. Each row represents a significant GO biological process which is colored according to the -log10(p.adjust).
ColorectumMSI-HGO analysis - Figure of enriched GO biological processes: Top 15 enriched GO BP terms are showed in the bar plot of each disease state in each tissue. Each row represents a significant GO biological process which is colored according to the -log10(p.adjust).
ColorectumFAPGO analysis - Figure of enriched GO biological processes: Top 15 enriched GO BP terms are showed in the bar plot of each disease state in each tissue. Each row represents a significant GO biological process which is colored according to the -log10(p.adjust).
∗Top 15 enriched GO BP terms are showed in the bar plot of each disease state in each tissue. Each row represents a significant GO biological process which is colored according to the -log10(p.adjust).
Page: 1 2 3 4 5 6 7 8 9 

check button Enriched GO biological processes.
GO IDTissueDisease StageDescriptionGene RatioBg Ratiopvaluep.adjustCount
GO:0032868ColorectumADresponse to insulin91/3918264/187232.02e-078.48e-0691
GO:1901653ColorectumADcellular response to peptide114/3918359/187238.32e-072.88e-05114
GO:0032869ColorectumADcellular response to insulin stimulus72/3918203/187231.10e-063.68e-0572
GO:0006417ColorectumADregulation of translation141/3918468/187231.32e-064.22e-05141
GO:0071375ColorectumADcellular response to peptide hormone stimulus95/3918290/187231.50e-064.66e-0595
GO:0043434ColorectumADresponse to peptide hormone126/3918414/187232.70e-067.86e-05126
GO:0006418ColorectumADtRNA aminoacylation for protein translation19/391841/187232.37e-043.03e-0319
GO:0043039ColorectumADtRNA aminoacylation19/391844/187237.13e-047.21e-0319
GO:0043038ColorectumADamino acid activation19/391845/187239.94e-049.28e-0319
GO:0006520ColorectumADcellular amino acid metabolic process81/3918284/187231.37e-031.19e-0281
GO:0010876ColorectumADlipid localization120/3918448/187231.59e-031.33e-02120
GO:0006869ColorectumADlipid transport108/3918398/187231.67e-031.39e-02108
GO:2000191ColorectumADregulation of fatty acid transport14/391832/187233.03e-032.25e-0214
GO:00064181ColorectumSERtRNA aminoacylation for protein translation17/289741/187235.75e-051.35e-0317
GO:00328681ColorectumSERresponse to insulin65/2897264/187236.70e-051.53e-0365
GO:19016531ColorectumSERcellular response to peptide83/2897359/187238.03e-051.77e-0383
GO:00434341ColorectumSERresponse to peptide hormone93/2897414/187239.61e-052.04e-0393
GO:00430391ColorectumSERtRNA aminoacylation17/289744/187231.64e-043.12e-0317
GO:00713751ColorectumSERcellular response to peptide hormone stimulus68/2897290/187232.20e-043.89e-0368
GO:00430381ColorectumSERamino acid activation17/289745/187232.25e-043.91e-0317
Page: 1 2 

check button Enriched KEGG pathways.
Pathway IDTissueDisease StageDescriptionGene RatioBg Ratiopvaluep.adjustqvalueCount
Page: 1 

Top

Cell-cell communication analysis

check buttonIdentification of potential cell-cell interactions between two cell types and their ligand-receptor pairs for different disease states
LigandReceptorLRpairPathwayTissueDisease Stage
Page: 1 

Top

Single-cell gene regulatory network inference analysis

check buttonFind out the significant the regulons (TFs) and the target genes of each regulon across cell types for different disease states
TFCell TypeTissueDisease StageTarget GeneRSSRegulon Activity
∗The dot plots of a searched regulon are shown for all cell subpopulations in each disease state of each tissue based on the regulon specific score inferred using pySCENIC and by calculating the average expression.
Page: 1 

Top

Somatic mutation of malignant transformation related genes

check buttonAnnotation of somatic variants for genes involved in malignant transformation
Hugo SymbolVariant ClassVariant ClassificationdbSNP RSHGVScHGVSpHGVSp ShortSWISSPROTBIOTYPESIFTPolyPhenTumor Sample BarcodeTissueHistologySexAgeStageTherapy TypesDrugsOutcome
EPRSSNVMissense_Mutationc.866N>Tp.Ala289Valp.A289VP07814protein_codingdeleterious(0)possibly_damaging(0.735)TCGA-A8-A09Z-01Breastbreast invasive carcinomaFemale>=65I/IIUnknownUnknownSD
EPRSSNVMissense_Mutationc.3355C>Tp.Arg1119Cysp.R1119CP07814protein_codingdeleterious(0)probably_damaging(1)TCGA-AC-A23H-01Breastbreast invasive carcinomaFemale>=65I/IIUnknownUnknownPD
EPRSSNVMissense_Mutationc.2947G>Ap.Asp983Asnp.D983NP07814protein_codingtolerated(0.07)benign(0.047)TCGA-AC-A23H-01Breastbreast invasive carcinomaFemale>=65I/IIUnknownUnknownPD
EPRSSNVMissense_Mutationnovelc.760G>Ap.Glu254Lysp.E254KP07814protein_codingtolerated(0.12)possibly_damaging(0.556)TCGA-AC-A3W7-01Breastbreast invasive carcinomaFemale>=65I/IIHormone TherapyfemaraSD
EPRSSNVMissense_Mutationc.3753N>Ap.Met1251Ilep.M1251IP07814protein_codingdeleterious(0.01)possibly_damaging(0.463)TCGA-C8-A138-01Breastbreast invasive carcinomaFemale<65III/IVUnknownUnknownSD
EPRSSNVMissense_Mutationc.1058N>Tp.Asp353Valp.D353VP07814protein_codingdeleterious(0)probably_damaging(1)TCGA-D8-A1JP-01Breastbreast invasive carcinomaFemale>=65I/IIHormone TherapytamoxiphenSD
EPRSSNVMissense_Mutationc.2441N>Tp.Ser814Phep.S814FP07814protein_codingdeleterious(0.03)benign(0.098)TCGA-D8-A27G-01Breastbreast invasive carcinomaFemale>=65I/IIUnknownUnknownSD
EPRSSNVMissense_Mutationc.2284G>Ap.Asp762Asnp.D762NP07814protein_codingtolerated(0.34)benign(0.327)TCGA-D8-A27R-01Breastbreast invasive carcinomaFemale<65III/IVChemotherapyadriamycin+cyclophosphamideSD
EPRSSNVMissense_Mutationnovelc.3727C>Gp.His1243Aspp.H1243DP07814protein_codingdeleterious(0.02)probably_damaging(0.969)TCGA-OL-A5RW-01Breastbreast invasive carcinomaFemale<65I/IIChemotherapyadriamycinCR
EPRSinsertionIn_Frame_Insnovelc.4428_4429insTTACAGp.Ala1476_Lys1477insLeuGlnp.A1476_K1477insLQP07814protein_codingTCGA-AC-A3QQ-01Breastbreast invasive carcinomaFemale<65I/IIUnknownUnknownSD
Page: 1 2 3 4 5 6 7 8 9 10 11 12 13 14 15 16 17 18 

Top

Related drugs of malignant transformation related genes

check buttonIdentification of chemicals and drugs interact with genes involved in malignant transfromation
(DGIdb 4.0)
Entrez IDSymbolCategoryInteraction TypesDrug Claim NameDrug NamePMIDs
Page: 1