
|
|||||
|
 | |
| |
| |
| |
| |
| |
|
Gene: EPHB2 |
Gene summary for EPHB2 |
| Gene information | Species | Human | Gene symbol | EPHB2 | Gene ID | 2048 |
| Gene name | EPH receptor B2 | |
| Gene Alias | BDPLT22 | |
| Cytomap | 1p36.12 | |
| Gene Type | protein-coding | GO ID | GO:0000165 | UniProtAcc | B4DSE0 |
Top |
Malignant transformation analysis |
| Identification of the aberrant gene expression in precancerous and cancerous lesions by comparing the gene expression of stem-like cells in diseased tissues with normal stem cells |
| Entrez ID | Symbol | Replicates | Species | Organ | Tissue | Adj P-value | Log2FC | Malignancy |
| 2048 | EPHB2 | P42T-E | Human | Esophagus | ESCC | 2.79e-04 | 1.50e-01 | 0.1175 |
| 2048 | EPHB2 | P52T-E | Human | Esophagus | ESCC | 8.73e-28 | 5.05e-01 | 0.1555 |
| 2048 | EPHB2 | P56T-E | Human | Esophagus | ESCC | 1.10e-03 | 4.91e-01 | 0.1613 |
| 2048 | EPHB2 | P62T-E | Human | Esophagus | ESCC | 8.76e-11 | 2.36e-01 | 0.1302 |
| 2048 | EPHB2 | P74T-E | Human | Esophagus | ESCC | 4.76e-19 | 4.98e-01 | 0.1479 |
| 2048 | EPHB2 | P75T-E | Human | Esophagus | ESCC | 1.97e-10 | 1.98e-01 | 0.1125 |
| 2048 | EPHB2 | P76T-E | Human | Esophagus | ESCC | 1.66e-02 | 1.37e-01 | 0.1207 |
| 2048 | EPHB2 | P79T-E | Human | Esophagus | ESCC | 6.56e-15 | 3.01e-01 | 0.1154 |
| 2048 | EPHB2 | P80T-E | Human | Esophagus | ESCC | 7.90e-04 | 1.40e-01 | 0.155 |
| 2048 | EPHB2 | P82T-E | Human | Esophagus | ESCC | 1.98e-12 | 6.76e-01 | 0.1072 |
| 2048 | EPHB2 | P91T-E | Human | Esophagus | ESCC | 4.77e-11 | 8.06e-01 | 0.1828 |
| 2048 | EPHB2 | HCC1 | Human | Liver | HCC | 4.16e-09 | 3.19e+00 | 0.5336 |
| 2048 | EPHB2 | S014 | Human | Liver | HCC | 6.34e-23 | 9.13e-01 | 0.2254 |
| 2048 | EPHB2 | S015 | Human | Liver | HCC | 2.90e-18 | 8.51e-01 | 0.2375 |
| 2048 | EPHB2 | S016 | Human | Liver | HCC | 3.71e-30 | 1.03e+00 | 0.2243 |
| 2048 | EPHB2 | C04 | Human | Oral cavity | OSCC | 1.43e-19 | 6.19e-01 | 0.2633 |
| 2048 | EPHB2 | C21 | Human | Oral cavity | OSCC | 5.87e-17 | 4.65e-01 | 0.2678 |
| 2048 | EPHB2 | C30 | Human | Oral cavity | OSCC | 3.14e-40 | 1.23e+00 | 0.3055 |
| 2048 | EPHB2 | C43 | Human | Oral cavity | OSCC | 1.26e-13 | 2.54e-01 | 0.1704 |
| 2048 | EPHB2 | C51 | Human | Oral cavity | OSCC | 1.90e-10 | 4.22e-01 | 0.2674 |
| Page: 1 2 3 4 5 |
| Tissue | Expression Dynamics | Abbreviation |
| Colorectum (GSE201348) | 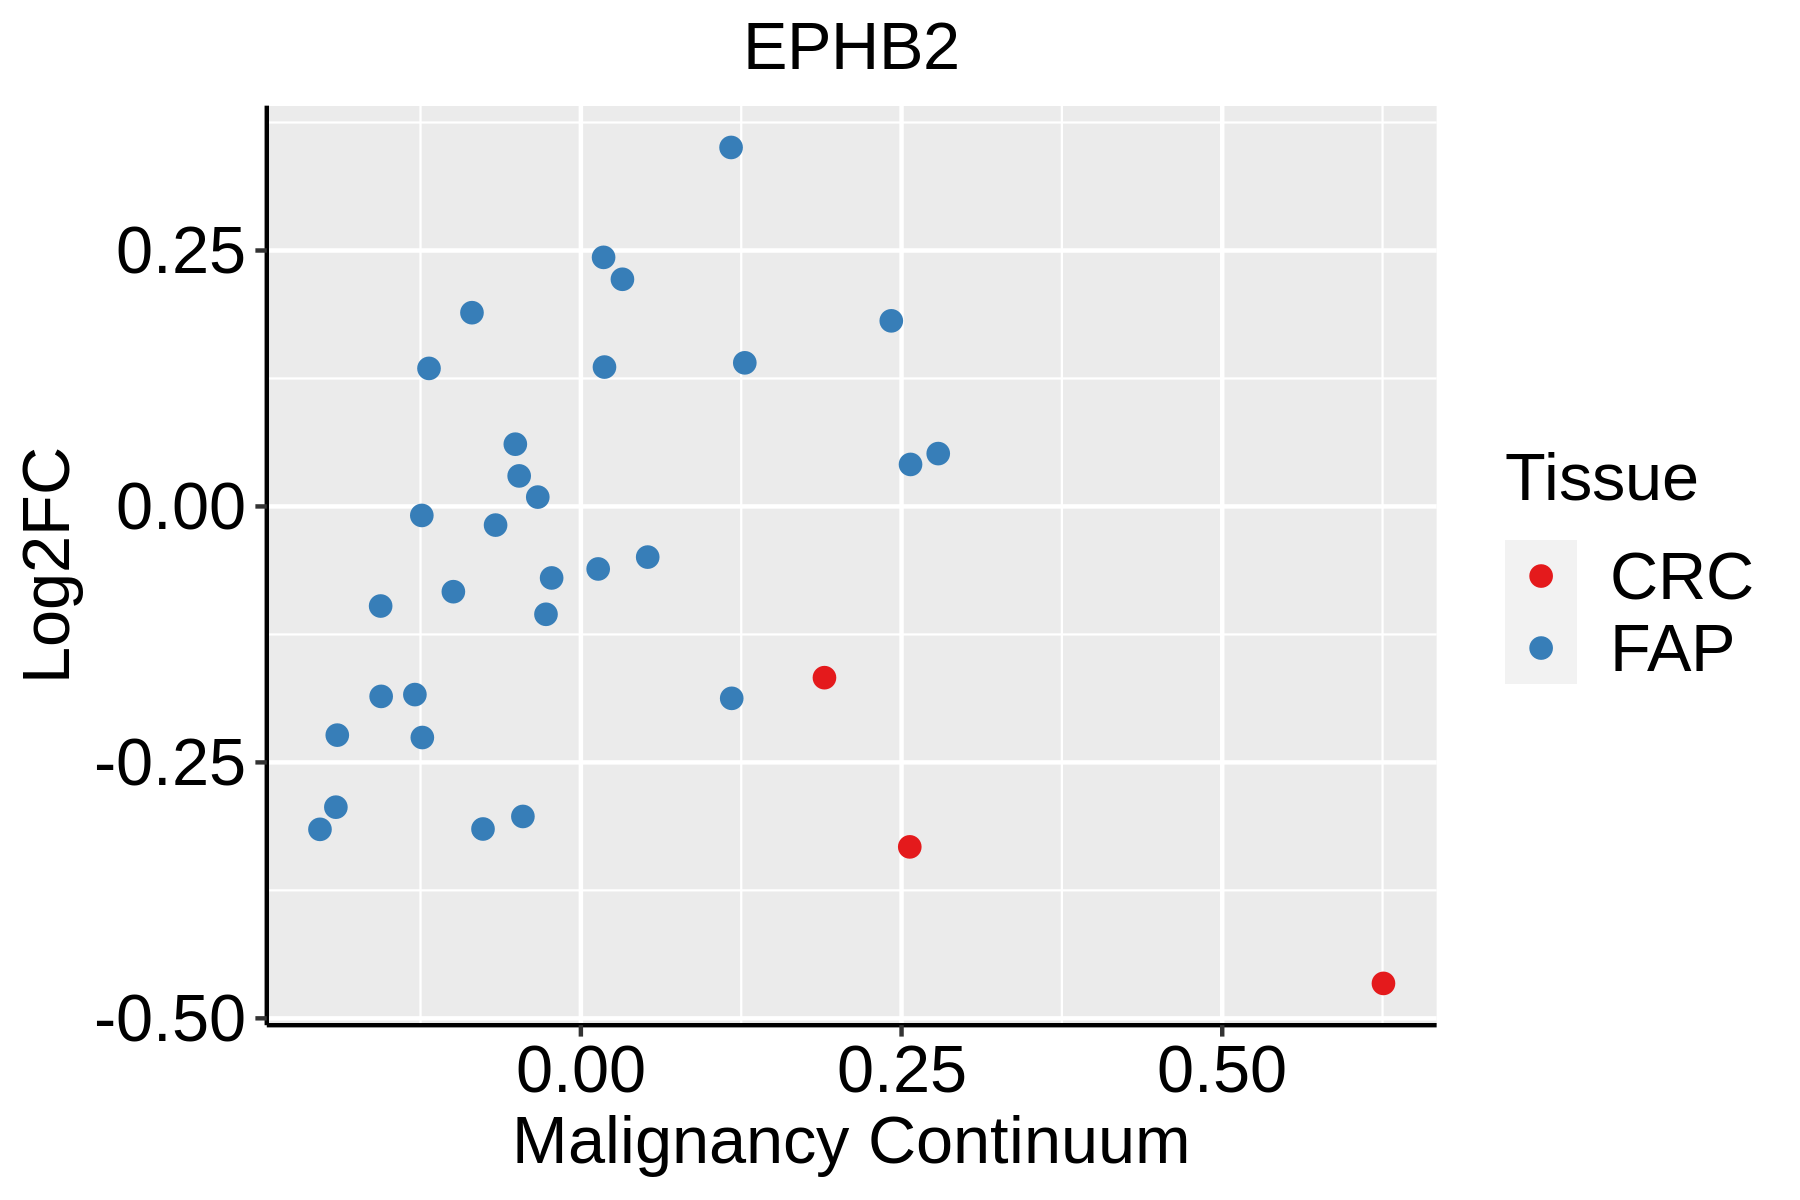 | FAP: Familial adenomatous polyposis |
| CRC: Colorectal cancer | ||
| Colorectum (HTA11) |  | AD: Adenomas |
| SER: Sessile serrated lesions | ||
| MSI-H: Microsatellite-high colorectal cancer | ||
| MSS: Microsatellite stable colorectal cancer | ||
| Esophagus |  | ESCC: Esophageal squamous cell carcinoma |
| HGIN: High-grade intraepithelial neoplasias | ||
| LGIN: Low-grade intraepithelial neoplasias | ||
| Liver | 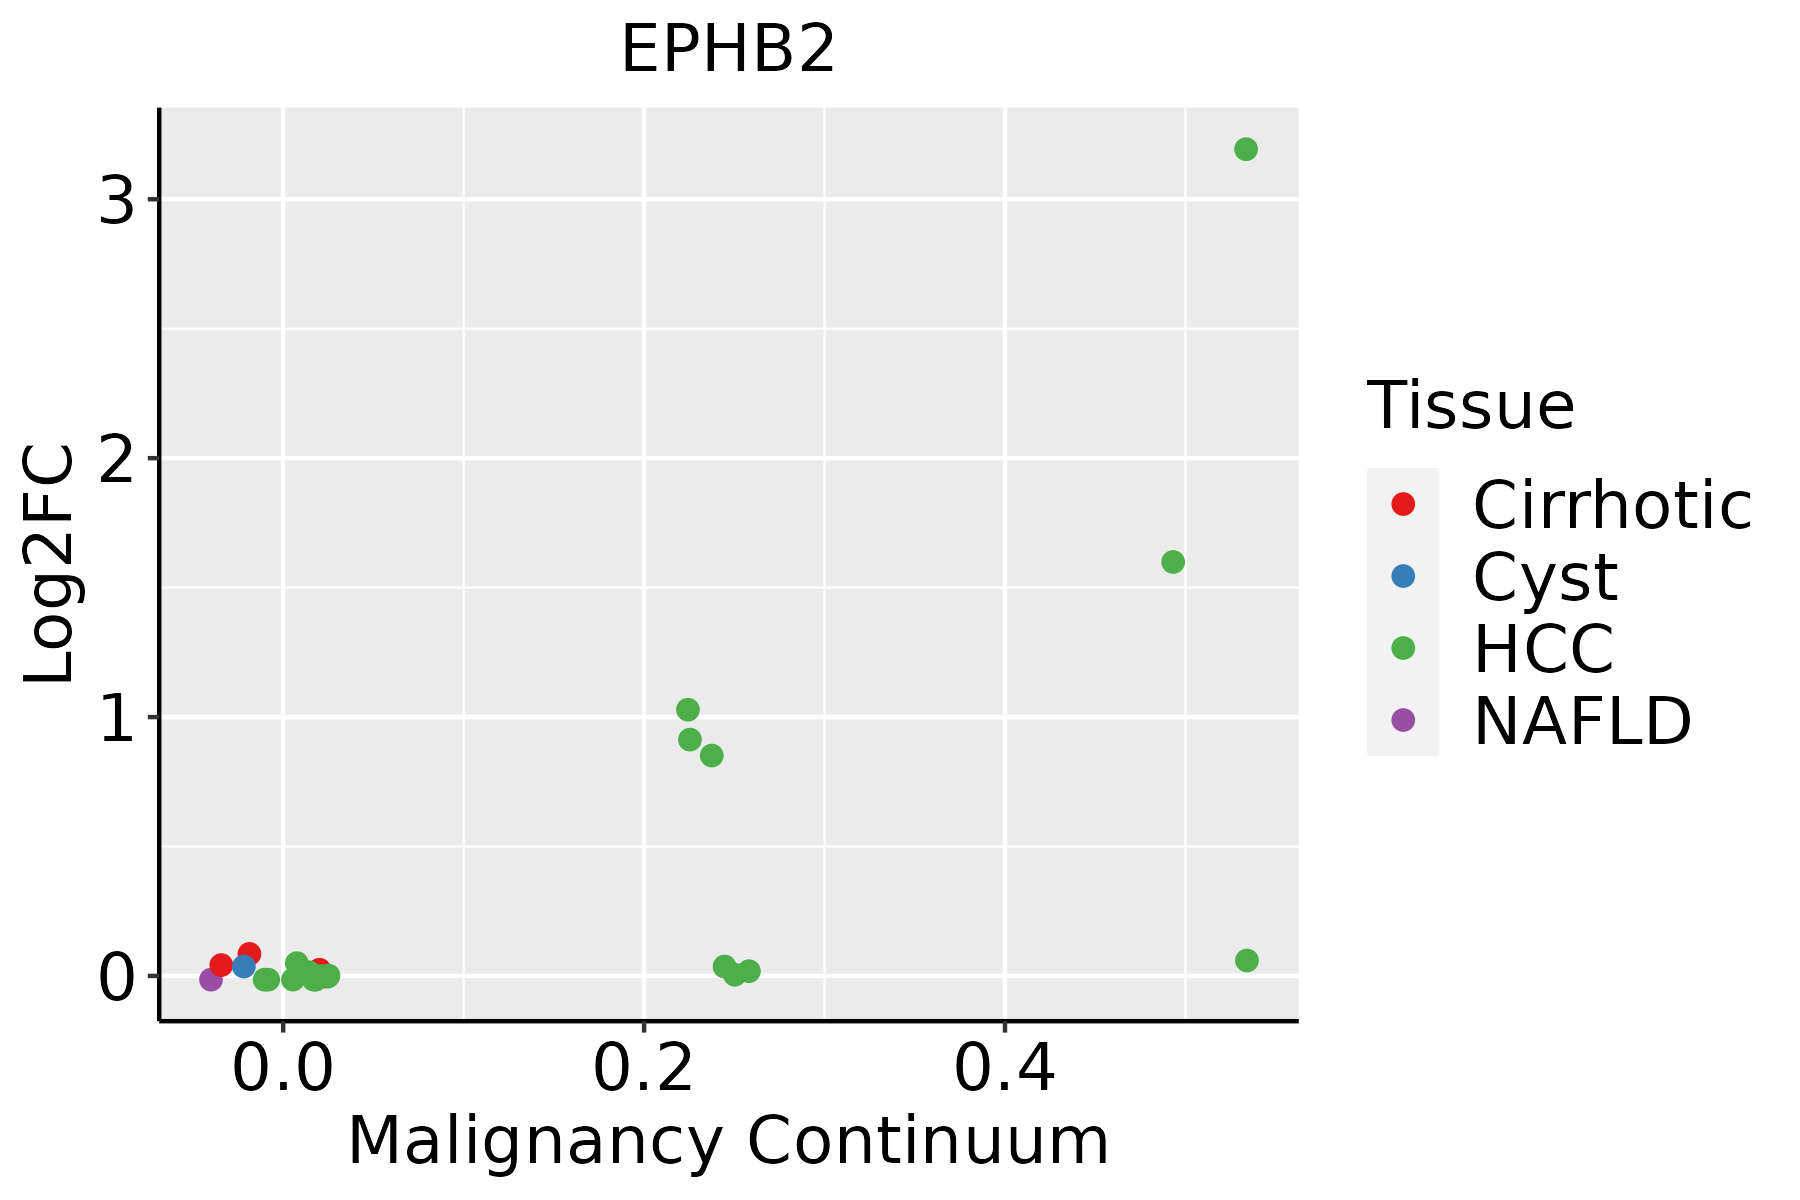 | HCC: Hepatocellular carcinoma |
| NAFLD: Non-alcoholic fatty liver disease | ||
| Oral Cavity | 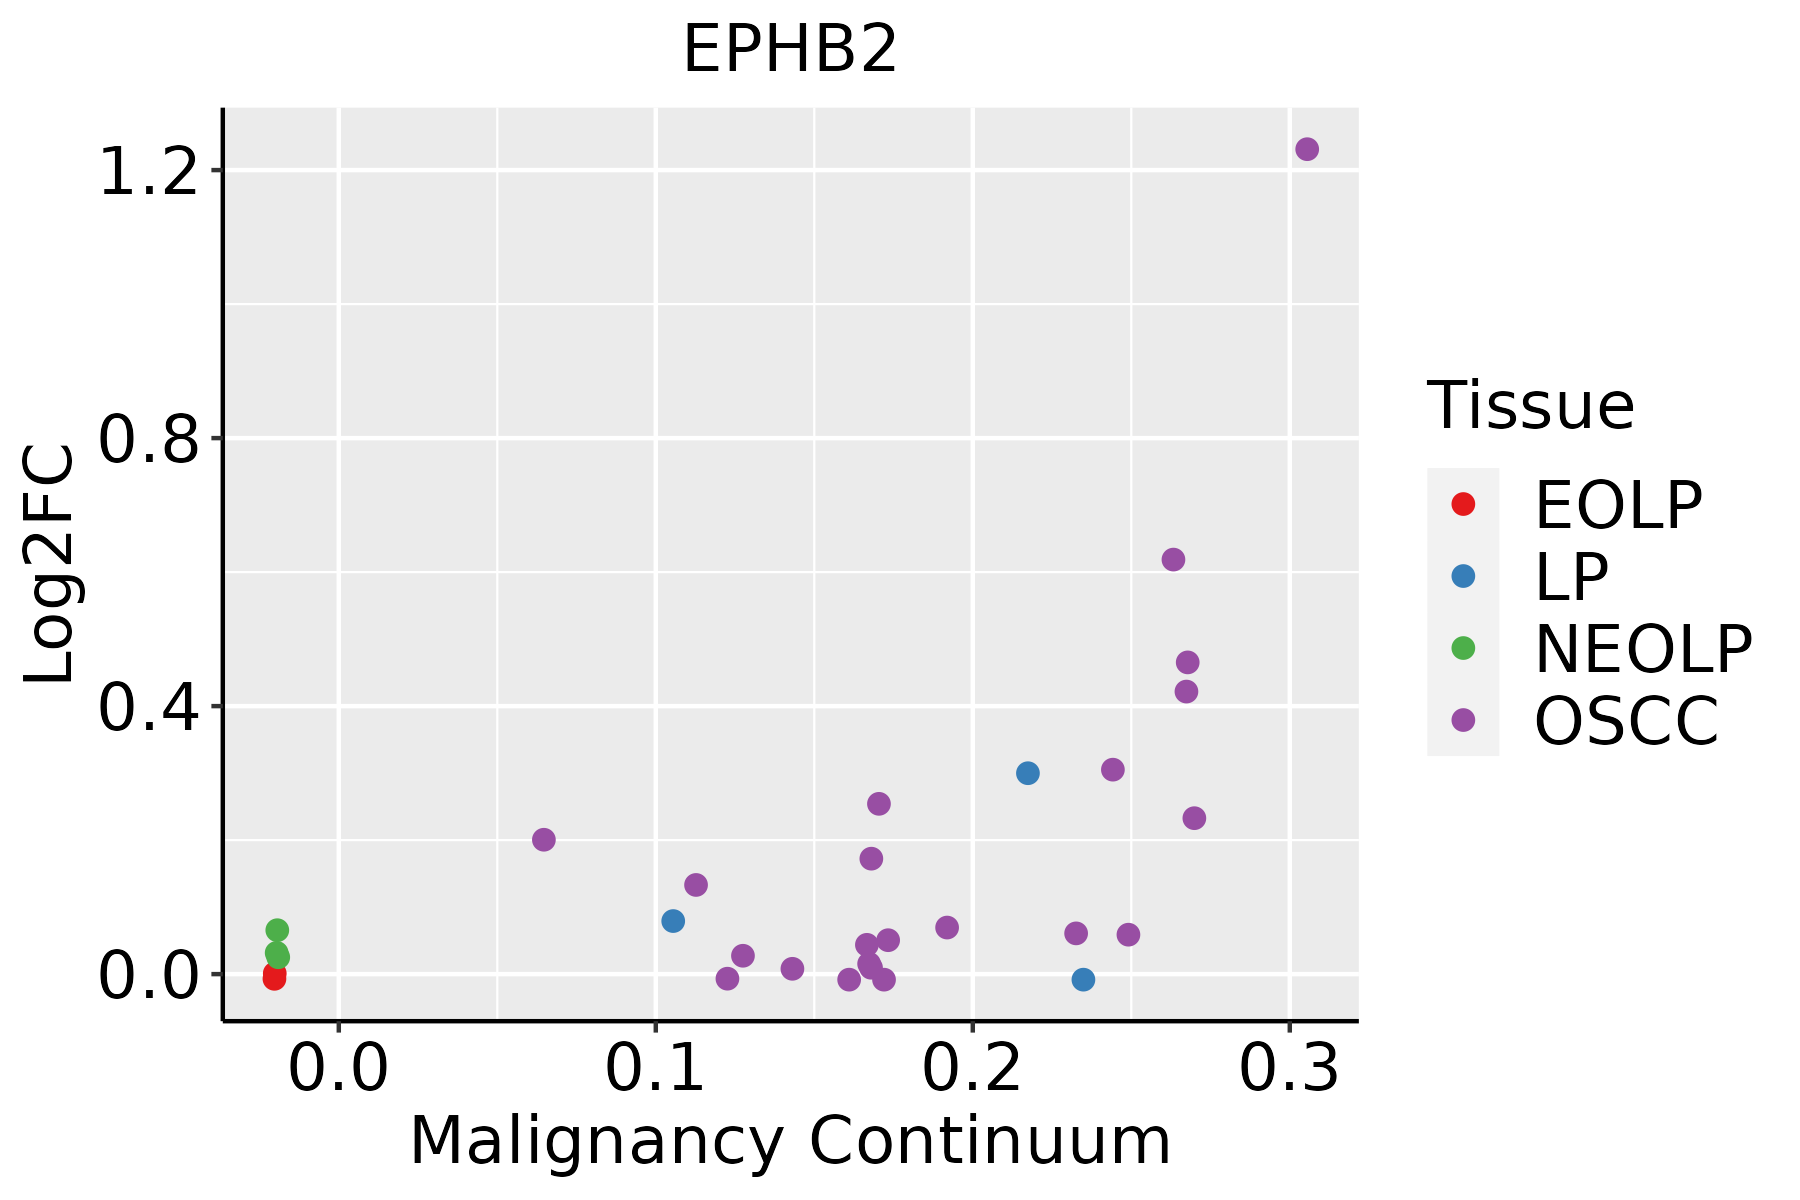 | EOLP: Erosive Oral lichen planus |
| LP: leukoplakia | ||
| NEOLP: Non-erosive oral lichen planus | ||
| OSCC: Oral squamous cell carcinoma | ||
| Thyroid | 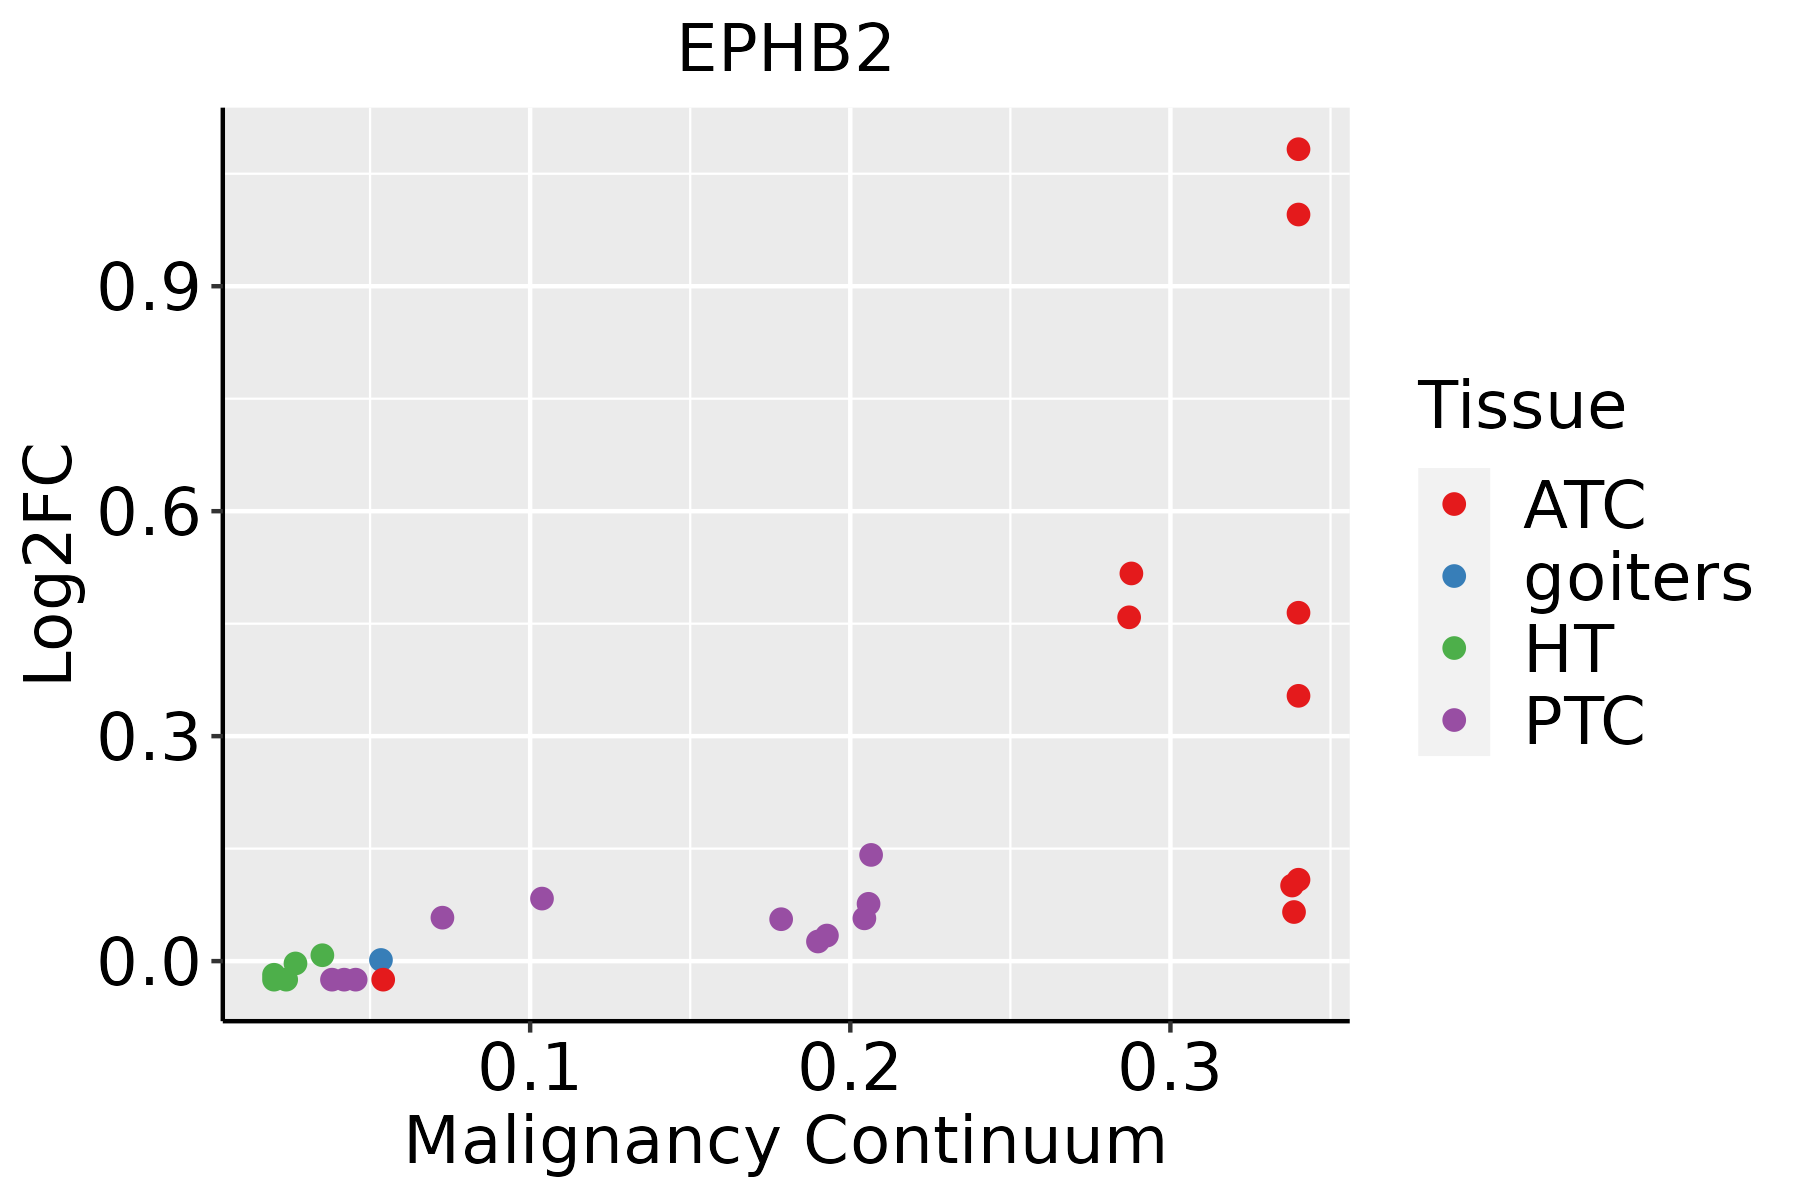 | ATC: Anaplastic thyroid cancer |
| HT: Hashimoto's thyroiditis | ||
| PTC: Papillary thyroid cancer |
| ∗log2FC in expression of this searched gene in stem-like cells from each diseased tissue sample relative to stem-like cells in normal samples in each tissue plotted against the malignancy continuum. Samples are colored based on if they are from different disease stage. |
Top |
Malignant transformation related pathway analysis |
| Find out the enriched GO biological processes and KEGG pathways involved in transition from healthy to precancer to cancer |
| Tissue | Disease Stage | Enriched GO biological Processes |
| Colorectum | AD |  |
| Colorectum | SER |  |
| Colorectum | MSS |  |
| Colorectum | MSI-H |  |
| Colorectum | FAP |  |
| ∗Top 15 enriched GO BP terms are showed in the bar plot of each disease state in each tissue. Each row represents a significant GO biological process which is colored according to the -log10(p.adjust). |
| Page: 1 2 3 4 5 6 7 8 9 |
| GO ID | Tissue | Disease Stage | Description | Gene Ratio | Bg Ratio | pvalue | p.adjust | Count |
| GO:0072659 | Colorectum | AD | protein localization to plasma membrane | 122/3918 | 284/18723 | 2.86e-17 | 1.49e-14 | 122 |
| GO:1990778 | Colorectum | AD | protein localization to cell periphery | 129/3918 | 333/18723 | 5.51e-14 | 1.15e-11 | 129 |
| GO:1903829 | Colorectum | AD | positive regulation of cellular protein localization | 110/3918 | 276/18723 | 4.58e-13 | 8.44e-11 | 110 |
| GO:1905475 | Colorectum | AD | regulation of protein localization to membrane | 73/3918 | 175/18723 | 3.37e-10 | 2.93e-08 | 73 |
| GO:1903076 | Colorectum | AD | regulation of protein localization to plasma membrane | 48/3918 | 104/18723 | 7.17e-09 | 4.36e-07 | 48 |
| GO:1904375 | Colorectum | AD | regulation of protein localization to cell periphery | 54/3918 | 125/18723 | 1.52e-08 | 9.00e-07 | 54 |
| GO:0034329 | Colorectum | AD | cell junction assembly | 136/3918 | 420/18723 | 2.02e-08 | 1.15e-06 | 136 |
| GO:1905477 | Colorectum | AD | positive regulation of protein localization to membrane | 46/3918 | 106/18723 | 1.47e-07 | 6.64e-06 | 46 |
| GO:0042060 | Colorectum | AD | wound healing | 128/3918 | 422/18723 | 2.73e-06 | 7.89e-05 | 128 |
| GO:0007265 | Colorectum | AD | Ras protein signal transduction | 104/3918 | 337/18723 | 1.01e-05 | 2.35e-04 | 104 |
| GO:0010563 | Colorectum | AD | negative regulation of phosphorus metabolic process | 130/3918 | 442/18723 | 1.26e-05 | 2.76e-04 | 130 |
| GO:1903078 | Colorectum | AD | positive regulation of protein localization to plasma membrane | 28/3918 | 62/18723 | 1.57e-05 | 3.34e-04 | 28 |
| GO:0045936 | Colorectum | AD | negative regulation of phosphate metabolic process | 129/3918 | 441/18723 | 1.81e-05 | 3.76e-04 | 129 |
| GO:0051056 | Colorectum | AD | regulation of small GTPase mediated signal transduction | 94/3918 | 302/18723 | 1.81e-05 | 3.76e-04 | 94 |
| GO:1904377 | Colorectum | AD | positive regulation of protein localization to cell periphery | 30/3918 | 69/18723 | 1.98e-05 | 4.05e-04 | 30 |
| GO:0051348 | Colorectum | AD | negative regulation of transferase activity | 85/3918 | 268/18723 | 2.07e-05 | 4.19e-04 | 85 |
| GO:0010975 | Colorectum | AD | regulation of neuron projection development | 129/3918 | 445/18723 | 2.88e-05 | 5.37e-04 | 129 |
| GO:0007409 | Colorectum | AD | axonogenesis | 122/3918 | 418/18723 | 3.36e-05 | 6.15e-04 | 122 |
| GO:0106027 | Colorectum | AD | neuron projection organization | 36/3918 | 93/18723 | 6.58e-05 | 1.07e-03 | 36 |
| GO:0042326 | Colorectum | AD | negative regulation of phosphorylation | 112/3918 | 385/18723 | 8.02e-05 | 1.27e-03 | 112 |
| Page: 1 2 3 4 5 6 7 8 9 10 11 12 13 14 15 16 17 18 19 20 21 22 23 24 25 26 27 28 29 |
| Pathway ID | Tissue | Disease Stage | Description | Gene Ratio | Bg Ratio | pvalue | p.adjust | qvalue | Count |
| hsa04360 | Colorectum | AD | Axon guidance | 61/2092 | 182/8465 | 4.36e-03 | 2.17e-02 | 1.38e-02 | 61 |
| hsa043601 | Colorectum | AD | Axon guidance | 61/2092 | 182/8465 | 4.36e-03 | 2.17e-02 | 1.38e-02 | 61 |
| hsa043602 | Colorectum | MSS | Axon guidance | 54/1875 | 182/8465 | 1.03e-02 | 3.69e-02 | 2.26e-02 | 54 |
| hsa043603 | Colorectum | MSS | Axon guidance | 54/1875 | 182/8465 | 1.03e-02 | 3.69e-02 | 2.26e-02 | 54 |
| hsa043604 | Colorectum | FAP | Axon guidance | 47/1404 | 182/8465 | 9.09e-04 | 5.20e-03 | 3.16e-03 | 47 |
| hsa043605 | Colorectum | FAP | Axon guidance | 47/1404 | 182/8465 | 9.09e-04 | 5.20e-03 | 3.16e-03 | 47 |
| hsa043606 | Colorectum | CRC | Axon guidance | 43/1091 | 182/8465 | 4.38e-05 | 8.70e-04 | 5.90e-04 | 43 |
| hsa043607 | Colorectum | CRC | Axon guidance | 43/1091 | 182/8465 | 4.38e-05 | 8.70e-04 | 5.90e-04 | 43 |
| hsa0436016 | Esophagus | ESCC | Axon guidance | 108/4205 | 182/8465 | 5.13e-03 | 1.30e-02 | 6.67e-03 | 108 |
| hsa0436017 | Esophagus | ESCC | Axon guidance | 108/4205 | 182/8465 | 5.13e-03 | 1.30e-02 | 6.67e-03 | 108 |
| hsa0436014 | Oral cavity | OSCC | Axon guidance | 97/3704 | 182/8465 | 5.59e-03 | 1.33e-02 | 6.76e-03 | 97 |
| hsa0436015 | Oral cavity | OSCC | Axon guidance | 97/3704 | 182/8465 | 5.59e-03 | 1.33e-02 | 6.76e-03 | 97 |
| Page: 1 |
Top |
Cell-cell communication analysis |
| Identification of potential cell-cell interactions between two cell types and their ligand-receptor pairs for different disease states |
| Ligand | Receptor | LRpair | Pathway | Tissue | Disease Stage |
| EFNA5 | EPHB2 | EFNA5_EPHB2 | EPHA | Cervix | CC |
| EFNB1 | EPHB2 | EFNB1_EPHB2 | EPHB | Cervix | CC |
| EFNB2 | EPHB2 | EFNB2_EPHB2 | EPHB | Cervix | CC |
| EFNB1 | EPHB2 | EFNB1_EPHB2 | EPHB | CRC | AD |
| EFNB2 | EPHB2 | EFNB2_EPHB2 | EPHB | CRC | AD |
| EFNA5 | EPHB2 | EFNA5_EPHB2 | EPHA | CRC | AD |
| EFNA5 | EPHB2 | EFNA5_EPHB2 | EPHA | CRC | ADJ |
| EFNB1 | EPHB2 | EFNB1_EPHB2 | EPHB | CRC | ADJ |
| EFNB2 | EPHB2 | EFNB2_EPHB2 | EPHB | CRC | ADJ |
| EFNA5 | EPHB2 | EFNA5_EPHB2 | EPHA | CRC | CRC |
| EFNB2 | EPHB2 | EFNB2_EPHB2 | EPHB | CRC | CRC |
| EFNA5 | EPHB2 | EFNA5_EPHB2 | EPHA | CRC | FAP |
| EFNB2 | EPHB2 | EFNB2_EPHB2 | EPHB | CRC | FAP |
| EFNA5 | EPHB2 | EFNA5_EPHB2 | EPHA | CRC | Healthy |
| EFNB2 | EPHB2 | EFNB2_EPHB2 | EPHB | CRC | Healthy |
| EFNA5 | EPHB2 | EFNA5_EPHB2 | EPHA | CRC | MSI-H |
| EFNB1 | EPHB2 | EFNB1_EPHB2 | EPHB | CRC | MSI-H |
| EFNB2 | EPHB2 | EFNB2_EPHB2 | EPHB | CRC | MSI-H |
| EFNB1 | EPHB2 | EFNB1_EPHB2 | EPHB | CRC | MSS |
| EFNB2 | EPHB2 | EFNB2_EPHB2 | EPHB | CRC | MSS |
| Page: 1 |
Top |
Single-cell gene regulatory network inference analysis |
| Find out the significant the regulons (TFs) and the target genes of each regulon across cell types for different disease states |
| TF | Cell Type | Tissue | Disease Stage | Target Gene | RSS | Regulon Activity |
| ∗The dot plots of a searched regulon are shown for all cell subpopulations in each disease state of each tissue based on the regulon specific score inferred using pySCENIC and by calculating the average expression. |
| Page: 1 |
Top |
Somatic mutation of malignant transformation related genes |
| Annotation of somatic variants for genes involved in malignant transformation |
| Hugo Symbol | Variant Class | Variant Classification | dbSNP RS | HGVSc | HGVSp | HGVSp Short | SWISSPROT | BIOTYPE | SIFT | PolyPhen | Tumor Sample Barcode | Tissue | Histology | Sex | Age | Stage | Therapy Types | Drugs | Outcome |
| EPHB2 | SNV | Missense_Mutation | c.2517N>G | p.Ile839Met | p.I839M | P29323 | protein_coding | deleterious(0.01) | probably_damaging(0.943) | TCGA-A7-A13D-01 | Breast | breast invasive carcinoma | Female | <65 | I/II | Chemotherapy | cytoxan | SD | |
| EPHB2 | SNV | Missense_Mutation | c.2105N>A | p.Met702Lys | p.M702K | P29323 | protein_coding | deleterious(0) | probably_damaging(0.999) | TCGA-A8-A06P-01 | Breast | breast invasive carcinoma | Female | <65 | III/IV | Unspecific | SD | ||
| EPHB2 | SNV | Missense_Mutation | novel | c.1955N>C | p.Ile652Thr | p.I652T | P29323 | protein_coding | deleterious(0) | probably_damaging(1) | TCGA-A8-A09D-01 | Breast | breast invasive carcinoma | Female | <65 | I/II | Chemotherapy | doxorubicin | CR |
| EPHB2 | SNV | Missense_Mutation | c.2665A>G | p.Ser889Gly | p.S889G | P29323 | protein_coding | deleterious(0.01) | benign(0.371) | TCGA-AR-A24Q-01 | Breast | breast invasive carcinoma | Female | <65 | I/II | Chemotherapy | doxorubicin | SD | |
| EPHB2 | SNV | Missense_Mutation | c.1627C>T | p.Leu543Phe | p.L543F | P29323 | protein_coding | deleterious(0.03) | benign(0.02) | TCGA-B6-A0RH-01 | Breast | breast invasive carcinoma | Female | <65 | I/II | Unknown | Unknown | PD | |
| EPHB2 | SNV | Missense_Mutation | c.1549N>A | p.Gly517Arg | p.G517R | P29323 | protein_coding | deleterious(0) | probably_damaging(0.981) | TCGA-D8-A1XK-01 | Breast | breast invasive carcinoma | Female | <65 | I/II | Chemotherapy | doxorubicine+cyclophosphamide | SD | |
| EPHB2 | SNV | Missense_Mutation | novel | c.293G>T | p.Ser98Ile | p.S98I | P29323 | protein_coding | deleterious(0) | possibly_damaging(0.821) | TCGA-GM-A2DD-01 | Breast | breast invasive carcinoma | Female | <65 | I/II | Chemotherapy | fluorouracil | CR |
| EPHB2 | SNV | Missense_Mutation | novel | c.1913N>A | p.Gly638Asp | p.G638D | P29323 | protein_coding | deleterious(0) | probably_damaging(0.999) | TCGA-V7-A7HQ-01 | Breast | breast invasive carcinoma | Female | >=65 | III/IV | Hormone Therapy | letrozole | CR |
| EPHB2 | SNV | Missense_Mutation | novel | c.200C>T | p.Ser67Leu | p.S67L | P29323 | protein_coding | deleterious(0.03) | benign(0.013) | TCGA-2W-A8YY-01 | Cervix | cervical & endocervical cancer | Female | <65 | I/II | Chemotherapy | cisplatin | CR |
| EPHB2 | SNV | Missense_Mutation | novel | c.1136T>C | p.Val379Ala | p.V379A | P29323 | protein_coding | deleterious(0.03) | probably_damaging(0.967) | TCGA-2W-A8YY-01 | Cervix | cervical & endocervical cancer | Female | <65 | I/II | Chemotherapy | cisplatin | CR |
| Page: 1 2 3 4 5 6 7 8 9 10 11 |
Top |
Related drugs of malignant transformation related genes |
| Identification of chemicals and drugs interact with genes involved in malignant transfromation |
| (DGIdb 4.0) |
| Entrez ID | Symbol | Category | Interaction Types | Drug Claim Name | Drug Name | PMIDs |
| 2048 | EPHB2 | KINASE, CLINICALLY ACTIONABLE, TYROSINE KINASE, CELL SURFACE, DRUGGABLE GENOME, ENZYME | MK-8353 | MK-8353 | ||
| 2048 | EPHB2 | KINASE, CLINICALLY ACTIONABLE, TYROSINE KINASE, CELL SURFACE, DRUGGABLE GENOME, ENZYME | KO-947 | |||
| 2048 | EPHB2 | KINASE, CLINICALLY ACTIONABLE, TYROSINE KINASE, CELL SURFACE, DRUGGABLE GENOME, ENZYME | inhibitor | 249565821 | ||
| 2048 | EPHB2 | KINASE, CLINICALLY ACTIONABLE, TYROSINE KINASE, CELL SURFACE, DRUGGABLE GENOME, ENZYME | inhibitor | CHEMBL24828 | VANDETANIB | |
| 2048 | EPHB2 | KINASE, CLINICALLY ACTIONABLE, TYROSINE KINASE, CELL SURFACE, DRUGGABLE GENOME, ENZYME | BVD-523 | ULIXERTINIB | ||
| 2048 | EPHB2 | KINASE, CLINICALLY ACTIONABLE, TYROSINE KINASE, CELL SURFACE, DRUGGABLE GENOME, ENZYME | inhibitor | 384403668 | ||
| 2048 | EPHB2 | KINASE, CLINICALLY ACTIONABLE, TYROSINE KINASE, CELL SURFACE, DRUGGABLE GENOME, ENZYME | inhibitor | 381118815 |
| Page: 1 |

Copyright 2023-Present -The University of Texas Health Science Center at Houston |