
|
|||||
|
 | |
| |
| |
| |
| |
| |
|
Gene: EIF5A |
Gene summary for EIF5A |
| Gene information | Species | Human | Gene symbol | EIF5A | Gene ID | 1984 |
| Gene name | eukaryotic translation initiation factor 5A | |
| Gene Alias | EIF-5A | |
| Cytomap | 17p13.1 | |
| Gene Type | protein-coding | GO ID | GO:0006139 | UniProtAcc | P63241 |
Top |
Malignant transformation analysis |
| Identification of the aberrant gene expression in precancerous and cancerous lesions by comparing the gene expression of stem-like cells in diseased tissues with normal stem cells |
| Entrez ID | Symbol | Replicates | Species | Organ | Tissue | Adj P-value | Log2FC | Malignancy |
| 1984 | EIF5A | HTA11_9408_2000001011 | Human | Colorectum | AD | 1.97e-06 | 7.03e-01 | 0.0451 |
| 1984 | EIF5A | HTA11_8622_2000001021 | Human | Colorectum | SER | 9.19e-21 | 1.26e+00 | 0.0528 |
| 1984 | EIF5A | HTA11_7663_2000001011 | Human | Colorectum | SER | 2.25e-16 | 1.32e+00 | 0.0131 |
| 1984 | EIF5A | HTA11_10623_2000001011 | Human | Colorectum | AD | 1.96e-24 | 1.39e+00 | -0.0177 |
| 1984 | EIF5A | HTA11_6801_2000001011 | Human | Colorectum | SER | 5.06e-20 | 1.76e+00 | 0.0171 |
| 1984 | EIF5A | HTA11_10711_2000001011 | Human | Colorectum | AD | 1.24e-20 | 8.66e-01 | 0.0338 |
| 1984 | EIF5A | HTA11_7696_3000711011 | Human | Colorectum | AD | 1.47e-42 | 9.91e-01 | 0.0674 |
| 1984 | EIF5A | HTA11_6818_2000001011 | Human | Colorectum | AD | 1.05e-10 | 7.37e-01 | 0.0112 |
| 1984 | EIF5A | HTA11_7469_2000001011 | Human | Colorectum | AD | 4.18e-12 | 1.31e+00 | -0.0124 |
| 1984 | EIF5A | HTA11_6818_2000001021 | Human | Colorectum | AD | 6.01e-20 | 8.68e-01 | 0.0588 |
| 1984 | EIF5A | HTA11_99999970781_79442 | Human | Colorectum | MSS | 7.54e-65 | 1.61e+00 | 0.294 |
| 1984 | EIF5A | HTA11_99999965062_69753 | Human | Colorectum | MSI-H | 1.52e-18 | 2.84e+00 | 0.3487 |
| 1984 | EIF5A | HTA11_99999965104_69814 | Human | Colorectum | MSS | 1.71e-22 | 9.13e-01 | 0.281 |
| 1984 | EIF5A | HTA11_99999971662_82457 | Human | Colorectum | MSS | 1.58e-33 | 8.44e-01 | 0.3859 |
| 1984 | EIF5A | HTA11_99999973899_84307 | Human | Colorectum | MSS | 1.43e-10 | 7.49e-01 | 0.2585 |
| 1984 | EIF5A | HTA11_99999974143_84620 | Human | Colorectum | MSS | 4.87e-64 | 1.27e+00 | 0.3005 |
| 1984 | EIF5A | AEH-subject1 | Human | Endometrium | AEH | 6.88e-13 | -4.66e-01 | -0.3059 |
| 1984 | EIF5A | AEH-subject2 | Human | Endometrium | AEH | 1.64e-13 | -4.08e-01 | -0.2525 |
| 1984 | EIF5A | AEH-subject3 | Human | Endometrium | AEH | 1.28e-08 | -2.71e-01 | -0.2576 |
| 1984 | EIF5A | AEH-subject4 | Human | Endometrium | AEH | 3.58e-16 | -5.37e-01 | -0.2657 |
| Page: 1 2 3 4 5 6 7 8 9 10 11 12 13 14 |
| Tissue | Expression Dynamics | Abbreviation |
| Breast | 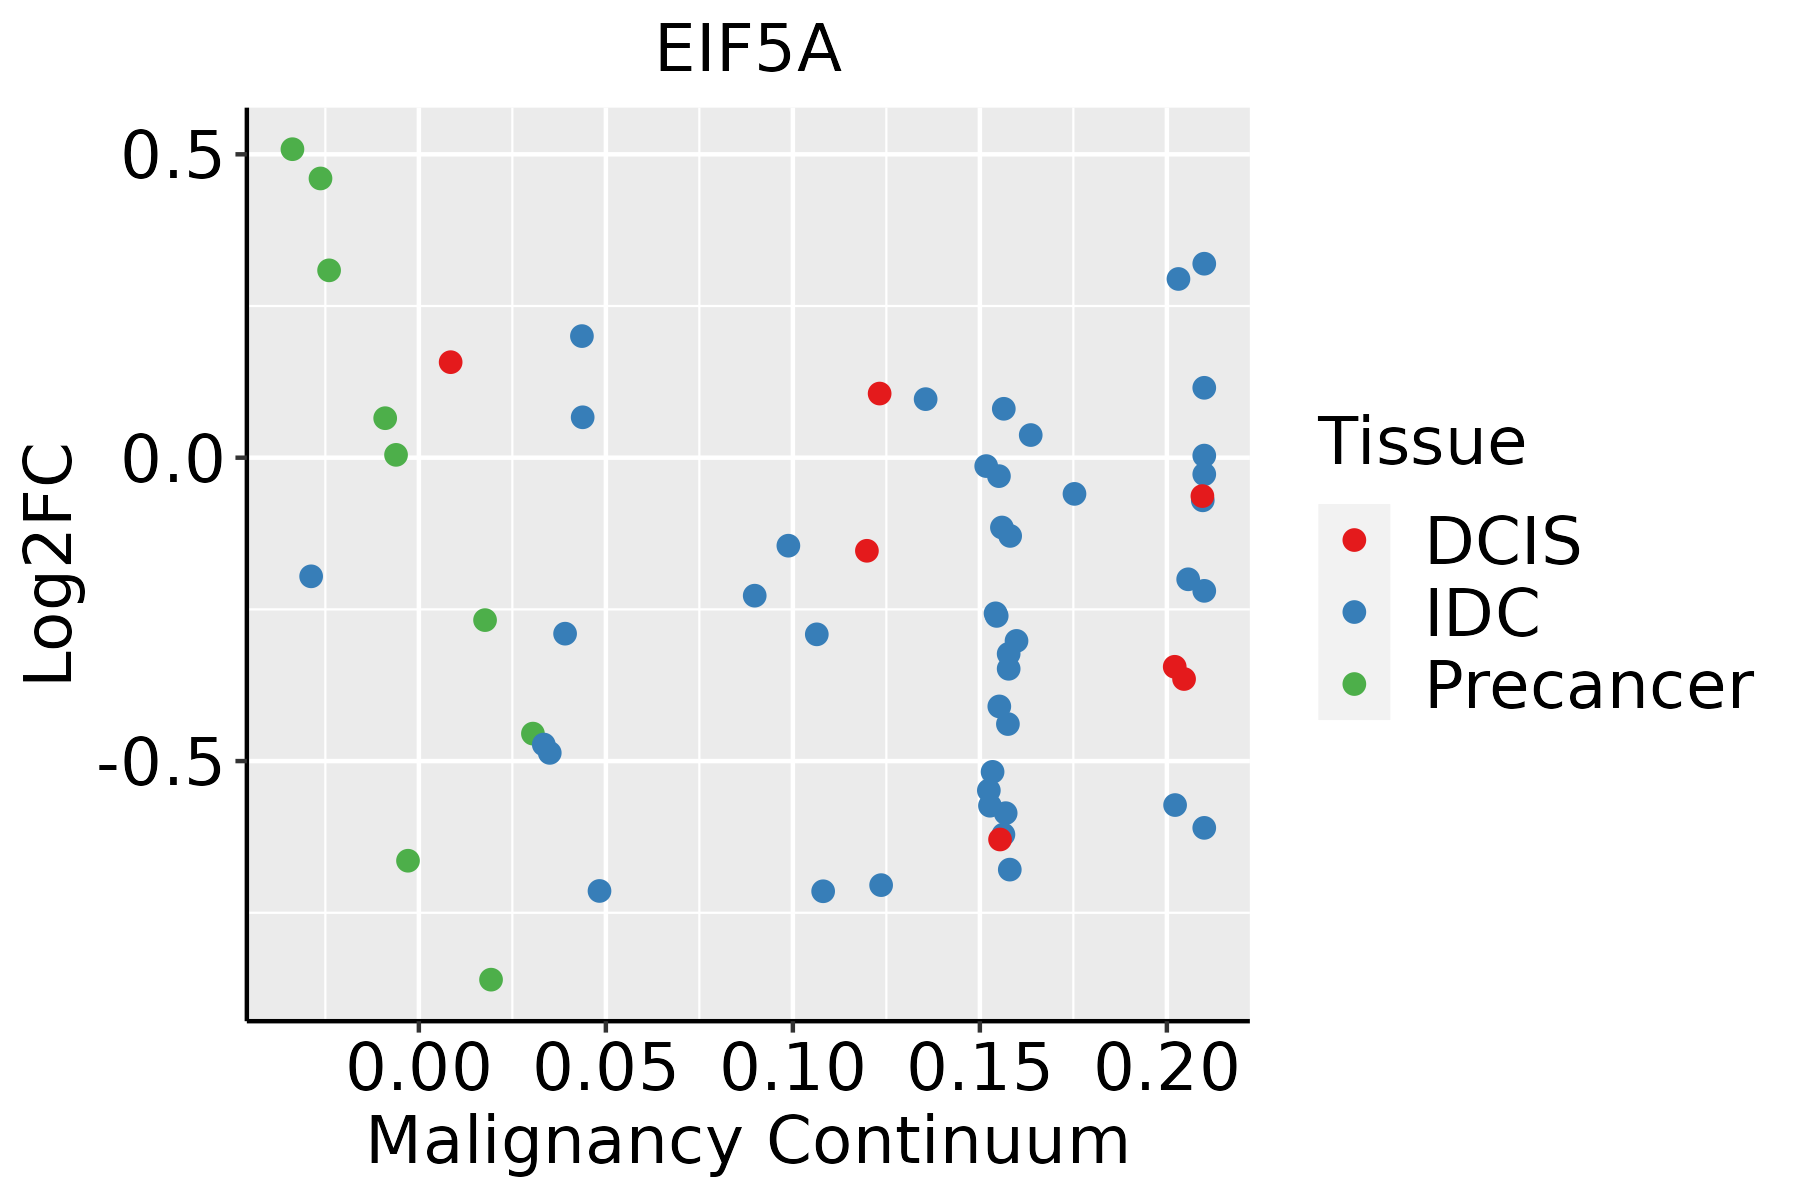 | IDC: Invasive ductal carcinoma |
| DCIS: Ductal carcinoma in situ | ||
| Precancer(BRCA1-mut): Precancerous lesion from BRCA1 mutation carriers | ||
| Cervix | 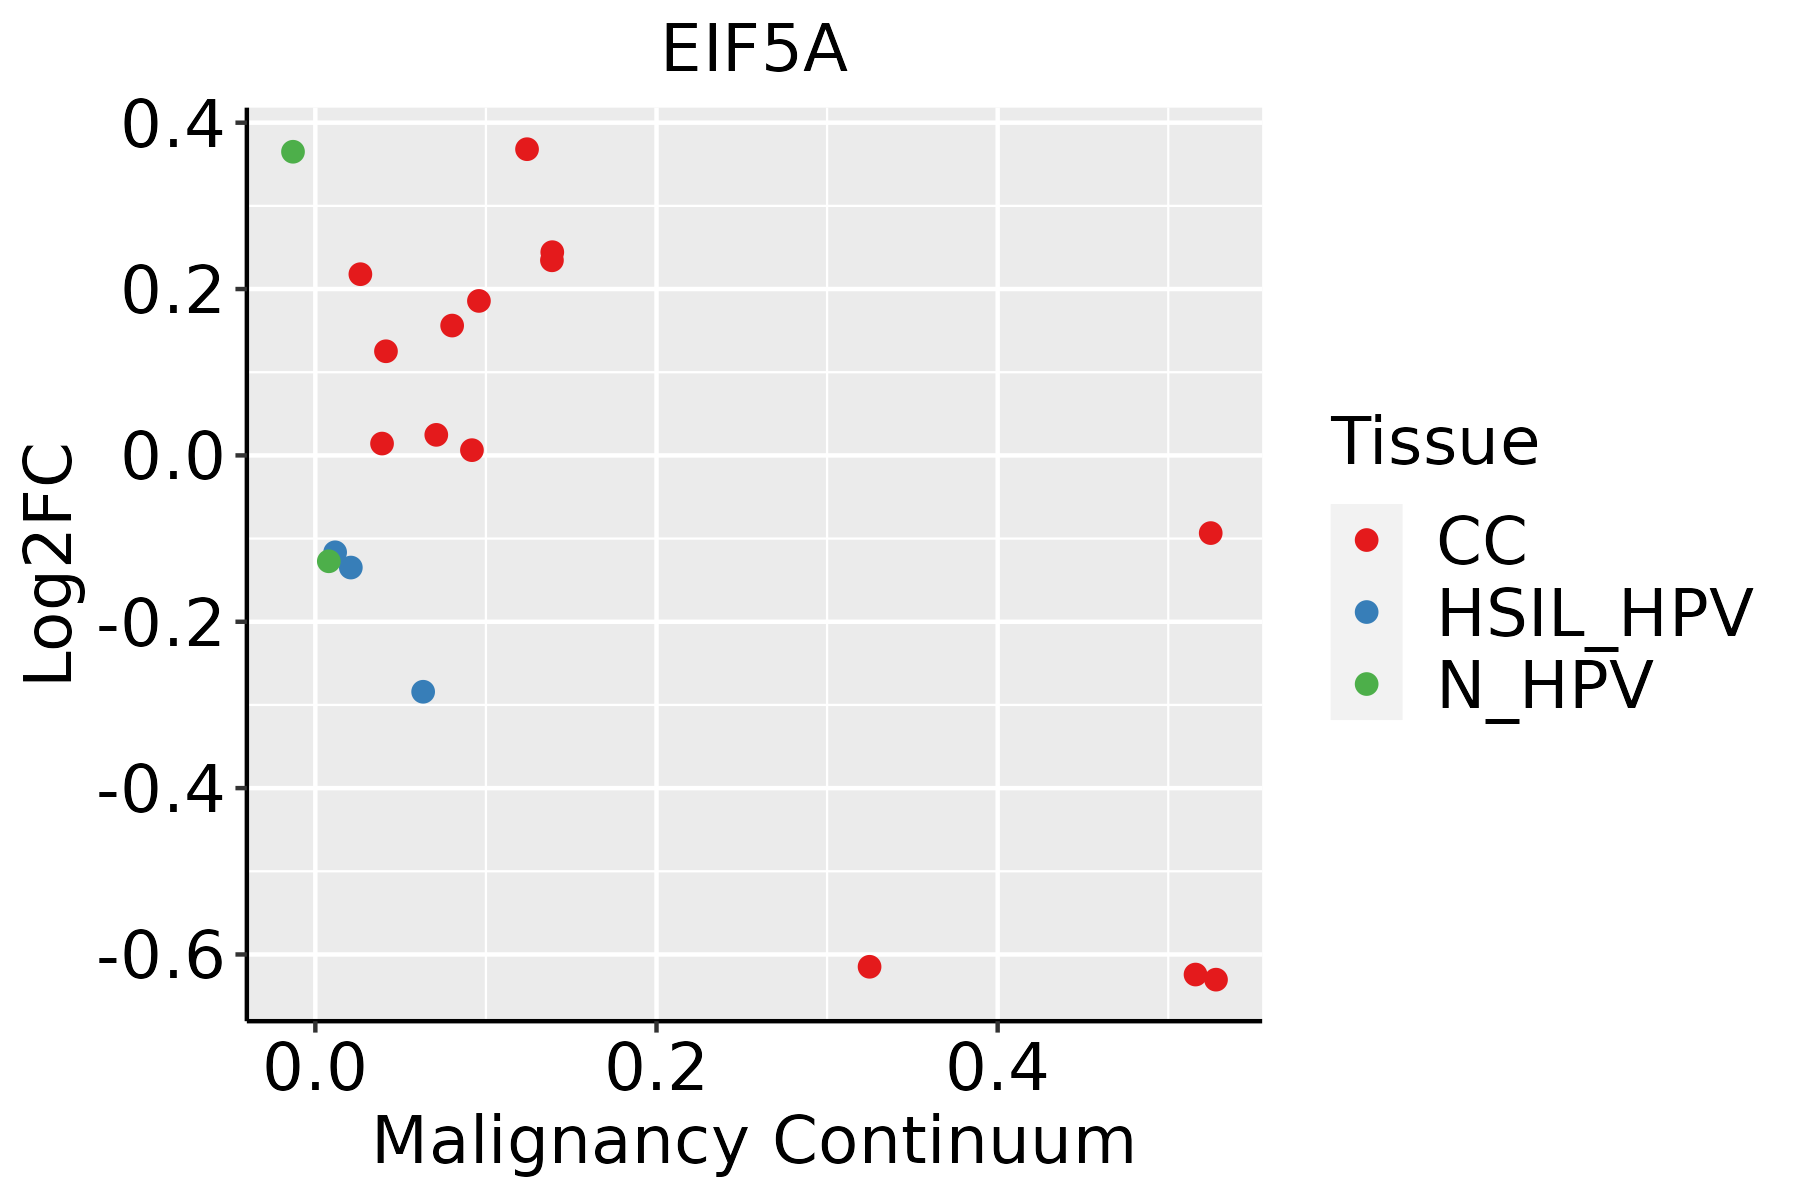 | CC: Cervix cancer |
| HSIL_HPV: HPV-infected high-grade squamous intraepithelial lesions | ||
| N_HPV: HPV-infected normal cervix | ||
| Colorectum (GSE201348) |  | FAP: Familial adenomatous polyposis |
| CRC: Colorectal cancer | ||
| Colorectum (HTA11) | 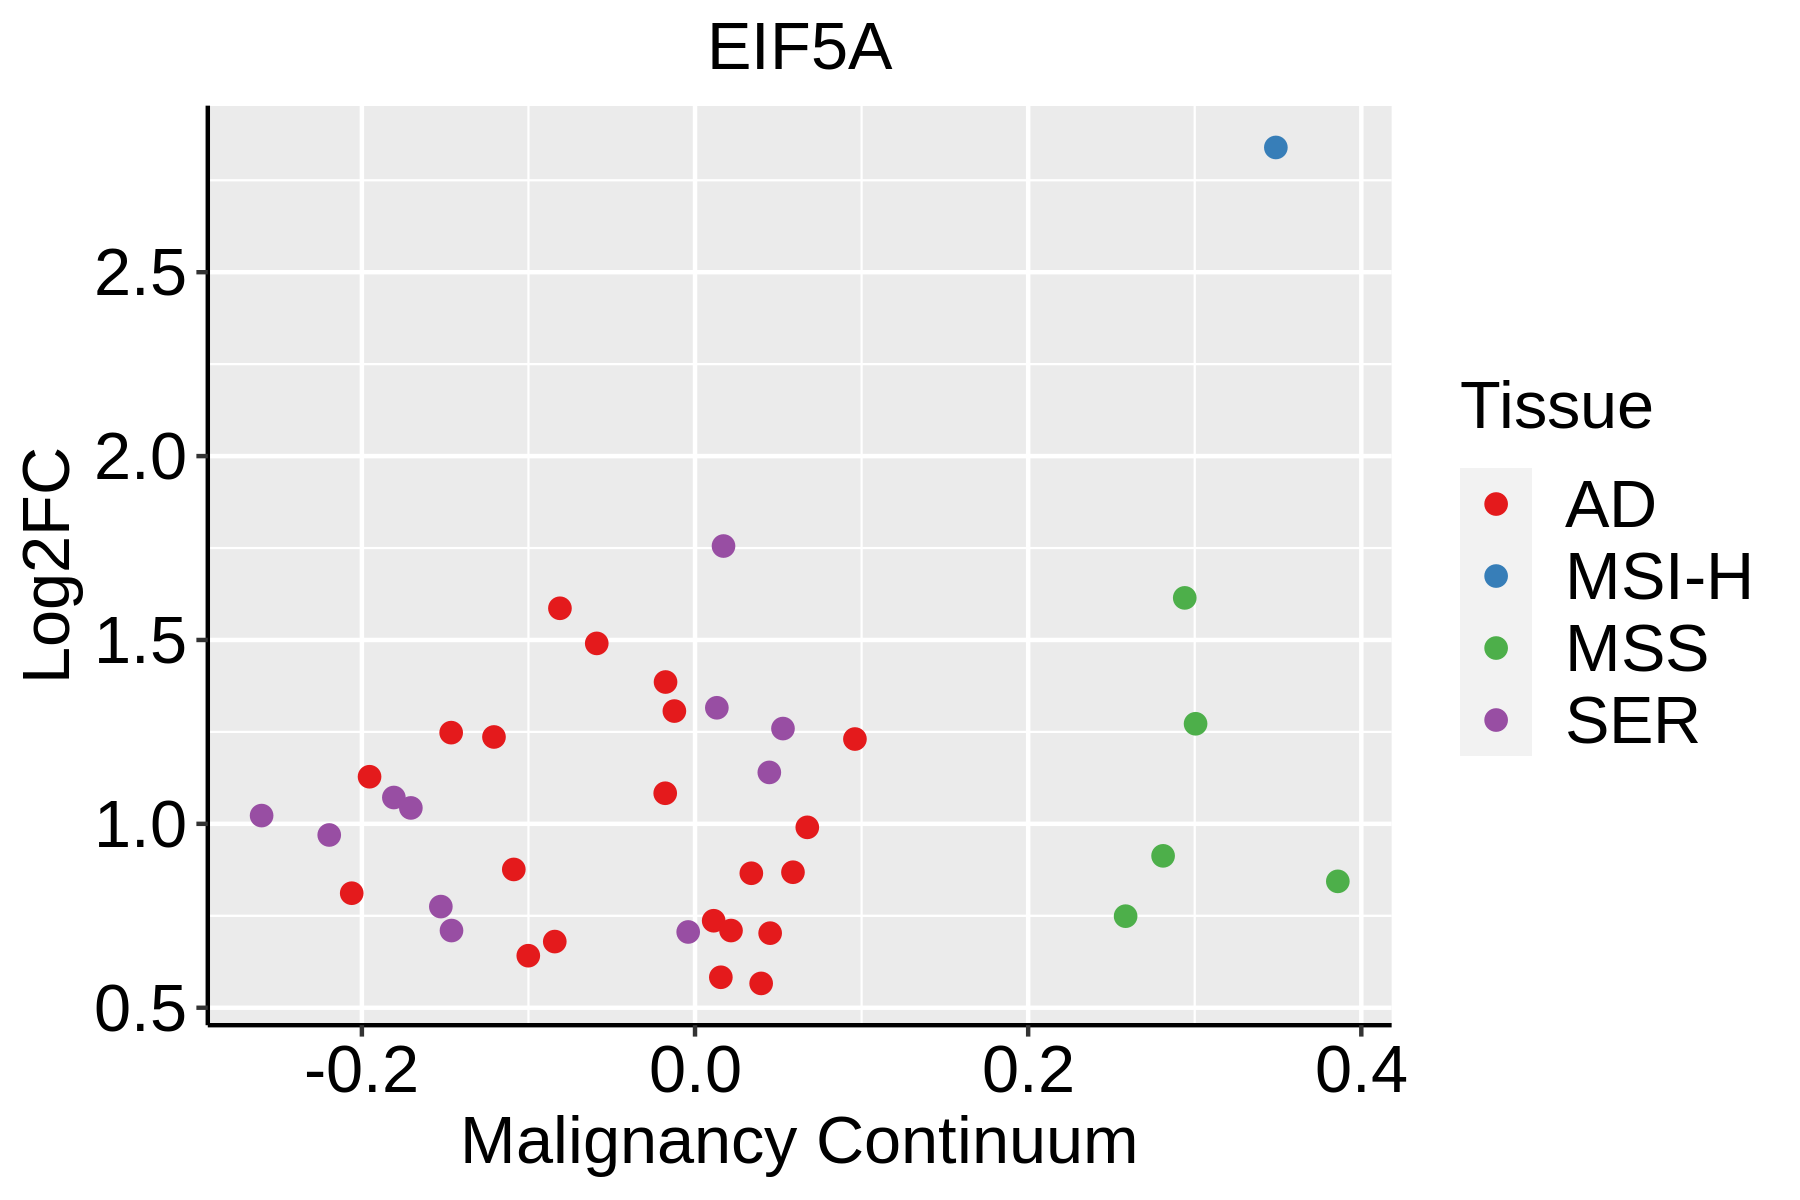 | AD: Adenomas |
| SER: Sessile serrated lesions | ||
| MSI-H: Microsatellite-high colorectal cancer | ||
| MSS: Microsatellite stable colorectal cancer | ||
| Endometrium | 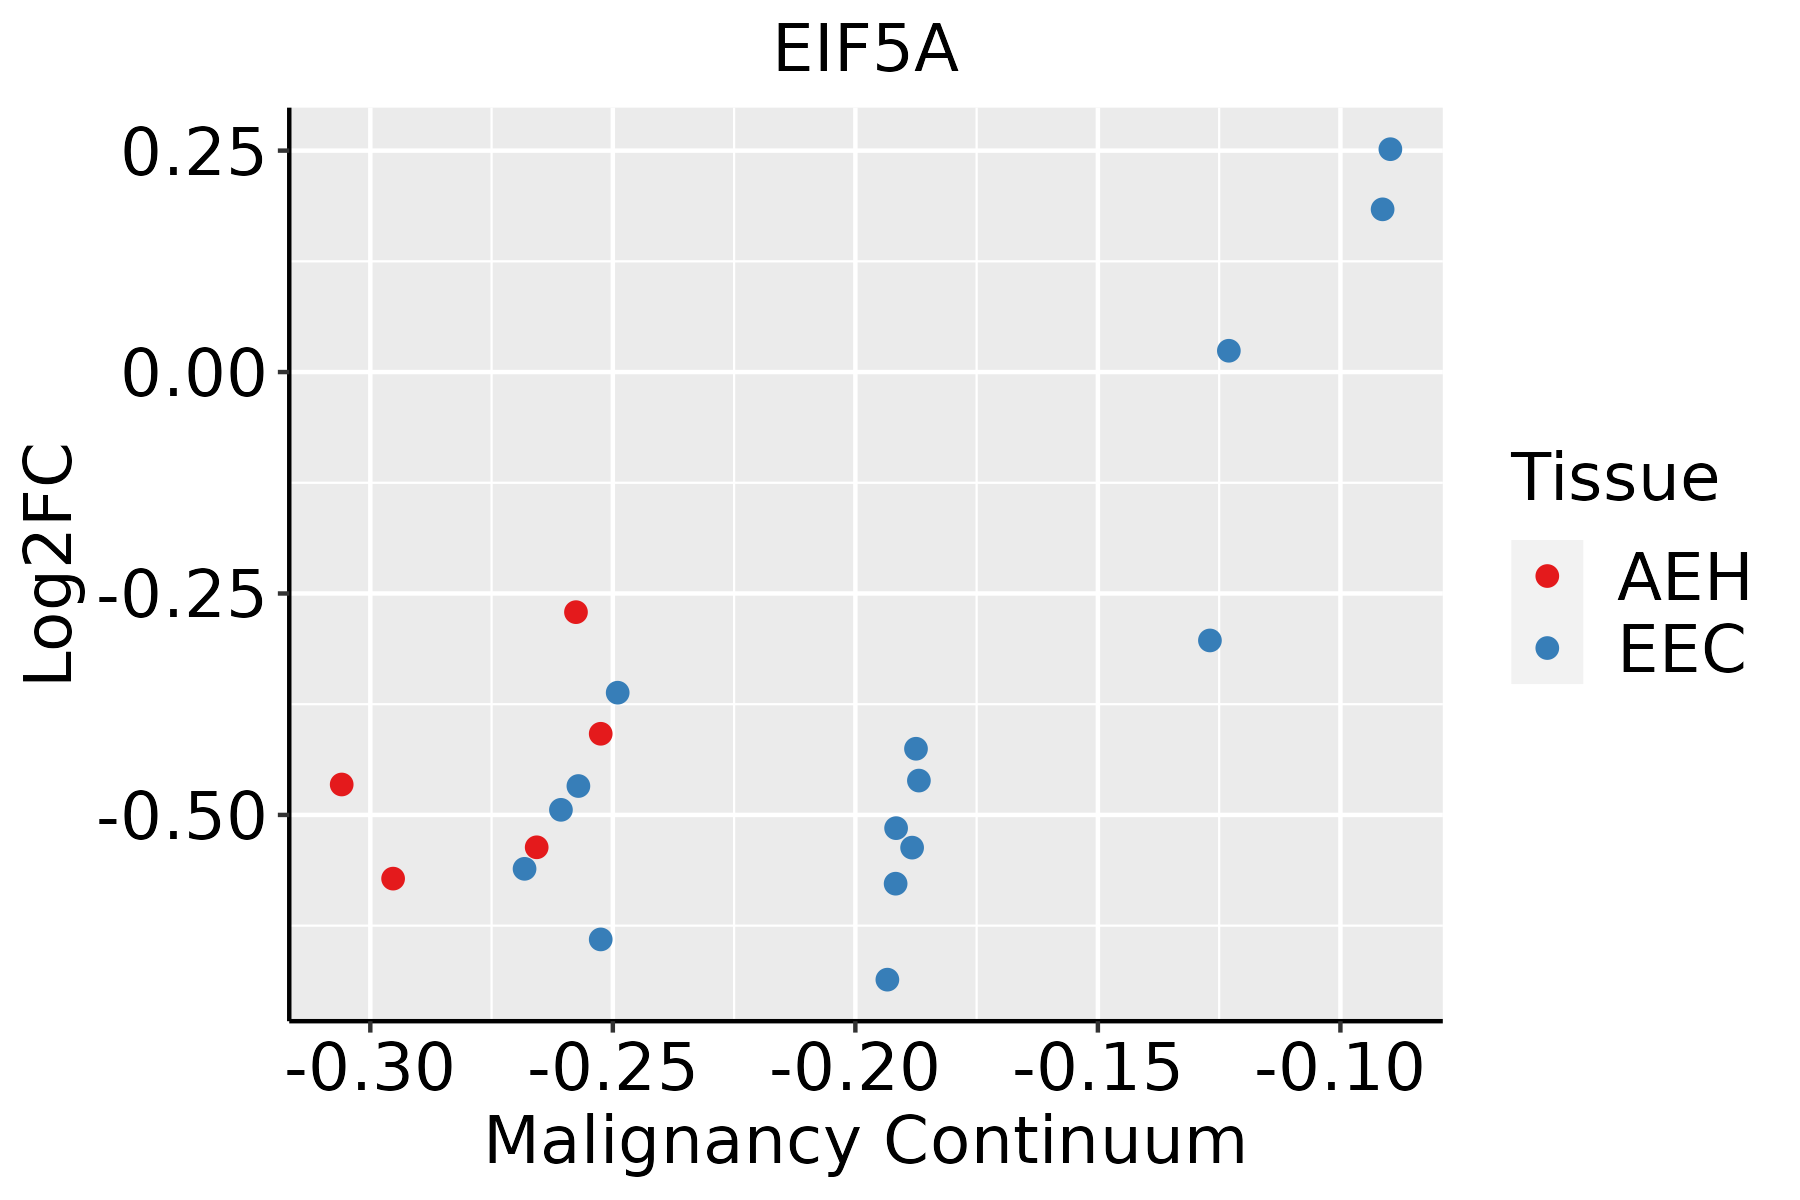 | AEH: Atypical endometrial hyperplasia |
| EEC: Endometrioid Cancer | ||
| Esophagus | 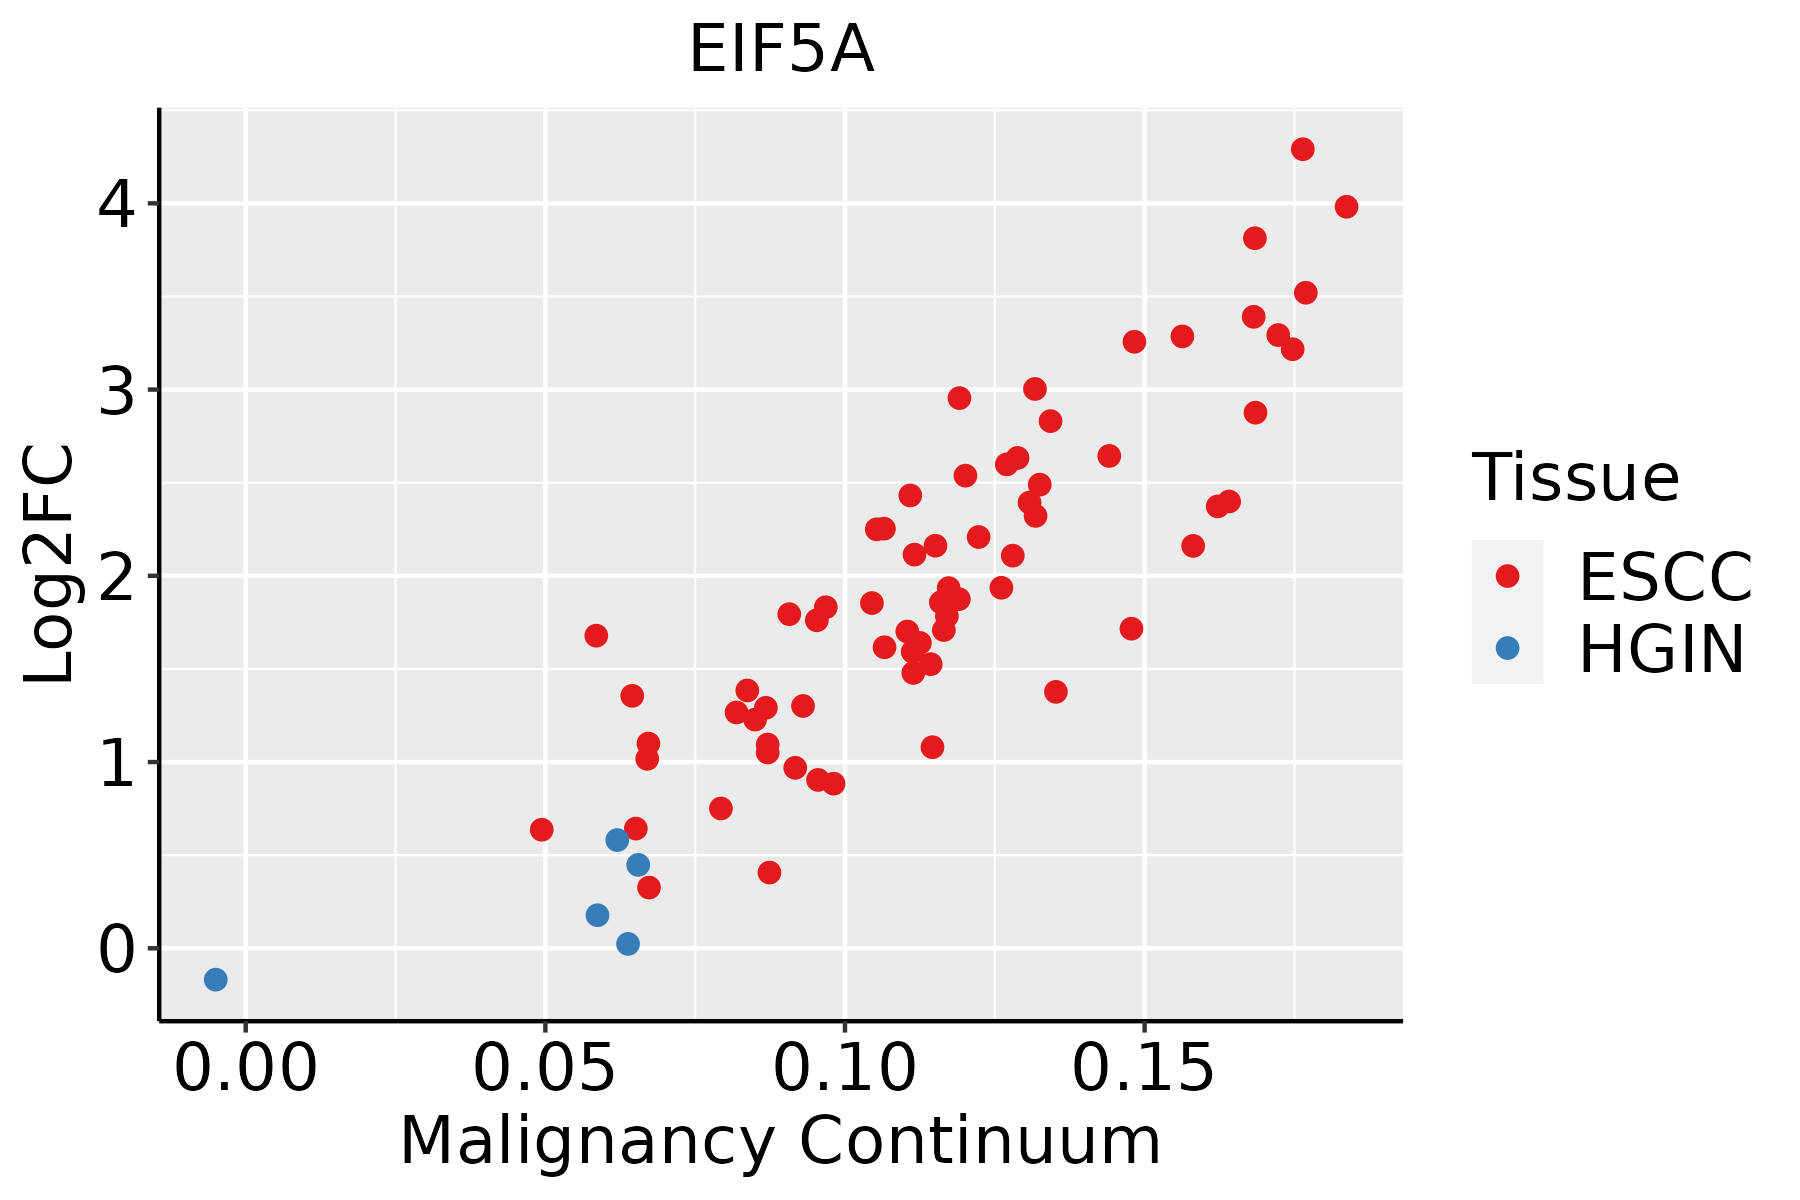 | ESCC: Esophageal squamous cell carcinoma |
| HGIN: High-grade intraepithelial neoplasias | ||
| LGIN: Low-grade intraepithelial neoplasias | ||
| GC | 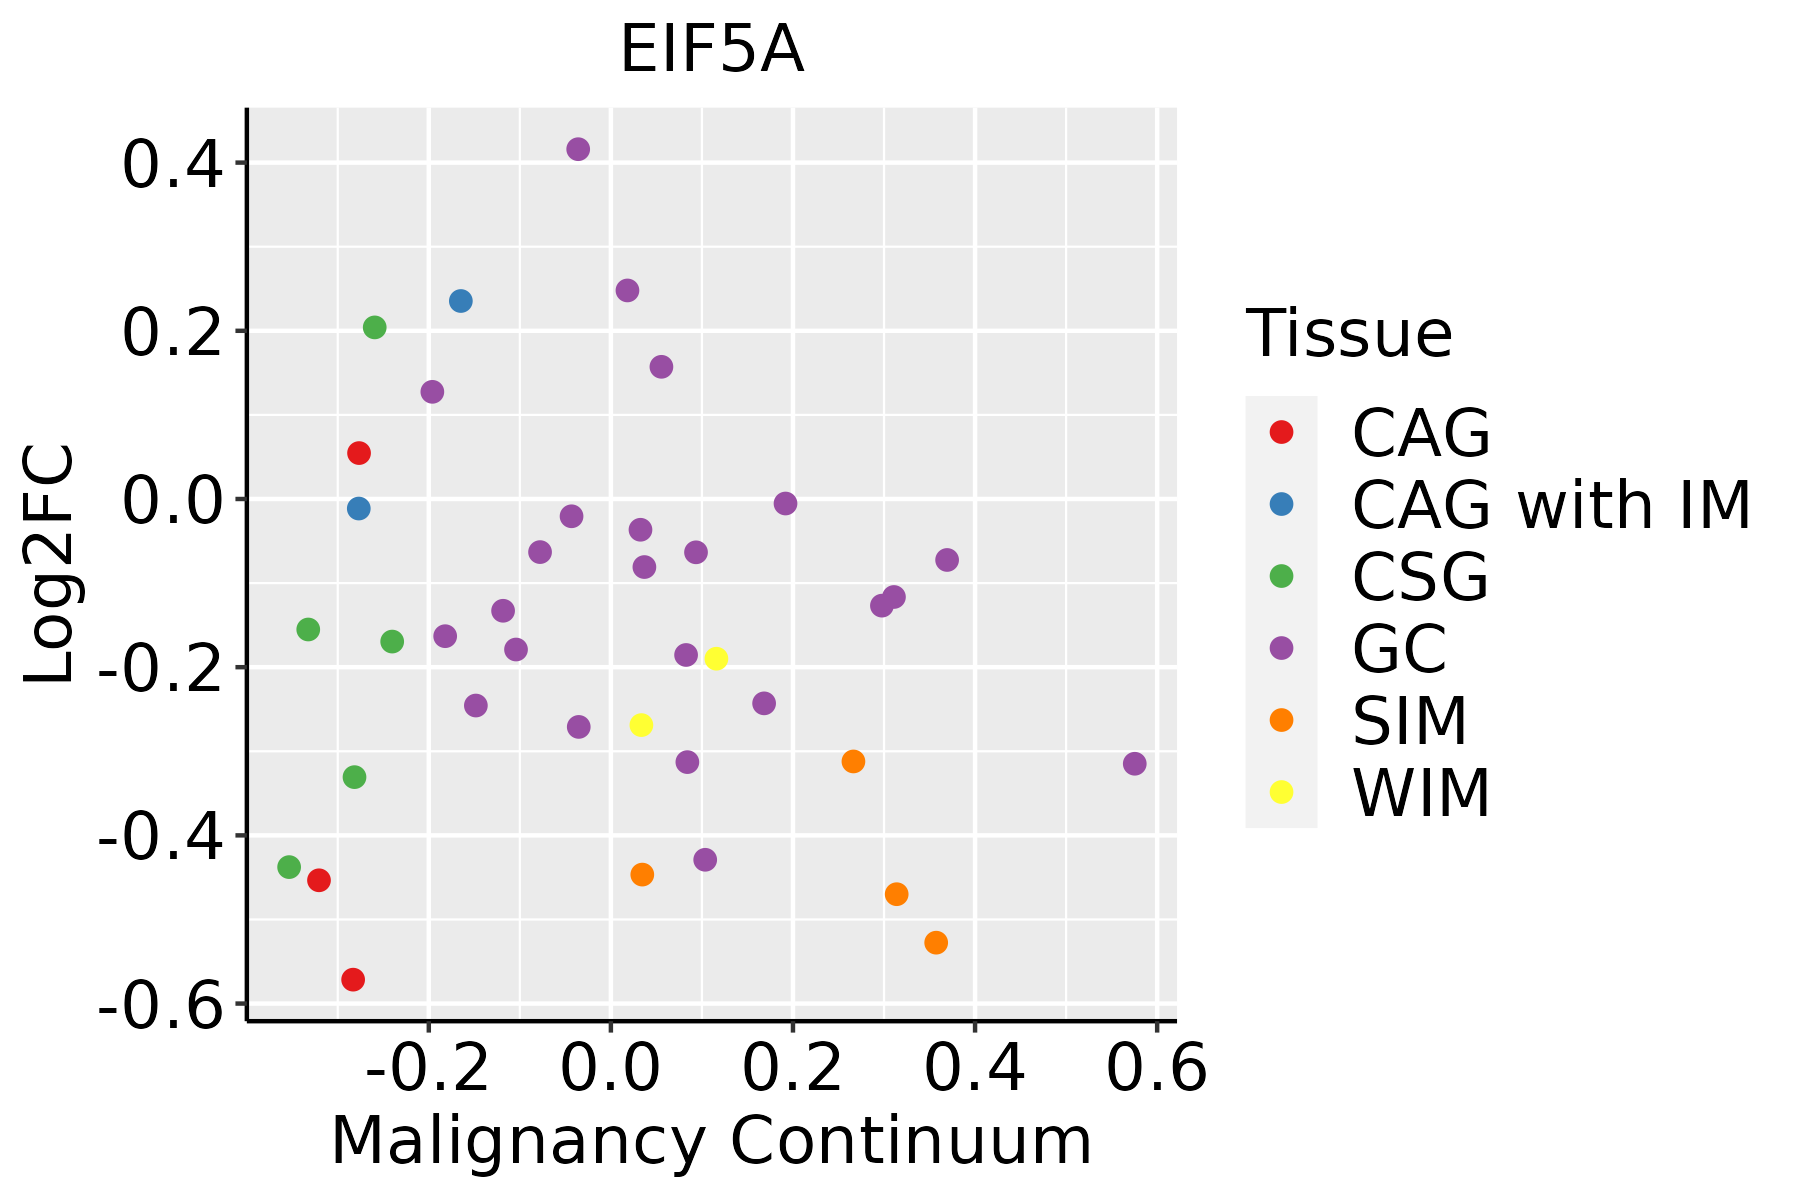 | CAG: Chronic atrophic gastritis |
| CAG with IM: Chronic atrophic gastritis with intestinal metaplasia | ||
| CSG: Chronic superficial gastritis | ||
| GC: Gastric cancer | ||
| SIM: Severe intestinal metaplasia | ||
| WIM: Wild intestinal metaplasia | ||
| Liver | 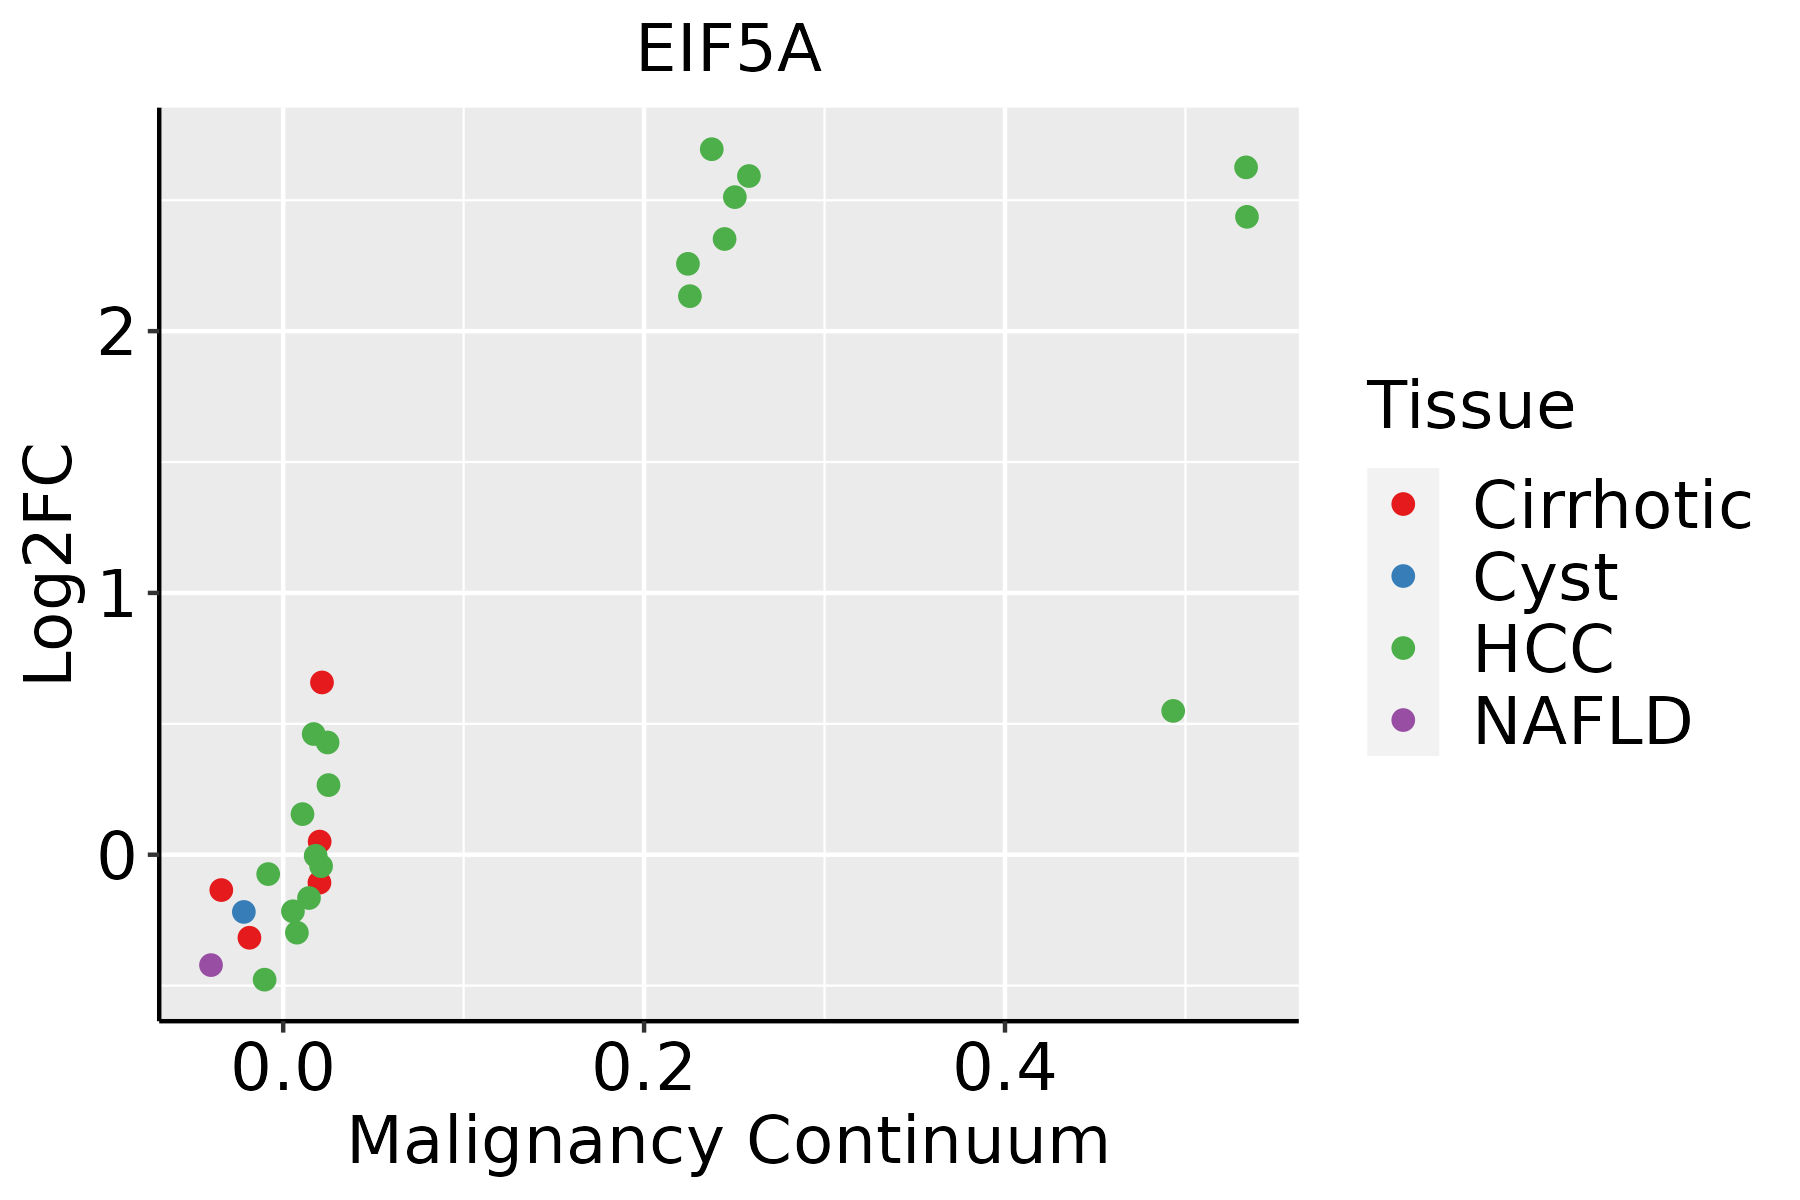 | HCC: Hepatocellular carcinoma |
| NAFLD: Non-alcoholic fatty liver disease | ||
| Oral Cavity | 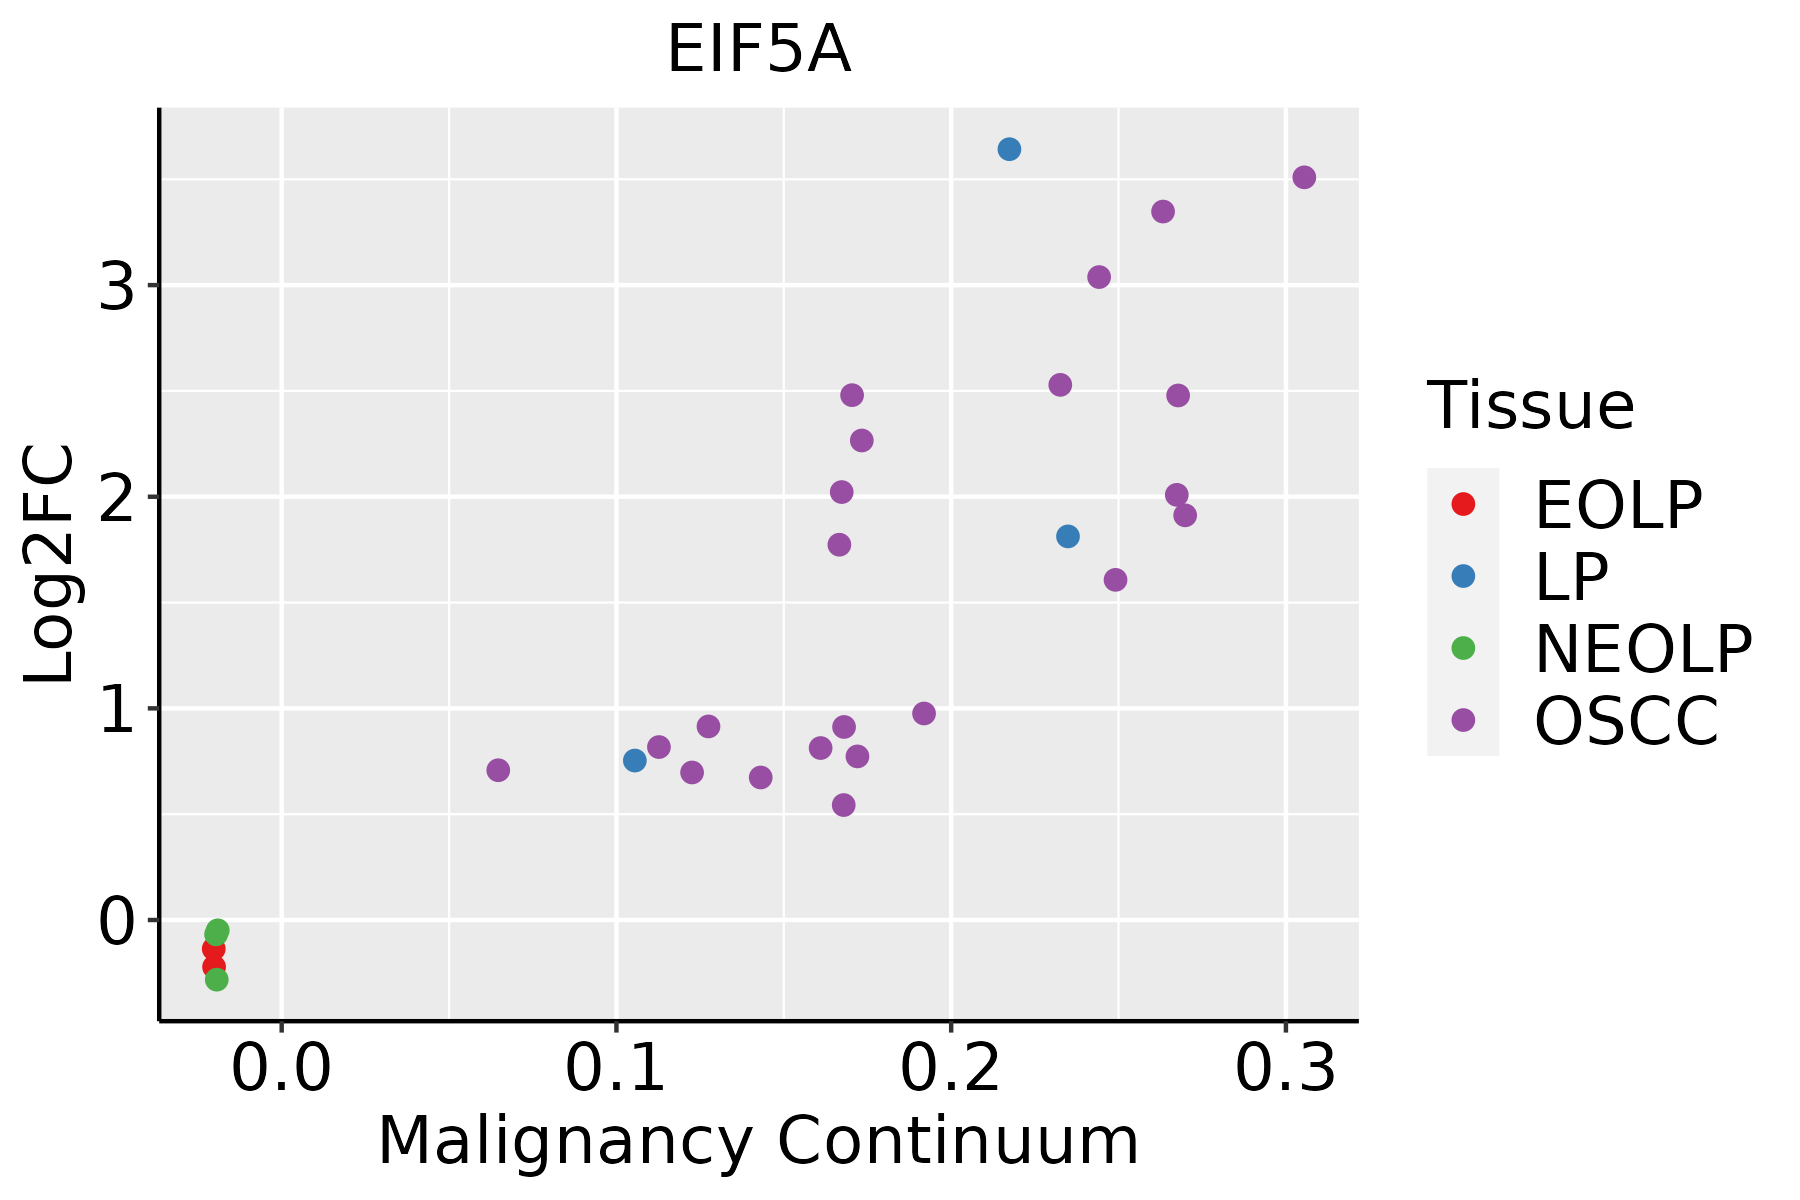 | EOLP: Erosive Oral lichen planus |
| LP: leukoplakia | ||
| NEOLP: Non-erosive oral lichen planus | ||
| OSCC: Oral squamous cell carcinoma | ||
| Prostate |  | BPH: Benign Prostatic Hyperplasia |
| Skin |  | AK: Actinic keratosis |
| cSCC: Cutaneous squamous cell carcinoma | ||
| SCCIS:squamous cell carcinoma in situ | ||
| Thyroid | 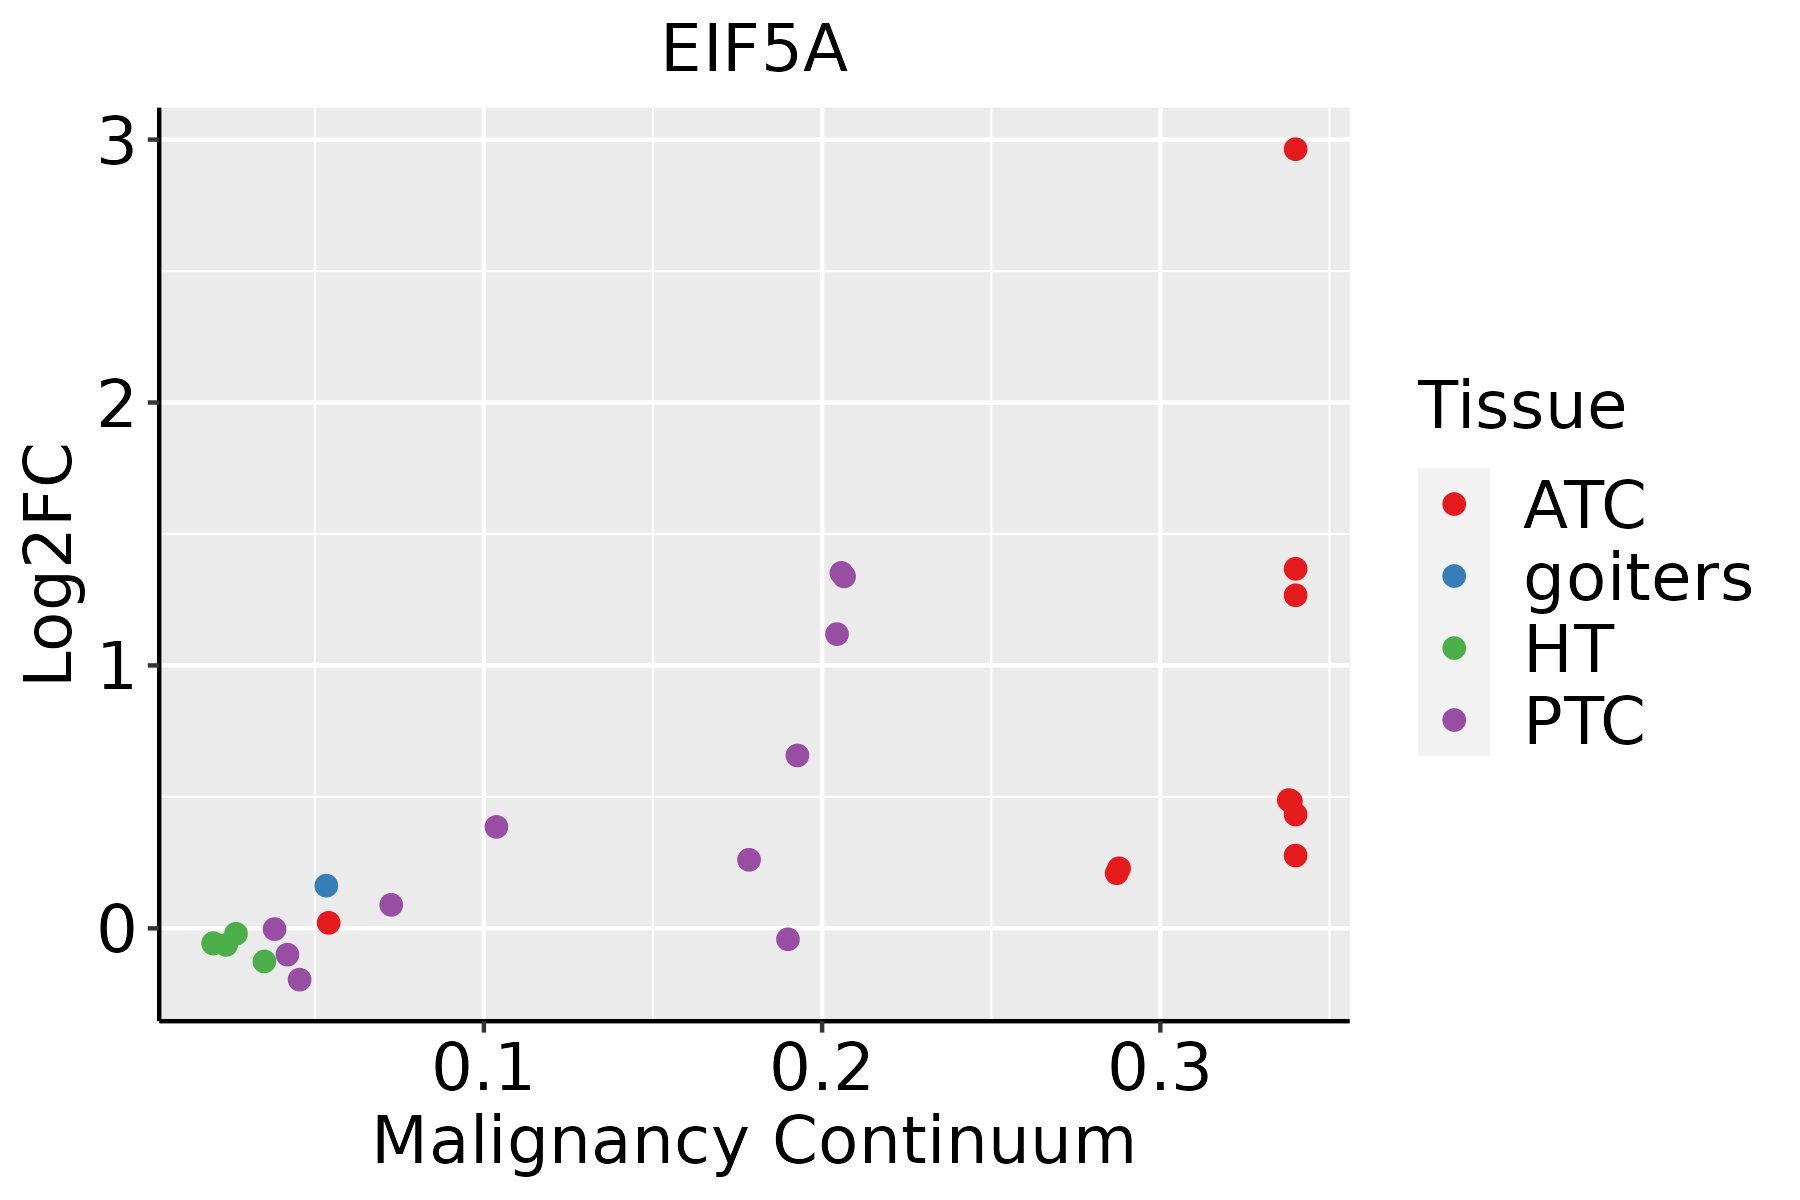 | ATC: Anaplastic thyroid cancer |
| HT: Hashimoto's thyroiditis | ||
| PTC: Papillary thyroid cancer |
| ∗log2FC in expression of this searched gene in stem-like cells from each diseased tissue sample relative to stem-like cells in normal samples in each tissue plotted against the malignancy continuum. Samples are colored based on if they are from different disease stage. |
Top |
Malignant transformation related pathway analysis |
| Find out the enriched GO biological processes and KEGG pathways involved in transition from healthy to precancer to cancer |
| Tissue | Disease Stage | Enriched GO biological Processes |
| Colorectum | AD |  |
| Colorectum | SER |  |
| Colorectum | MSS |  |
| Colorectum | MSI-H |  |
| Colorectum | FAP |  |
| ∗Top 15 enriched GO BP terms are showed in the bar plot of each disease state in each tissue. Each row represents a significant GO biological process which is colored according to the -log10(p.adjust). |
| Page: 1 2 3 4 5 6 7 8 9 |
| GO ID | Tissue | Disease Stage | Description | Gene Ratio | Bg Ratio | pvalue | p.adjust | Count |
| GO:00971939 | Breast | Precancer | intrinsic apoptotic signaling pathway | 59/1080 | 288/18723 | 8.07e-18 | 3.60e-15 | 59 |
| GO:20012339 | Breast | Precancer | regulation of apoptotic signaling pathway | 65/1080 | 356/18723 | 7.70e-17 | 3.17e-14 | 65 |
| GO:20012429 | Breast | Precancer | regulation of intrinsic apoptotic signaling pathway | 41/1080 | 164/18723 | 6.48e-16 | 2.31e-13 | 41 |
| GO:00064179 | Breast | Precancer | regulation of translation | 67/1080 | 468/18723 | 4.71e-12 | 7.64e-10 | 67 |
| GO:00457279 | Breast | Precancer | positive regulation of translation | 32/1080 | 136/18723 | 5.89e-12 | 9.27e-10 | 32 |
| GO:00342509 | Breast | Precancer | positive regulation of cellular amide metabolic process | 33/1080 | 162/18723 | 1.72e-10 | 1.77e-08 | 33 |
| GO:20012445 | Breast | Precancer | positive regulation of intrinsic apoptotic signaling pathway | 17/1080 | 58/18723 | 1.59e-08 | 1.12e-06 | 17 |
| GO:20012356 | Breast | Precancer | positive regulation of apoptotic signaling pathway | 24/1080 | 126/18723 | 1.98e-07 | 1.01e-05 | 24 |
| GO:19017989 | Breast | Precancer | positive regulation of signal transduction by p53 class mediator | 10/1080 | 25/18723 | 5.77e-07 | 2.49e-05 | 10 |
| GO:19017969 | Breast | Precancer | regulation of signal transduction by p53 class mediator | 19/1080 | 93/18723 | 1.20e-06 | 4.60e-05 | 19 |
| GO:00723319 | Breast | Precancer | signal transduction by p53 class mediator | 26/1080 | 163/18723 | 2.23e-06 | 7.76e-05 | 26 |
| GO:00723328 | Breast | Precancer | intrinsic apoptotic signaling pathway by p53 class mediator | 16/1080 | 76/18723 | 5.49e-06 | 1.63e-04 | 16 |
| GO:19022537 | Breast | Precancer | regulation of intrinsic apoptotic signaling pathway by p53 class mediator | 9/1080 | 29/18723 | 2.40e-05 | 5.53e-04 | 9 |
| GO:00713568 | Breast | Precancer | cellular response to tumor necrosis factor | 28/1080 | 229/18723 | 1.42e-04 | 2.45e-03 | 28 |
| GO:00224119 | Breast | Precancer | cellular component disassembly | 44/1080 | 443/18723 | 3.17e-04 | 4.51e-03 | 44 |
| GO:00346128 | Breast | Precancer | response to tumor necrosis factor | 29/1080 | 253/18723 | 3.32e-04 | 4.70e-03 | 29 |
| GO:00064147 | Breast | Precancer | translational elongation | 10/1080 | 55/18723 | 1.06e-03 | 1.18e-02 | 10 |
| GO:00064039 | Breast | Precancer | RNA localization | 23/1080 | 201/18723 | 1.34e-03 | 1.41e-02 | 23 |
| GO:200123314 | Breast | IDC | regulation of apoptotic signaling pathway | 82/1434 | 356/18723 | 6.27e-20 | 5.93e-17 | 82 |
| GO:009719314 | Breast | IDC | intrinsic apoptotic signaling pathway | 69/1434 | 288/18723 | 6.32e-18 | 2.99e-15 | 69 |
| Page: 1 2 3 4 5 6 7 8 9 10 11 12 13 14 15 16 17 18 19 20 21 22 23 24 25 26 27 28 29 30 31 32 33 34 35 |
| Pathway ID | Tissue | Disease Stage | Description | Gene Ratio | Bg Ratio | pvalue | p.adjust | qvalue | Count |
| Page: 1 |
Top |
Cell-cell communication analysis |
| Identification of potential cell-cell interactions between two cell types and their ligand-receptor pairs for different disease states |
| Ligand | Receptor | LRpair | Pathway | Tissue | Disease Stage |
| Page: 1 |
Top |
Single-cell gene regulatory network inference analysis |
| Find out the significant the regulons (TFs) and the target genes of each regulon across cell types for different disease states |
| TF | Cell Type | Tissue | Disease Stage | Target Gene | RSS | Regulon Activity |
| ∗The dot plots of a searched regulon are shown for all cell subpopulations in each disease state of each tissue based on the regulon specific score inferred using pySCENIC and by calculating the average expression. |
| Page: 1 |
Top |
Somatic mutation of malignant transformation related genes |
| Annotation of somatic variants for genes involved in malignant transformation |
| Hugo Symbol | Variant Class | Variant Classification | dbSNP RS | HGVSc | HGVSp | HGVSp Short | SWISSPROT | BIOTYPE | SIFT | PolyPhen | Tumor Sample Barcode | Tissue | Histology | Sex | Age | Stage | Therapy Types | Drugs | Outcome |
| EIF5A | SNV | Missense_Mutation | rs769669056 | c.166N>T | p.Arg56Cys | p.R56C | P63241 | protein_coding | deleterious(0.05) | benign(0.221) | TCGA-DS-A1OD-01 | Cervix | cervical & endocervical cancer | Female | <65 | I/II | Chemotherapy | cisplatin | SD |
| EIF5A | SNV | Missense_Mutation | c.158N>T | p.Ser53Leu | p.S53L | P63241 | protein_coding | deleterious(0) | probably_damaging(0.995) | TCGA-Q1-A73O-01 | Cervix | cervical & endocervical cancer | Female | <65 | I/II | Chemotherapy | cisplatin | CR | |
| EIF5A | SNV | Missense_Mutation | c.392T>G | p.Leu131Arg | p.L131R | P63241 | protein_coding | deleterious(0) | probably_damaging(0.994) | TCGA-AA-3833-01 | Colorectum | colon adenocarcinoma | Female | <65 | I/II | Unknown | Unknown | SD | |
| EIF5A | SNV | Missense_Mutation | novel | c.98N>G | p.Asp33Gly | p.D33G | P63241 | protein_coding | deleterious(0.04) | benign(0.034) | TCGA-AA-3977-01 | Colorectum | colon adenocarcinoma | Male | >=65 | I/II | Unknown | Unknown | SD |
| EIF5A | SNV | Missense_Mutation | c.523N>C | p.Ala175Pro | p.A175P | P63241 | protein_coding | tolerated(0.13) | benign(0.269) | TCGA-AD-6964-01 | Colorectum | colon adenocarcinoma | Male | <65 | III/IV | Chemotherapy | folfox | PD | |
| EIF5A | SNV | Missense_Mutation | novel | c.502N>A | p.Leu168Met | p.L168M | P63241 | protein_coding | tolerated(0.38) | benign(0.369) | TCGA-A5-A0G2-01 | Endometrium | uterine corpus endometrioid carcinoma | Female | <65 | III/IV | Unknown | Unknown | SD |
| EIF5A | SNV | Missense_Mutation | c.227N>T | p.Ser76Leu | p.S76L | P63241 | protein_coding | deleterious(0) | probably_damaging(0.972) | TCGA-A5-A2K5-01 | Endometrium | uterine corpus endometrioid carcinoma | Female | >=65 | I/II | Unknown | Unknown | SD | |
| EIF5A | SNV | Missense_Mutation | novel | c.456N>T | p.Glu152Asp | p.E152D | P63241 | protein_coding | tolerated(0.15) | benign(0.005) | TCGA-AP-A1E0-01 | Endometrium | uterine corpus endometrioid carcinoma | Female | <65 | III/IV | Chemotherapy | paclitaxel | SD |
| EIF5A | SNV | Missense_Mutation | c.167N>A | p.Arg56His | p.R56H | P63241 | protein_coding | deleterious(0.02) | benign(0.18) | TCGA-AX-A3FT-01 | Endometrium | uterine corpus endometrioid carcinoma | Female | <65 | I/II | Unknown | Unknown | SD | |
| EIF5A | SNV | Missense_Mutation | novel | c.325N>G | p.Met109Val | p.M109V | P63241 | protein_coding | tolerated(0.07) | benign(0.071) | TCGA-AX-A3FT-01 | Endometrium | uterine corpus endometrioid carcinoma | Female | <65 | I/II | Unknown | Unknown | SD |
| Page: 1 2 3 4 |
Top |
Related drugs of malignant transformation related genes |
| Identification of chemicals and drugs interact with genes involved in malignant transfromation |
| (DGIdb 4.0) |
| Entrez ID | Symbol | Category | Interaction Types | Drug Claim Name | Drug Name | PMIDs |
| 1984 | EIF5A | NA | SNS01-T |
| Page: 1 |

Copyright 2023-Present -The University of Texas Health Science Center at Houston |