
|
|||||
|
 | |
| |
| |
| |
| |
| |
|
Gene: EHBP1L1 |
Gene summary for EHBP1L1 |
| Gene information | Species | Human | Gene symbol | EHBP1L1 | Gene ID | 254102 |
| Gene name | EH domain binding protein 1 like 1 | |
| Gene Alias | EHBP1L1 | |
| Cytomap | 11q13.1 | |
| Gene Type | protein-coding | GO ID | GO:0006996 | UniProtAcc | Q8N3D4 |
Top |
Malignant transformation analysis |
| Identification of the aberrant gene expression in precancerous and cancerous lesions by comparing the gene expression of stem-like cells in diseased tissues with normal stem cells |
| Entrez ID | Symbol | Replicates | Species | Organ | Tissue | Adj P-value | Log2FC | Malignancy |
| 254102 | EHBP1L1 | C30 | Human | Oral cavity | OSCC | 2.08e-25 | 1.06e+00 | 0.3055 |
| 254102 | EHBP1L1 | C51 | Human | Oral cavity | OSCC | 1.85e-08 | 5.98e-01 | 0.2674 |
| 254102 | EHBP1L1 | C57 | Human | Oral cavity | OSCC | 8.63e-05 | 2.41e-01 | 0.1679 |
| 254102 | EHBP1L1 | C08 | Human | Oral cavity | OSCC | 5.21e-06 | 2.55e-01 | 0.1919 |
| 254102 | EHBP1L1 | LN22 | Human | Oral cavity | OSCC | 7.32e-03 | 4.70e-01 | 0.1733 |
| 254102 | EHBP1L1 | EOLP-1 | Human | Oral cavity | EOLP | 4.82e-07 | 2.24e-01 | -0.0202 |
| 254102 | EHBP1L1 | NEOLP-3 | Human | Oral cavity | NEOLP | 2.82e-02 | 1.71e-01 | -0.0191 |
| 254102 | EHBP1L1 | SYSMH1 | Human | Oral cavity | OSCC | 1.16e-14 | 5.04e-01 | 0.1127 |
| 254102 | EHBP1L1 | SYSMH2 | Human | Oral cavity | OSCC | 6.66e-08 | 3.70e-01 | 0.2326 |
| 254102 | EHBP1L1 | SYSMH3 | Human | Oral cavity | OSCC | 1.55e-12 | 4.98e-01 | 0.2442 |
| 254102 | EHBP1L1 | SYSMH5 | Human | Oral cavity | OSCC | 2.84e-22 | 5.87e-01 | 0.0647 |
| 254102 | EHBP1L1 | male-WTA | Human | Thyroid | PTC | 2.29e-02 | 6.91e-02 | 0.1037 |
| 254102 | EHBP1L1 | PTC03 | Human | Thyroid | PTC | 1.79e-07 | 2.52e-01 | 0.1784 |
| 254102 | EHBP1L1 | PTC04 | Human | Thyroid | PTC | 5.11e-12 | 2.71e-01 | 0.1927 |
| 254102 | EHBP1L1 | PTC05 | Human | Thyroid | PTC | 3.67e-16 | 5.25e-01 | 0.2065 |
| 254102 | EHBP1L1 | PTC06 | Human | Thyroid | PTC | 2.51e-21 | 4.65e-01 | 0.2057 |
| 254102 | EHBP1L1 | PTC07 | Human | Thyroid | PTC | 1.90e-14 | 2.42e-01 | 0.2044 |
| 254102 | EHBP1L1 | ATC09 | Human | Thyroid | ATC | 1.28e-28 | 8.99e-01 | 0.2871 |
| 254102 | EHBP1L1 | ATC11 | Human | Thyroid | ATC | 5.35e-04 | 4.33e-01 | 0.3386 |
| 254102 | EHBP1L1 | ATC12 | Human | Thyroid | ATC | 9.23e-23 | 4.28e-01 | 0.34 |
| Page: 1 2 3 4 5 |
| Tissue | Expression Dynamics | Abbreviation |
| Esophagus | 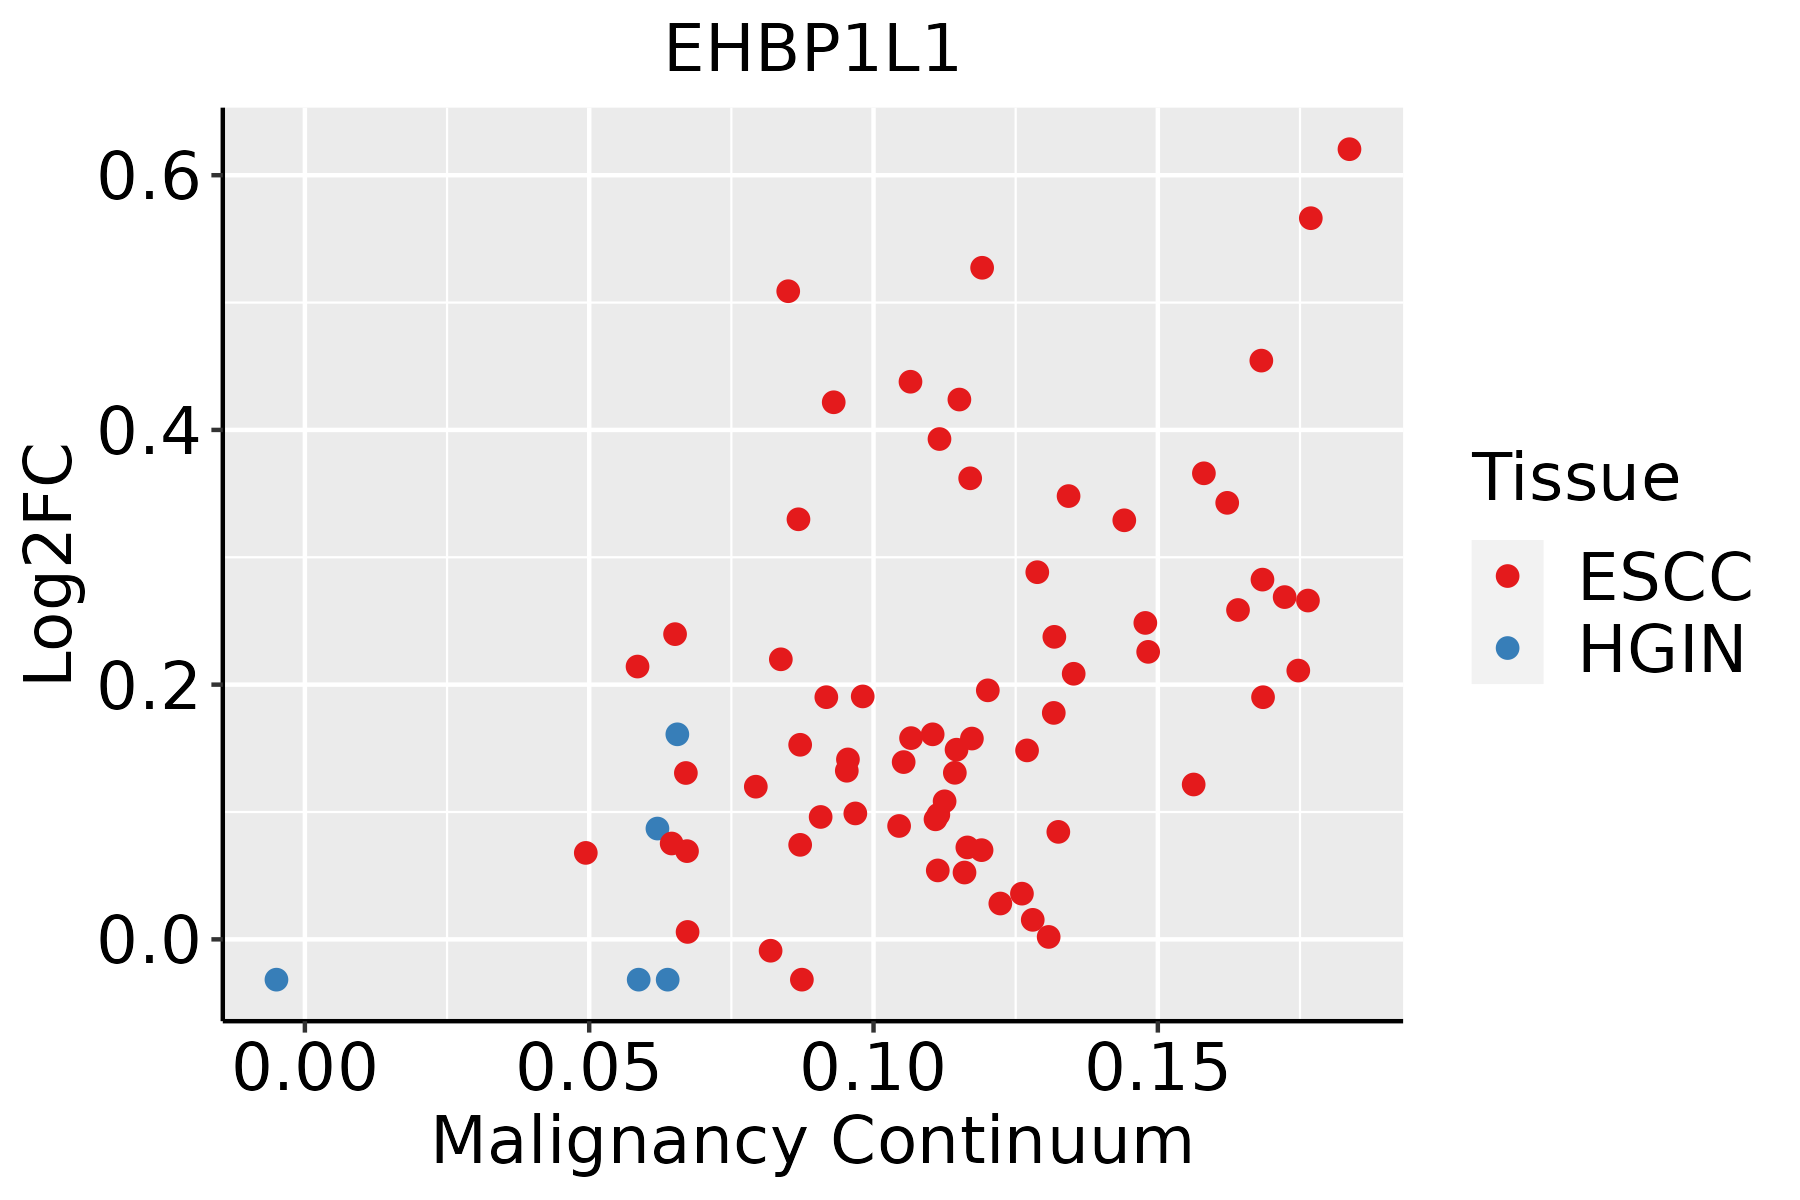 | ESCC: Esophageal squamous cell carcinoma |
| HGIN: High-grade intraepithelial neoplasias | ||
| LGIN: Low-grade intraepithelial neoplasias | ||
| Liver | 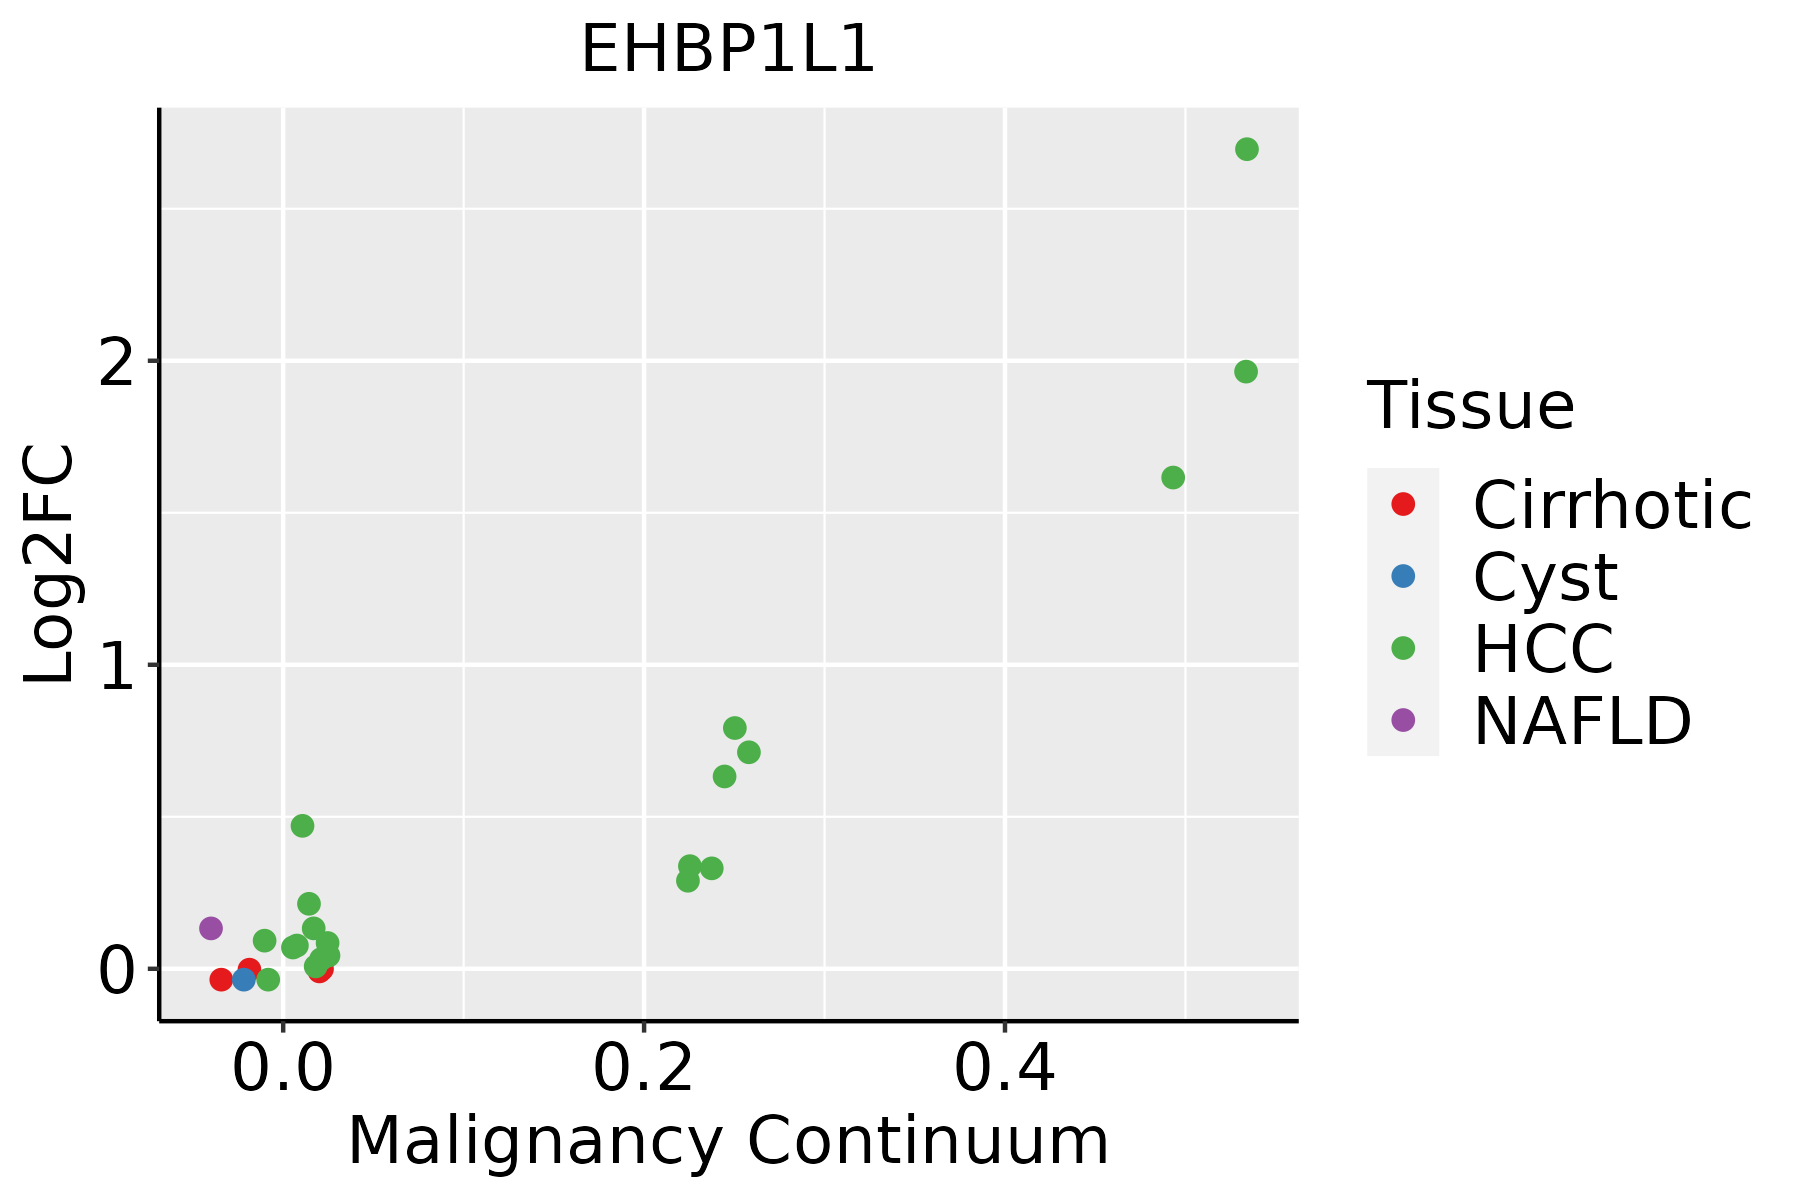 | HCC: Hepatocellular carcinoma |
| NAFLD: Non-alcoholic fatty liver disease | ||
| Oral Cavity |  | EOLP: Erosive Oral lichen planus |
| LP: leukoplakia | ||
| NEOLP: Non-erosive oral lichen planus | ||
| OSCC: Oral squamous cell carcinoma | ||
| Thyroid |  | ATC: Anaplastic thyroid cancer |
| HT: Hashimoto's thyroiditis | ||
| PTC: Papillary thyroid cancer |
| ∗log2FC in expression of this searched gene in stem-like cells from each diseased tissue sample relative to stem-like cells in normal samples in each tissue plotted against the malignancy continuum. Samples are colored based on if they are from different disease stage. |
Top |
Malignant transformation related pathway analysis |
| Find out the enriched GO biological processes and KEGG pathways involved in transition from healthy to precancer to cancer |
| Tissue | Disease Stage | Enriched GO biological Processes |
| Colorectum | AD |  |
| Colorectum | SER |  |
| Colorectum | MSS |  |
| Colorectum | MSI-H |  |
| Colorectum | FAP |  |
| ∗Top 15 enriched GO BP terms are showed in the bar plot of each disease state in each tissue. Each row represents a significant GO biological process which is colored according to the -log10(p.adjust). |
| Page: 1 2 3 4 5 6 7 8 9 |
| GO ID | Tissue | Disease Stage | Description | Gene Ratio | Bg Ratio | pvalue | p.adjust | Count |
| Page: 1 |
| Pathway ID | Tissue | Disease Stage | Description | Gene Ratio | Bg Ratio | pvalue | p.adjust | qvalue | Count |
| Page: 1 |
Top |
Cell-cell communication analysis |
| Identification of potential cell-cell interactions between two cell types and their ligand-receptor pairs for different disease states |
| Ligand | Receptor | LRpair | Pathway | Tissue | Disease Stage |
| Page: 1 |
Top |
Single-cell gene regulatory network inference analysis |
| Find out the significant the regulons (TFs) and the target genes of each regulon across cell types for different disease states |
| TF | Cell Type | Tissue | Disease Stage | Target Gene | RSS | Regulon Activity |
| ∗The dot plots of a searched regulon are shown for all cell subpopulations in each disease state of each tissue based on the regulon specific score inferred using pySCENIC and by calculating the average expression. |
| Page: 1 |
Top |
Somatic mutation of malignant transformation related genes |
| Annotation of somatic variants for genes involved in malignant transformation |
| Hugo Symbol | Variant Class | Variant Classification | dbSNP RS | HGVSc | HGVSp | HGVSp Short | SWISSPROT | BIOTYPE | SIFT | PolyPhen | Tumor Sample Barcode | Tissue | Histology | Sex | Age | Stage | Therapy Types | Drugs | Outcome |
| EHBP1L1 | SNV | Missense_Mutation | novel | c.352N>T | p.Val118Leu | p.V118L | Q8N3D4 | protein_coding | deleterious(0.02) | possibly_damaging(0.826) | TCGA-AC-A2QJ-01 | Breast | breast invasive carcinoma | Female | <65 | III/IV | Chemotherapy | cytoxan | PD |
| EHBP1L1 | SNV | Missense_Mutation | novel | c.2887N>C | p.Glu963Gln | p.E963Q | Q8N3D4 | protein_coding | tolerated(0.1) | benign(0.184) | TCGA-BH-A0B6-01 | Breast | breast invasive carcinoma | Female | <65 | I/II | Unknown | Unknown | SD |
| EHBP1L1 | SNV | Missense_Mutation | rs764167148 | c.149N>A | p.Arg50His | p.R50H | Q8N3D4 | protein_coding | deleterious(0) | probably_damaging(0.999) | TCGA-BH-A18G-01 | Breast | breast invasive carcinoma | Female | >=65 | I/II | Unknown | Unknown | SD |
| EHBP1L1 | SNV | Missense_Mutation | c.3395N>T | p.Thr1132Met | p.T1132M | Q8N3D4 | protein_coding | deleterious(0.01) | probably_damaging(0.944) | TCGA-BH-A18G-01 | Breast | breast invasive carcinoma | Female | >=65 | I/II | Unknown | Unknown | SD | |
| EHBP1L1 | SNV | Missense_Mutation | c.2087N>G | p.Ser696Cys | p.S696C | Q8N3D4 | protein_coding | deleterious(0.04) | possibly_damaging(0.533) | TCGA-E9-A1N5-01 | Breast | breast invasive carcinoma | Female | <65 | I/II | Chemotherapy | doxorubicin | SD | |
| EHBP1L1 | insertion | Frame_Shift_Ins | novel | c.1206_1207insCCTGGAGTTCGCTTGTTAATTTATTTTCCTTCTT | p.Ala403ProfsTer15 | p.A403Pfs*15 | Q8N3D4 | protein_coding | TCGA-A2-A0CP-01 | Breast | breast invasive carcinoma | Female | <65 | I/II | Chemotherapy | cytoxan | SD | ||
| EHBP1L1 | SNV | Missense_Mutation | rs759333764 | c.148N>T | p.Arg50Cys | p.R50C | Q8N3D4 | protein_coding | deleterious(0) | probably_damaging(0.999) | TCGA-2W-A8YY-01 | Cervix | cervical & endocervical cancer | Female | <65 | I/II | Chemotherapy | cisplatin | CR |
| EHBP1L1 | SNV | Missense_Mutation | novel | c.4384N>T | p.His1462Tyr | p.H1462Y | Q8N3D4 | protein_coding | deleterious(0) | possibly_damaging(0.825) | TCGA-4J-AA1J-01 | Cervix | cervical & endocervical cancer | Female | <65 | I/II | Unknown | Unknown | SD |
| EHBP1L1 | SNV | Missense_Mutation | novel | c.494A>C | p.Asp165Ala | p.D165A | Q8N3D4 | protein_coding | deleterious(0) | probably_damaging(0.954) | TCGA-DS-A1OD-01 | Cervix | cervical & endocervical cancer | Female | <65 | I/II | Chemotherapy | cisplatin | SD |
| EHBP1L1 | SNV | Missense_Mutation | c.2546C>T | p.Ser849Leu | p.S849L | Q8N3D4 | protein_coding | deleterious(0.04) | benign(0.003) | TCGA-DS-A1OD-01 | Cervix | cervical & endocervical cancer | Female | <65 | I/II | Chemotherapy | cisplatin | SD |
| Page: 1 2 3 4 5 6 7 8 9 10 11 |
Top |
Related drugs of malignant transformation related genes |
| Identification of chemicals and drugs interact with genes involved in malignant transfromation |
| (DGIdb 4.0) |
| Entrez ID | Symbol | Category | Interaction Types | Drug Claim Name | Drug Name | PMIDs |
| Page: 1 |

Copyright 2023-Present -The University of Texas Health Science Center at Houston |