
|
|||||
|
 | |
| |
| |
| |
| |
| |
|
Gene: EHBP1 |
Gene summary for EHBP1 |
| Gene information | Species | Human | Gene symbol | EHBP1 | Gene ID | 23301 |
| Gene name | EH domain binding protein 1 | |
| Gene Alias | HPC12 | |
| Cytomap | 2p15 | |
| Gene Type | protein-coding | GO ID | GO:0006810 | UniProtAcc | A0A140VK17 |
Top |
Malignant transformation analysis |
| Identification of the aberrant gene expression in precancerous and cancerous lesions by comparing the gene expression of stem-like cells in diseased tissues with normal stem cells |
| Entrez ID | Symbol | Replicates | Species | Organ | Tissue | Adj P-value | Log2FC | Malignancy |
| 23301 | EHBP1 | LZE7T | Human | Esophagus | ESCC | 6.85e-09 | 4.07e-01 | 0.0667 |
| 23301 | EHBP1 | LZE8T | Human | Esophagus | ESCC | 7.33e-05 | 1.55e-01 | 0.067 |
| 23301 | EHBP1 | LZE20T | Human | Esophagus | ESCC | 3.78e-05 | 1.30e-01 | 0.0662 |
| 23301 | EHBP1 | LZE21D1 | Human | Esophagus | HGIN | 2.16e-03 | 4.72e-01 | 0.0632 |
| 23301 | EHBP1 | LZE22D1 | Human | Esophagus | HGIN | 1.98e-03 | 1.02e-01 | 0.0595 |
| 23301 | EHBP1 | LZE24T | Human | Esophagus | ESCC | 3.28e-06 | 1.92e-01 | 0.0596 |
| 23301 | EHBP1 | LZE21T | Human | Esophagus | ESCC | 9.51e-03 | 5.04e-01 | 0.0655 |
| 23301 | EHBP1 | LZE6T | Human | Esophagus | ESCC | 6.10e-06 | 1.21e-01 | 0.0845 |
| 23301 | EHBP1 | P1T-E | Human | Esophagus | ESCC | 4.42e-09 | 4.56e-01 | 0.0875 |
| 23301 | EHBP1 | P2T-E | Human | Esophagus | ESCC | 1.26e-41 | 7.37e-01 | 0.1177 |
| 23301 | EHBP1 | P4T-E | Human | Esophagus | ESCC | 6.26e-16 | 3.98e-01 | 0.1323 |
| 23301 | EHBP1 | P5T-E | Human | Esophagus | ESCC | 3.78e-20 | 4.06e-01 | 0.1327 |
| 23301 | EHBP1 | P8T-E | Human | Esophagus | ESCC | 5.16e-17 | 2.87e-01 | 0.0889 |
| 23301 | EHBP1 | P9T-E | Human | Esophagus | ESCC | 3.07e-13 | 3.53e-01 | 0.1131 |
| 23301 | EHBP1 | P10T-E | Human | Esophagus | ESCC | 1.93e-30 | 6.52e-01 | 0.116 |
| 23301 | EHBP1 | P11T-E | Human | Esophagus | ESCC | 6.03e-15 | 9.43e-01 | 0.1426 |
| 23301 | EHBP1 | P12T-E | Human | Esophagus | ESCC | 9.01e-26 | 4.47e-01 | 0.1122 |
| 23301 | EHBP1 | P15T-E | Human | Esophagus | ESCC | 1.07e-23 | 6.22e-01 | 0.1149 |
| 23301 | EHBP1 | P16T-E | Human | Esophagus | ESCC | 1.04e-19 | 3.48e-01 | 0.1153 |
| 23301 | EHBP1 | P17T-E | Human | Esophagus | ESCC | 2.81e-02 | 4.36e-01 | 0.1278 |
| Page: 1 2 3 4 5 6 7 8 9 10 |
| Tissue | Expression Dynamics | Abbreviation |
| Cervix | 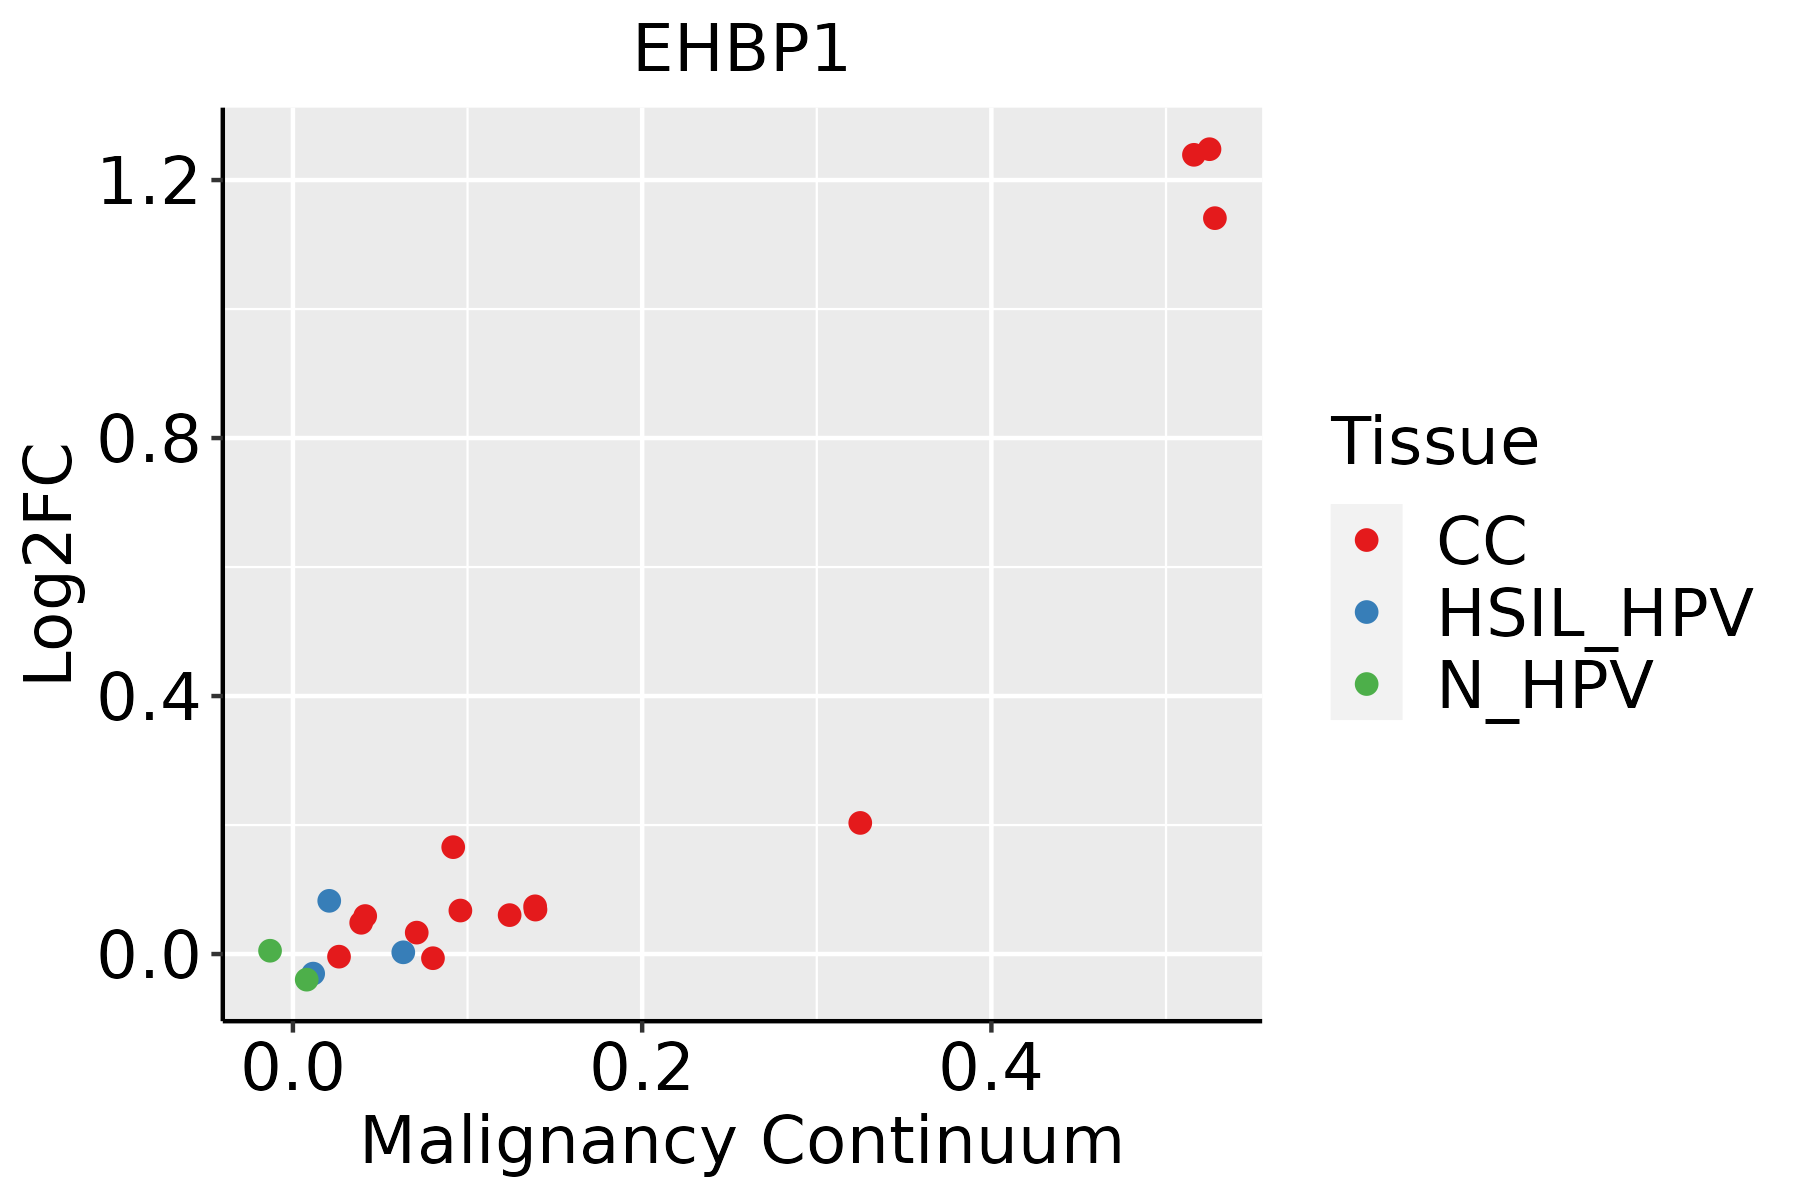 | CC: Cervix cancer |
| HSIL_HPV: HPV-infected high-grade squamous intraepithelial lesions | ||
| N_HPV: HPV-infected normal cervix | ||
| Colorectum (GSE201348) | 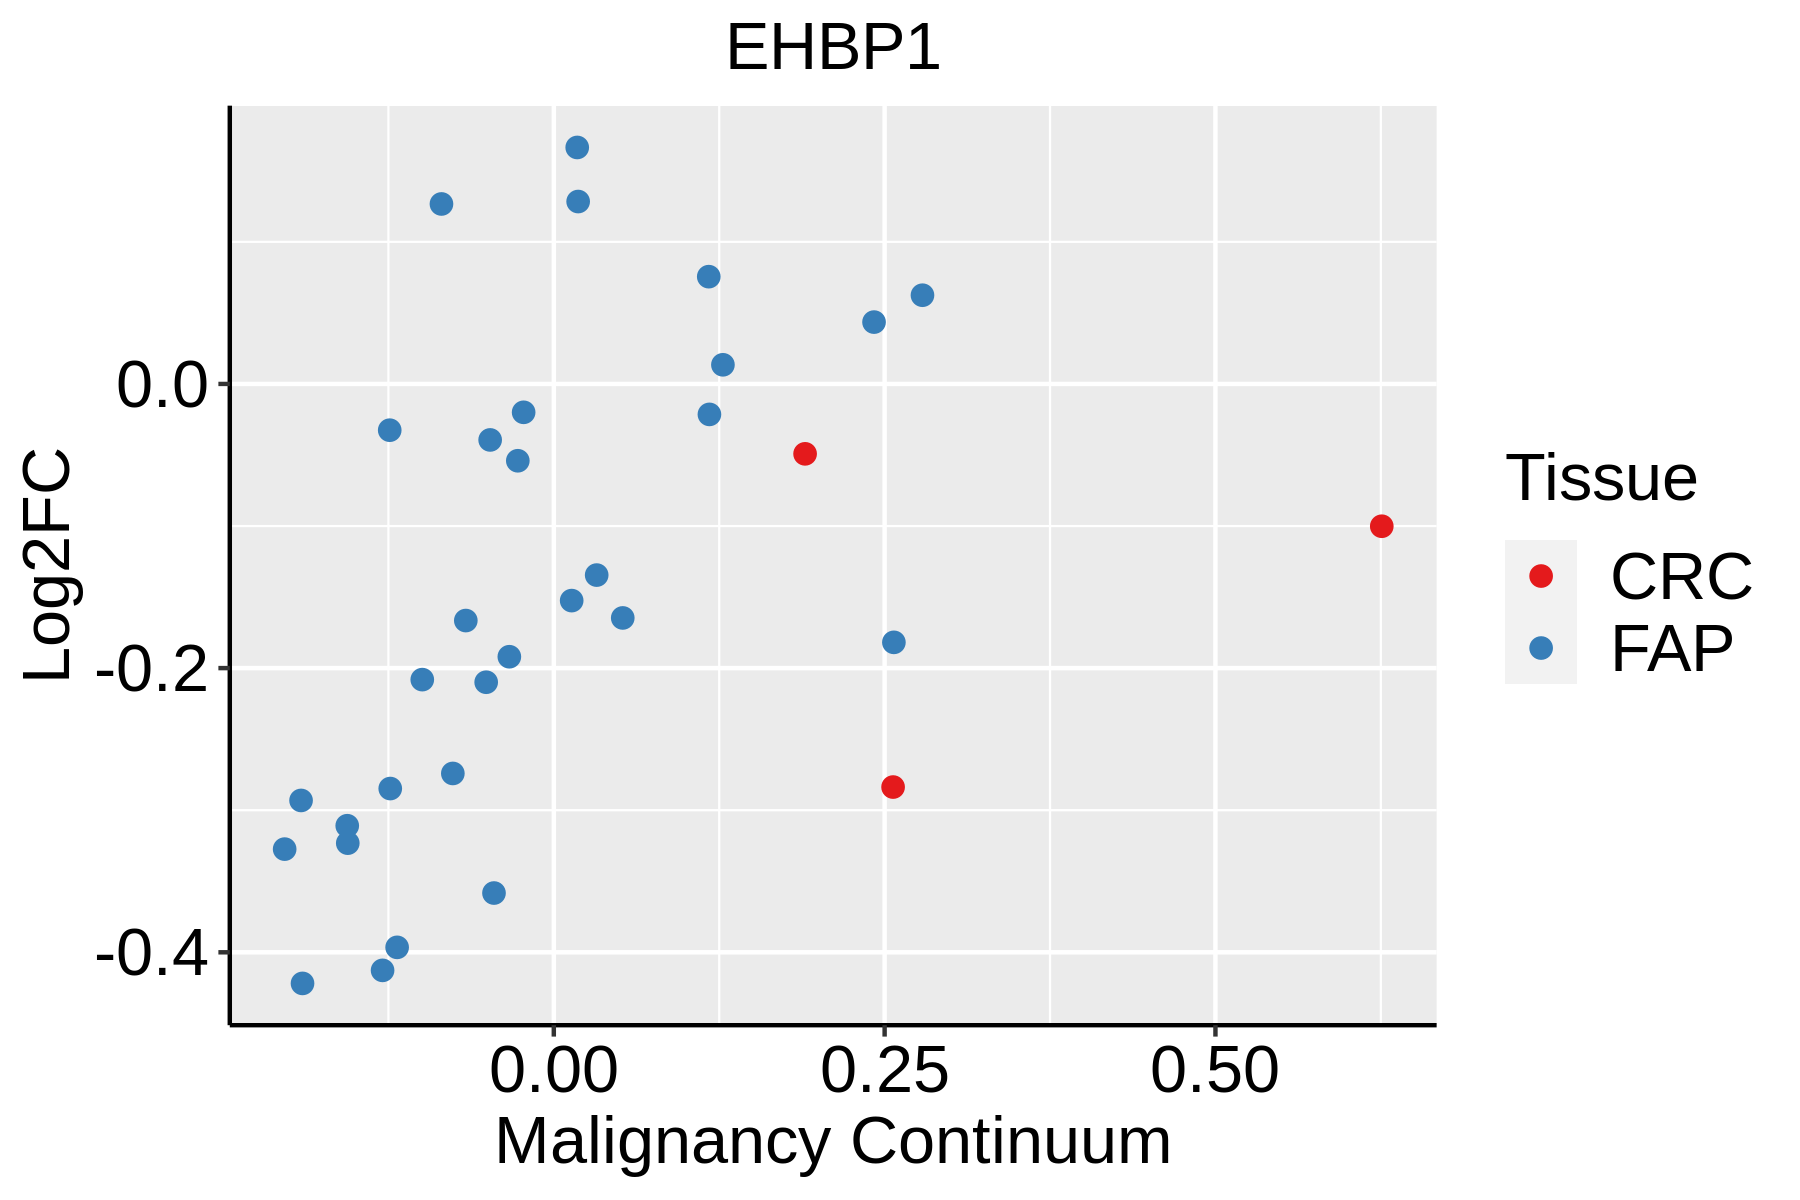 | FAP: Familial adenomatous polyposis |
| CRC: Colorectal cancer | ||
| Colorectum (HTA11) | 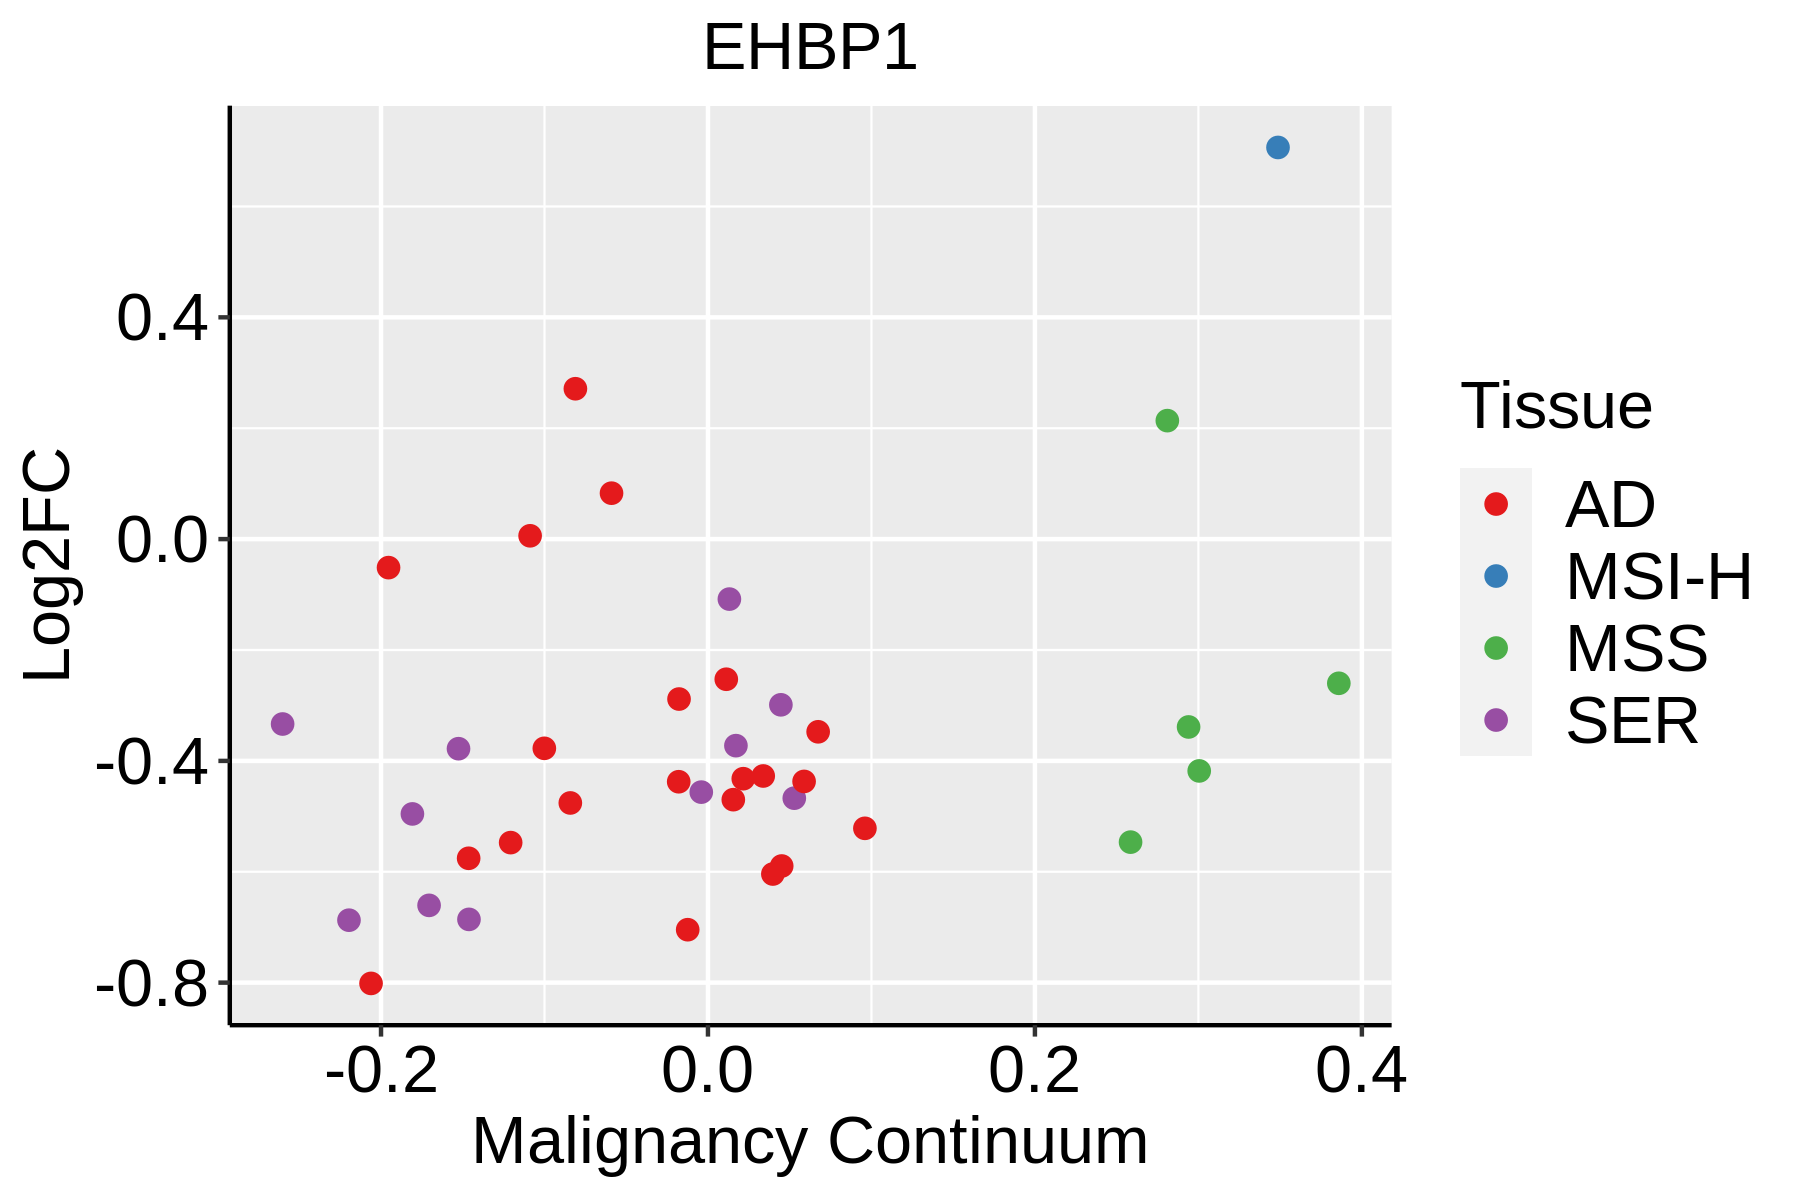 | AD: Adenomas |
| SER: Sessile serrated lesions | ||
| MSI-H: Microsatellite-high colorectal cancer | ||
| MSS: Microsatellite stable colorectal cancer | ||
| Endometrium | 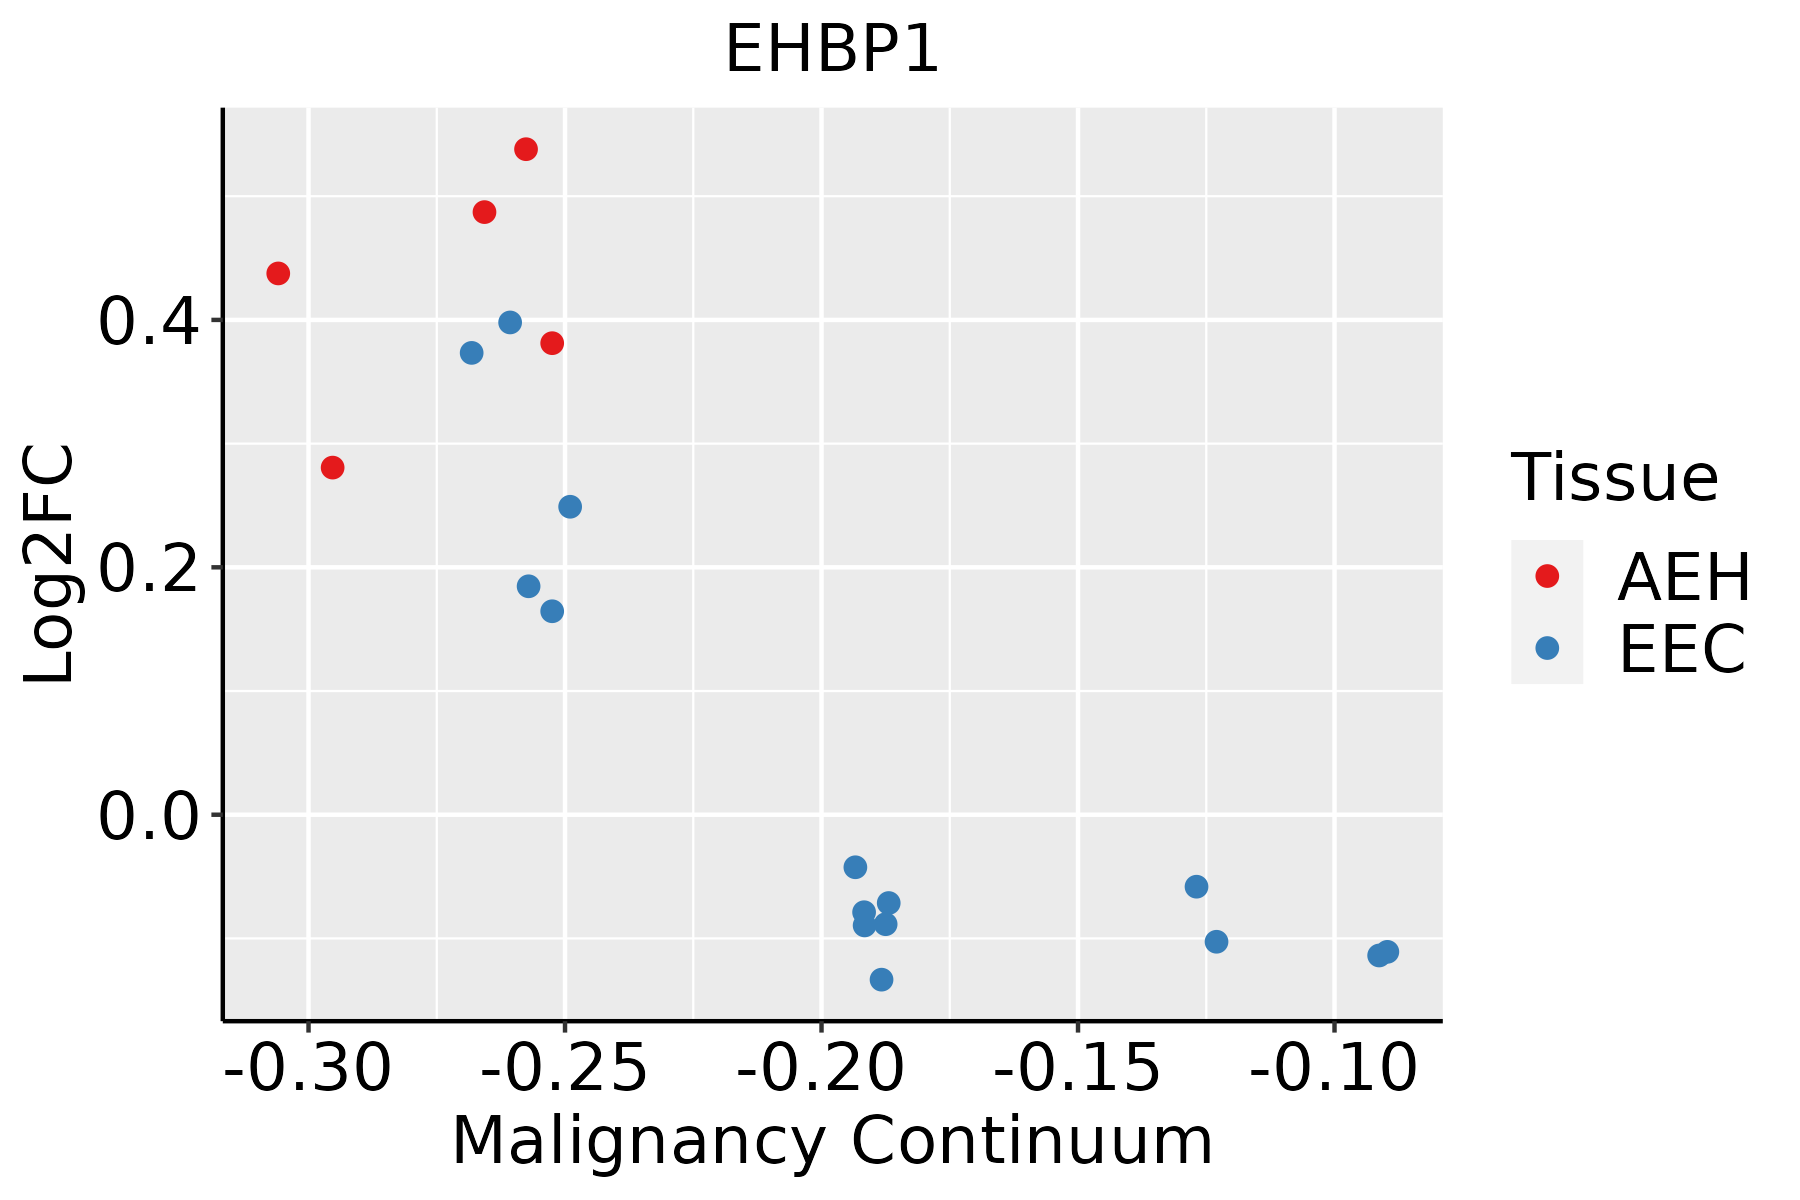 | AEH: Atypical endometrial hyperplasia |
| EEC: Endometrioid Cancer | ||
| Esophagus | 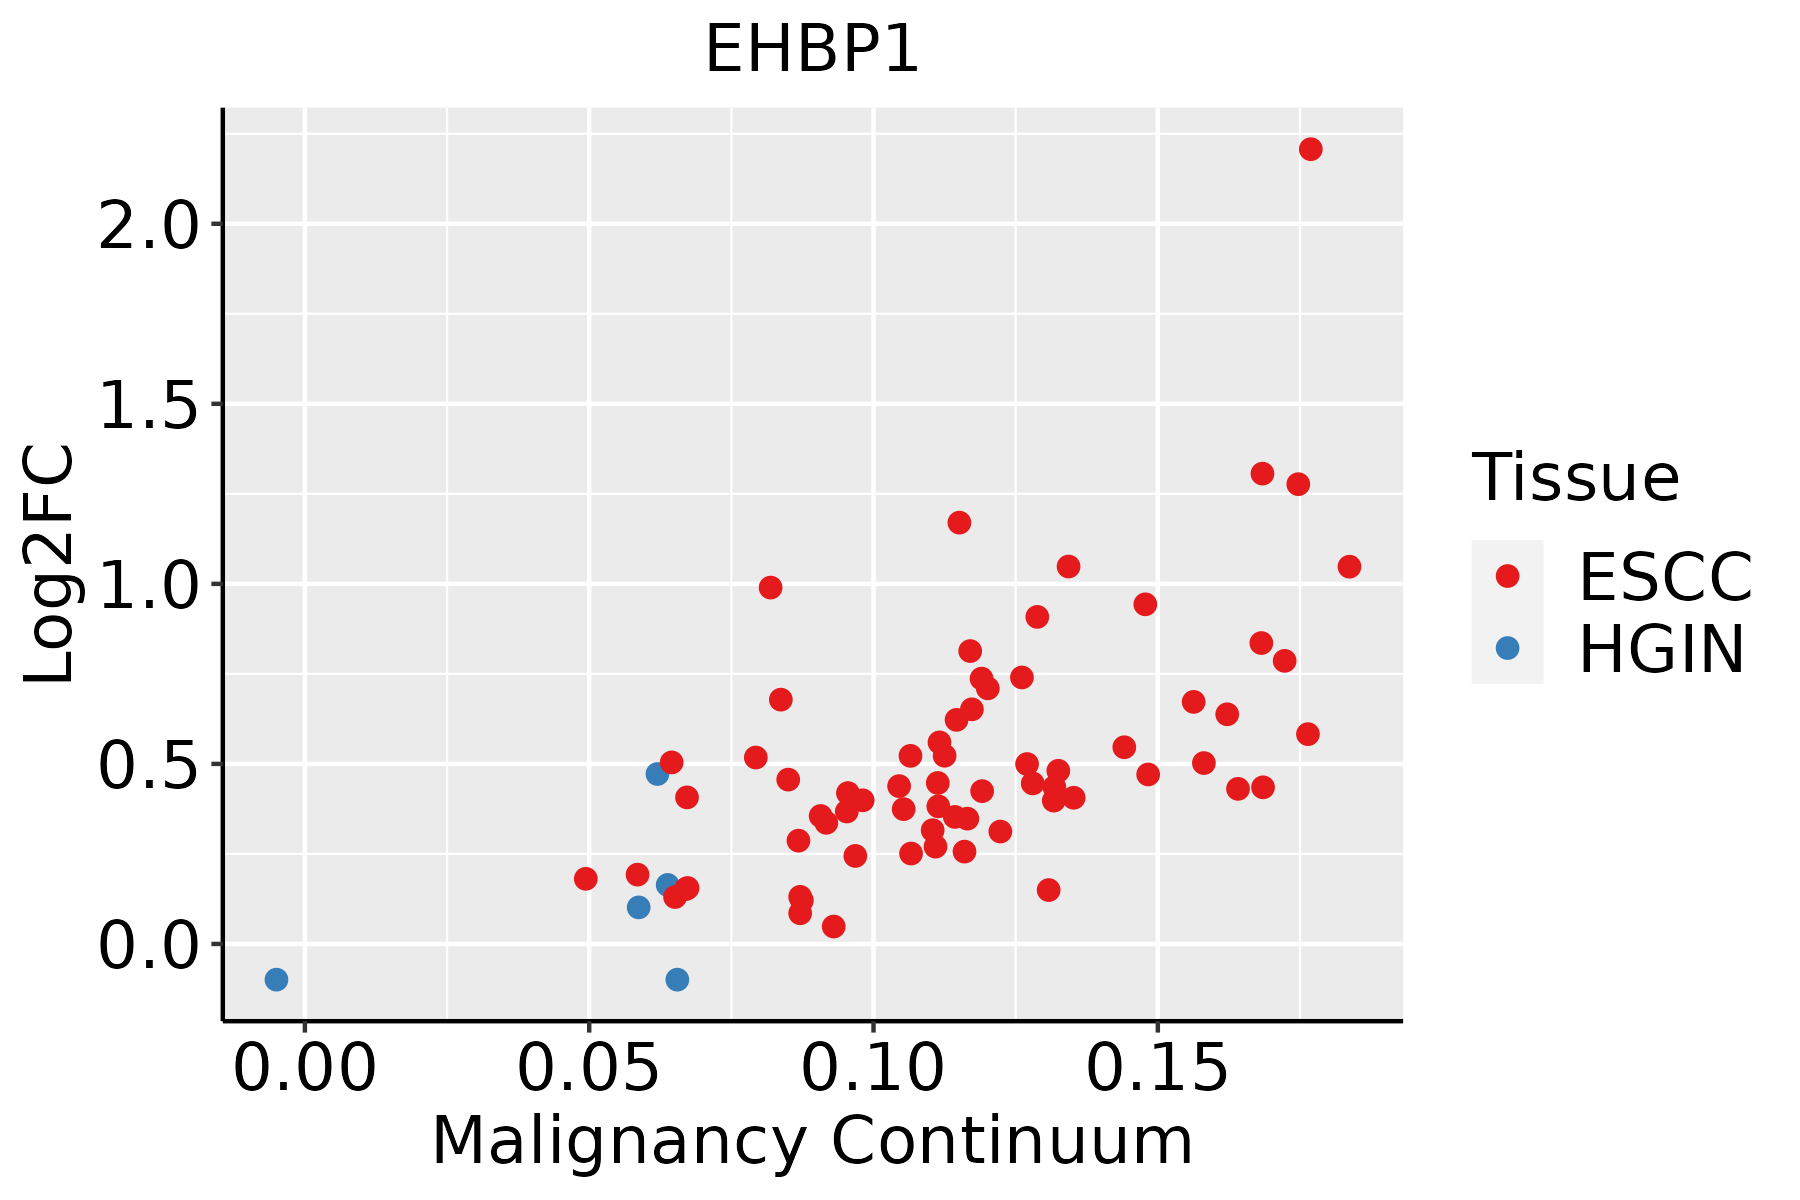 | ESCC: Esophageal squamous cell carcinoma |
| HGIN: High-grade intraepithelial neoplasias | ||
| LGIN: Low-grade intraepithelial neoplasias | ||
| Liver | 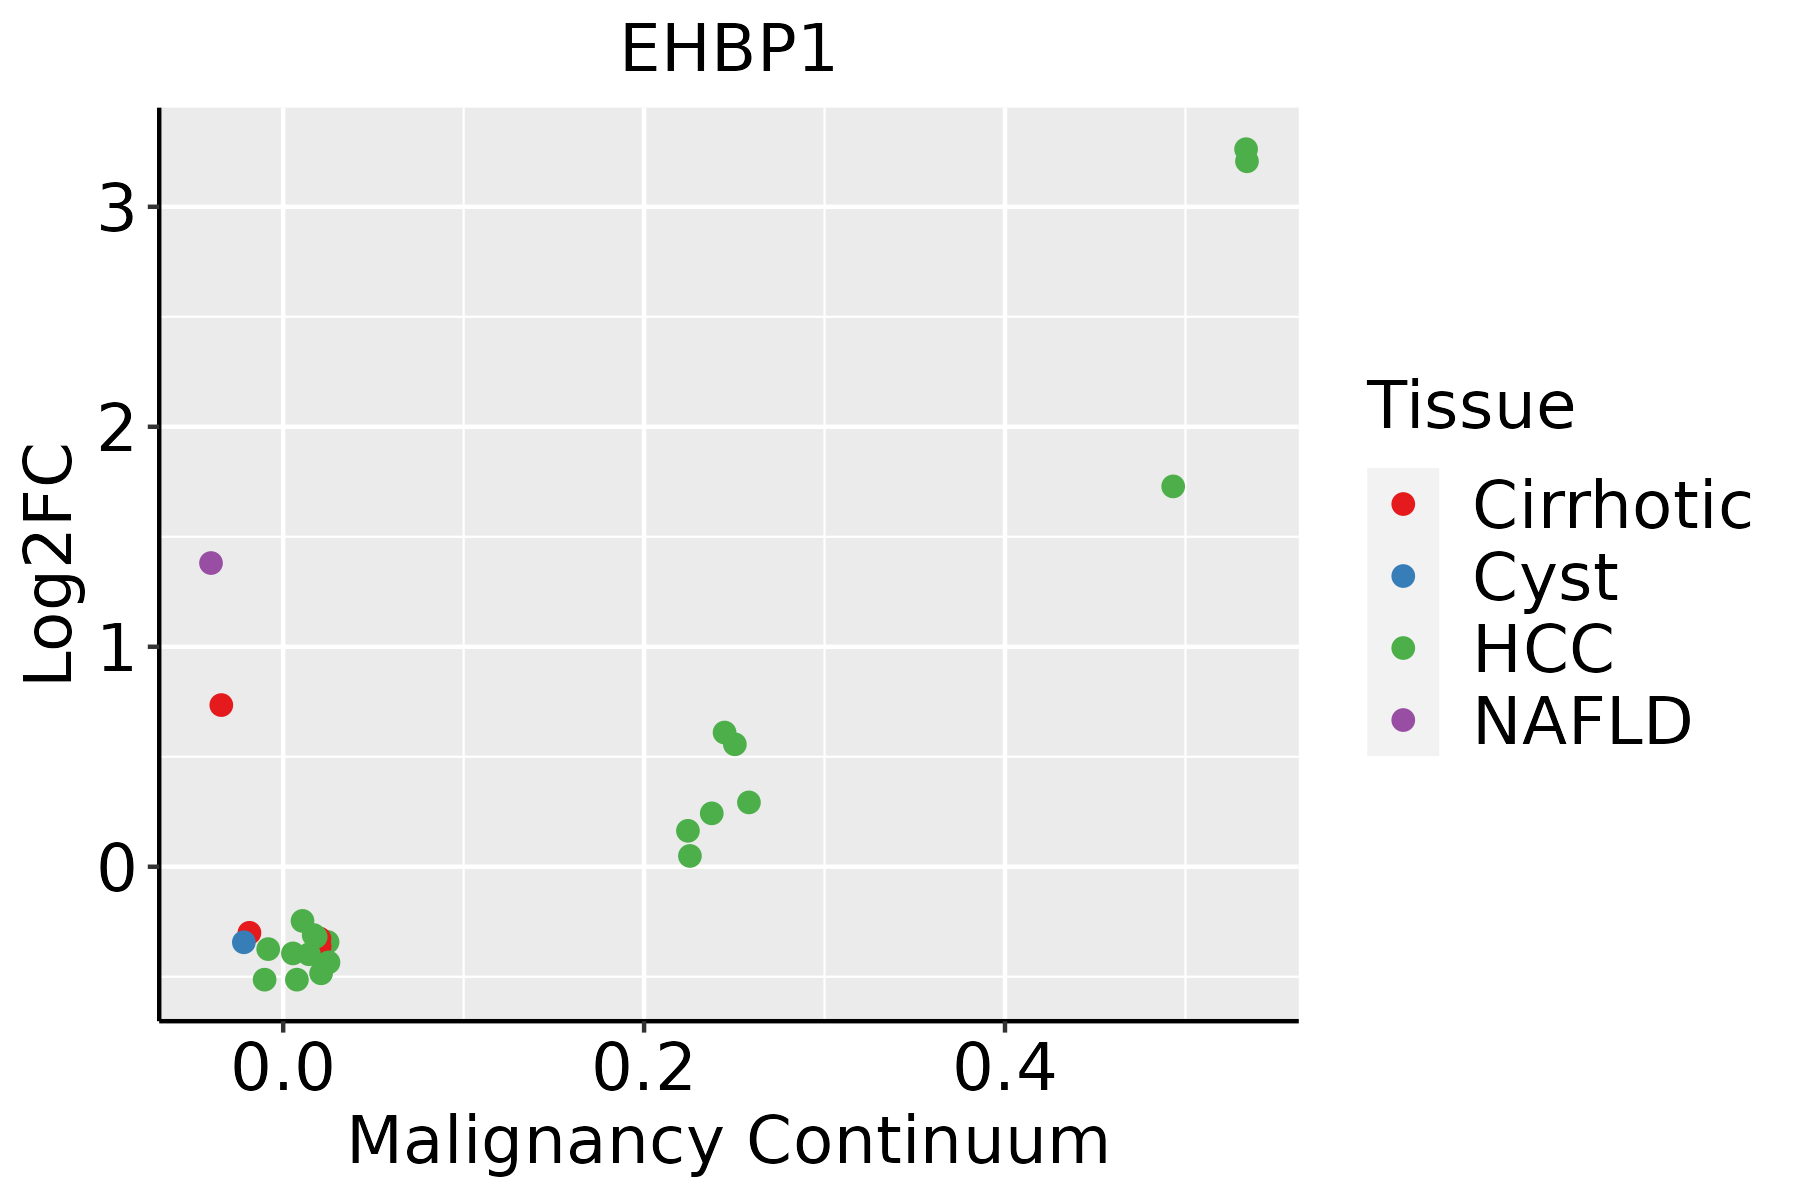 | HCC: Hepatocellular carcinoma |
| NAFLD: Non-alcoholic fatty liver disease | ||
| Lung | 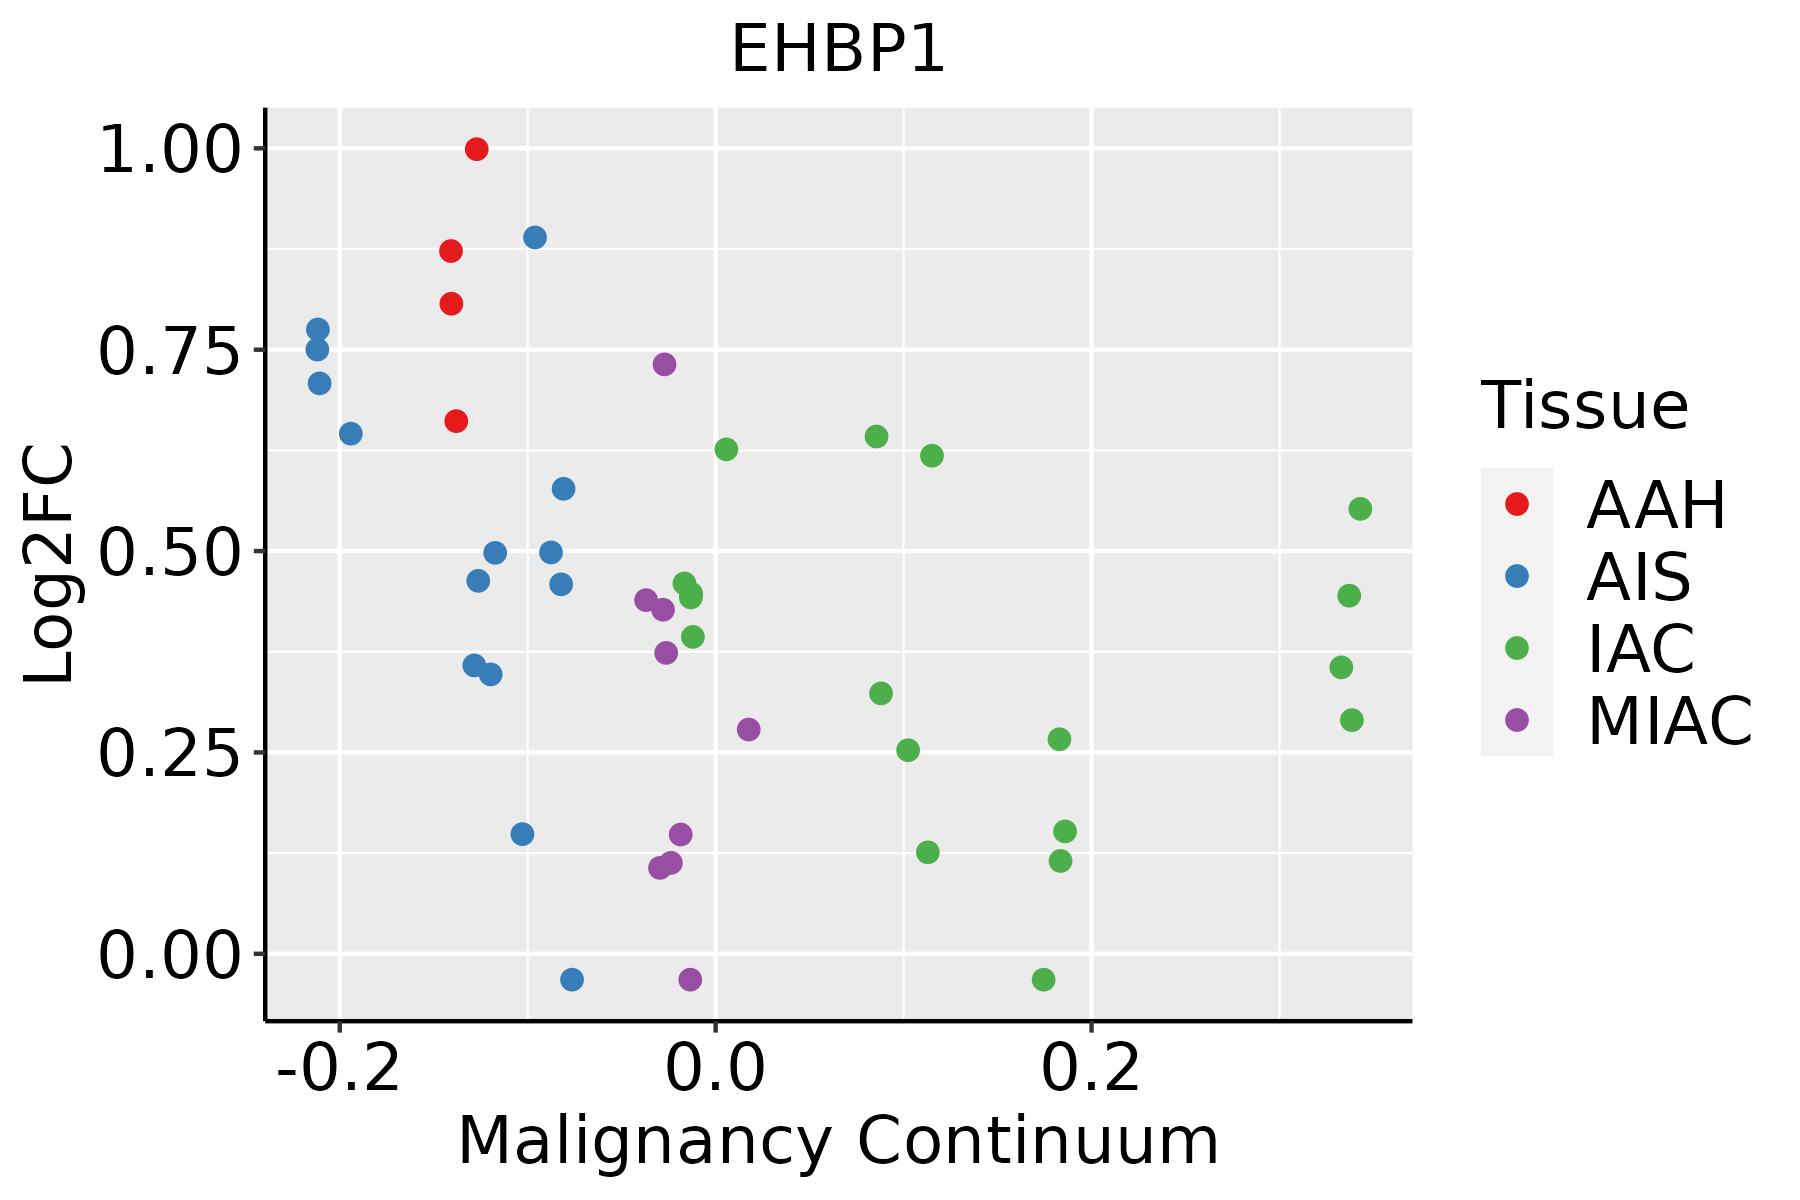 | AAH: Atypical adenomatous hyperplasia |
| AIS: Adenocarcinoma in situ | ||
| IAC: Invasive lung adenocarcinoma | ||
| MIA: Minimally invasive adenocarcinoma | ||
| Oral Cavity | 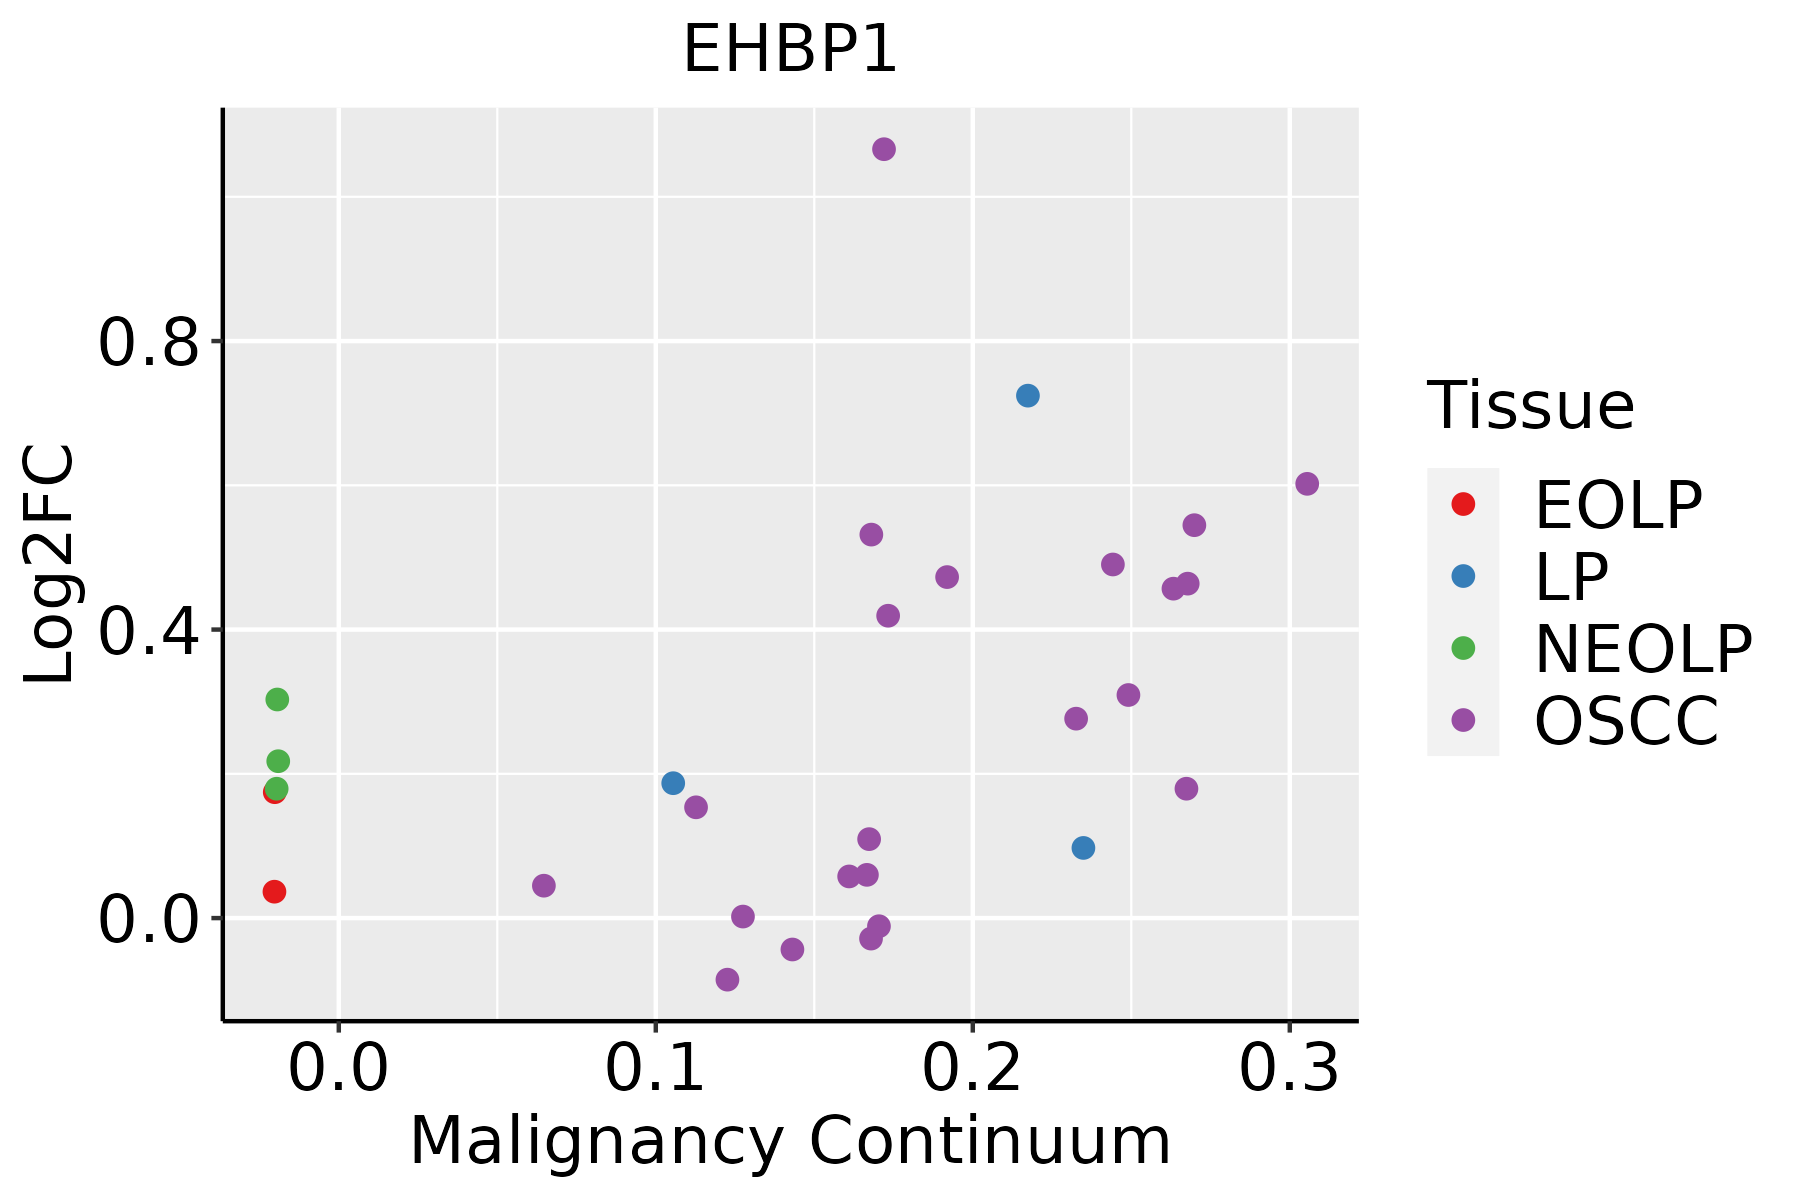 | EOLP: Erosive Oral lichen planus |
| LP: leukoplakia | ||
| NEOLP: Non-erosive oral lichen planus | ||
| OSCC: Oral squamous cell carcinoma | ||
| Skin | 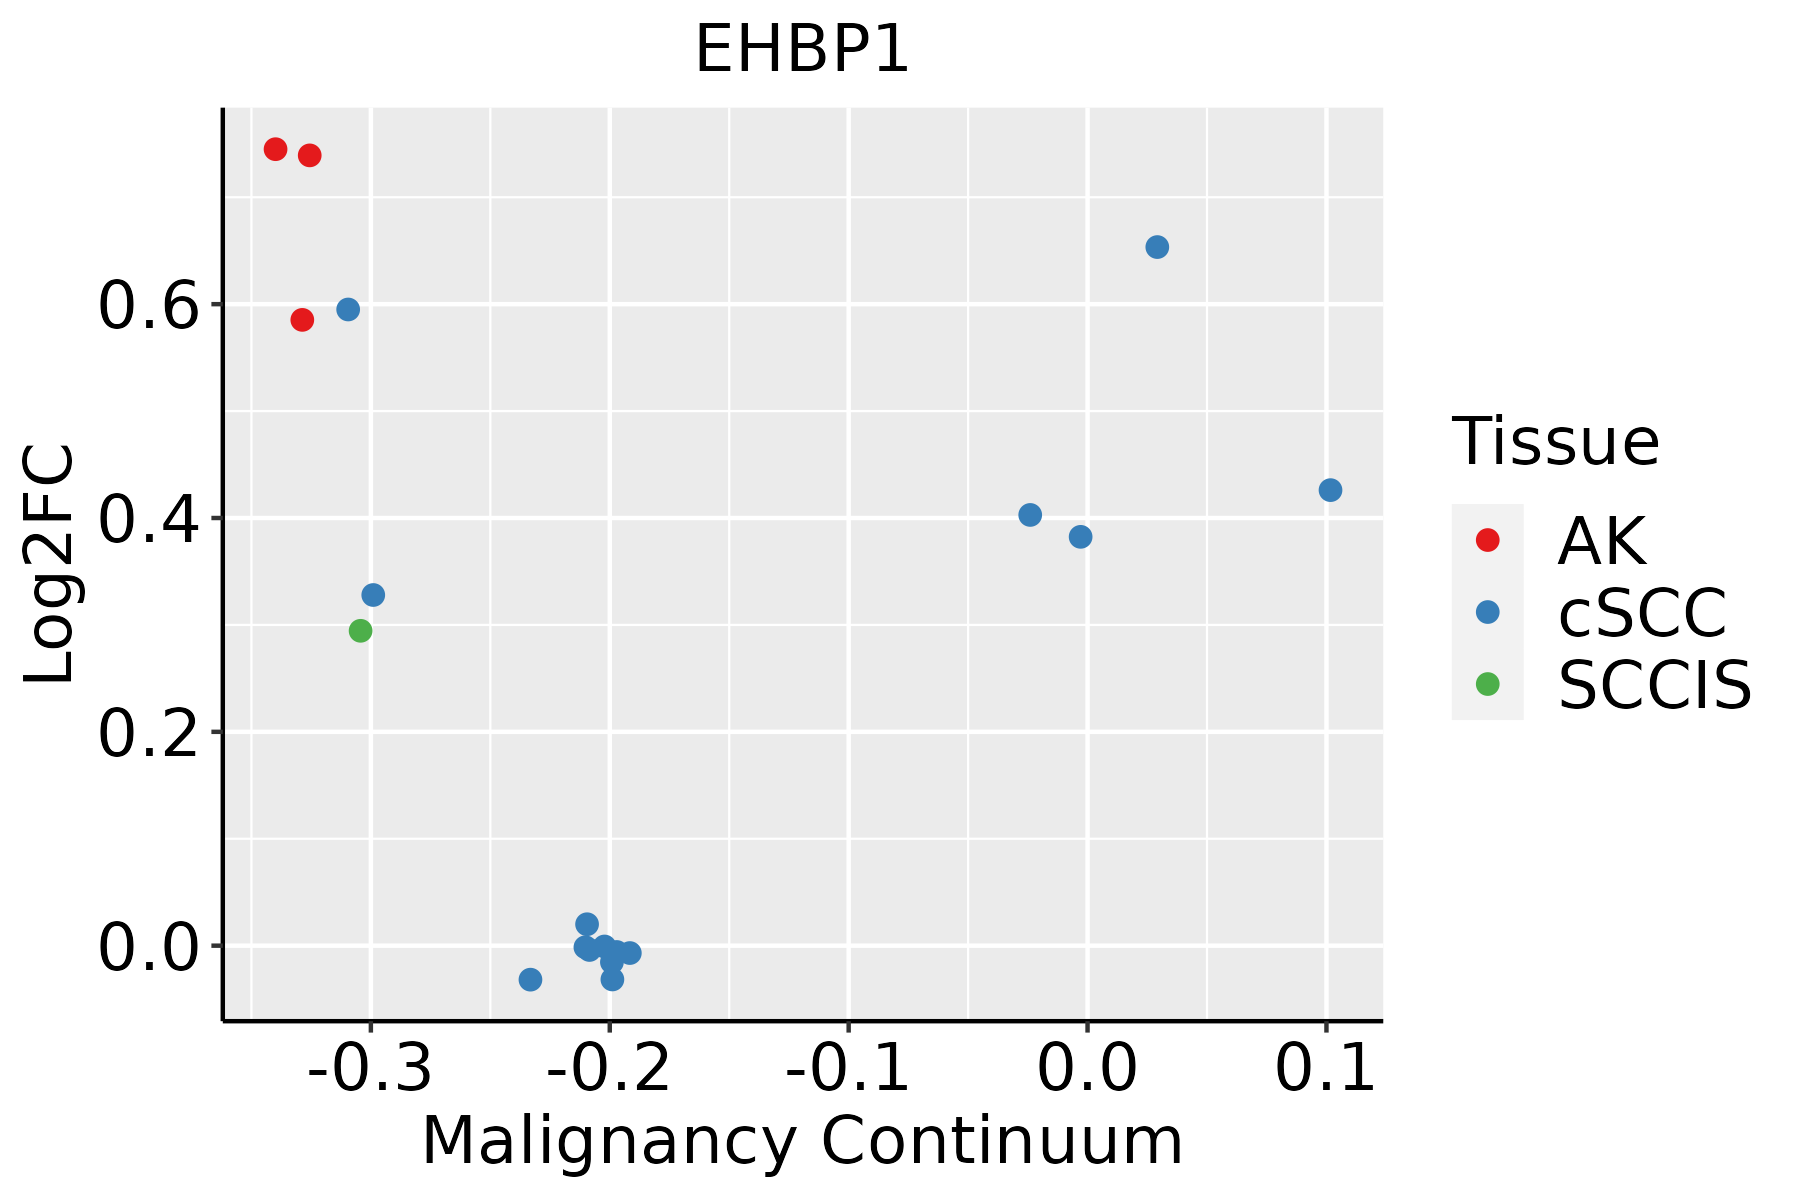 | AK: Actinic keratosis |
| cSCC: Cutaneous squamous cell carcinoma | ||
| SCCIS:squamous cell carcinoma in situ | ||
| Thyroid | 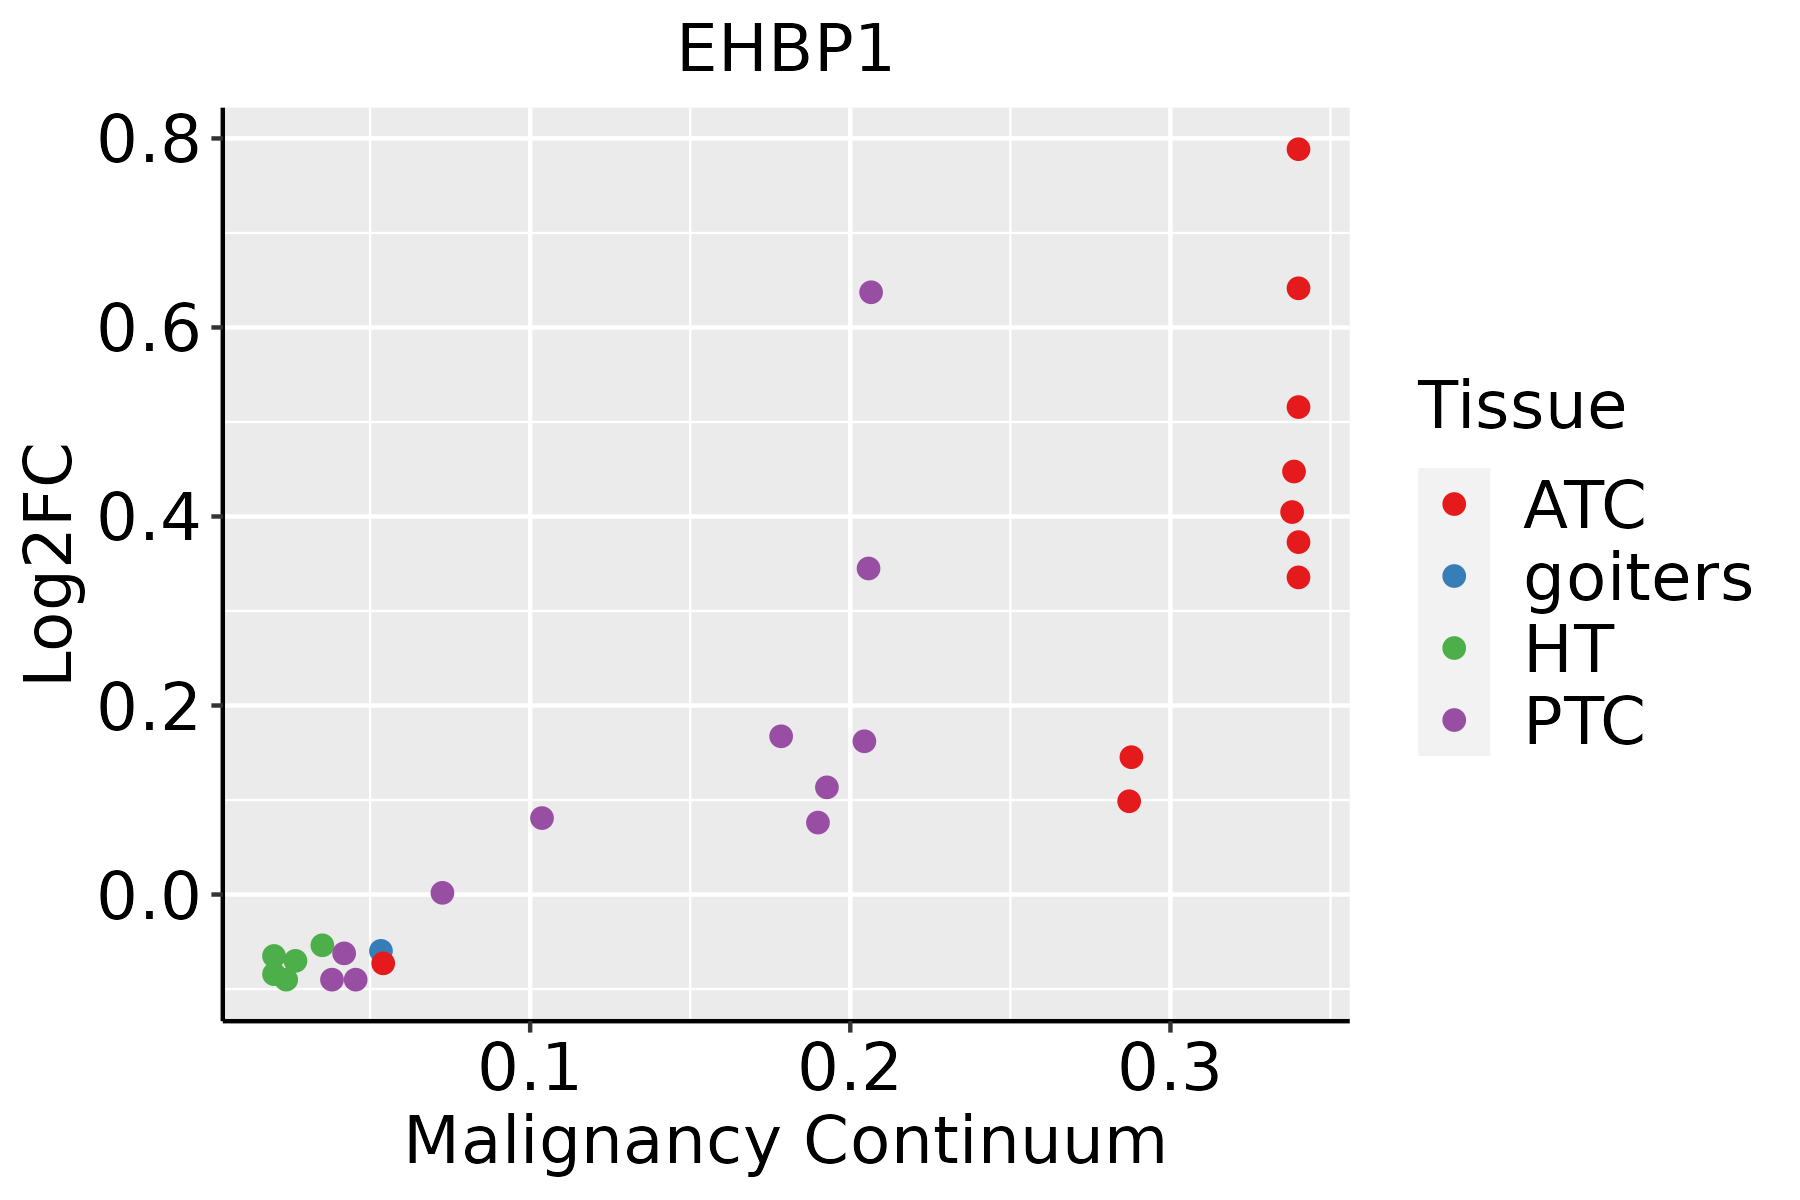 | ATC: Anaplastic thyroid cancer |
| HT: Hashimoto's thyroiditis | ||
| PTC: Papillary thyroid cancer |
| ∗log2FC in expression of this searched gene in stem-like cells from each diseased tissue sample relative to stem-like cells in normal samples in each tissue plotted against the malignancy continuum. Samples are colored based on if they are from different disease stage. |
Top |
Malignant transformation related pathway analysis |
| Find out the enriched GO biological processes and KEGG pathways involved in transition from healthy to precancer to cancer |
| Tissue | Disease Stage | Enriched GO biological Processes |
| Colorectum | AD |  |
| Colorectum | SER |  |
| Colorectum | MSS |  |
| Colorectum | MSI-H |  |
| Colorectum | FAP |  |
| ∗Top 15 enriched GO BP terms are showed in the bar plot of each disease state in each tissue. Each row represents a significant GO biological process which is colored according to the -log10(p.adjust). |
| Page: 1 2 3 4 5 6 7 8 9 |
| GO ID | Tissue | Disease Stage | Description | Gene Ratio | Bg Ratio | pvalue | p.adjust | Count |
| Page: 1 |
| Pathway ID | Tissue | Disease Stage | Description | Gene Ratio | Bg Ratio | pvalue | p.adjust | qvalue | Count |
| Page: 1 |
Top |
Cell-cell communication analysis |
| Identification of potential cell-cell interactions between two cell types and their ligand-receptor pairs for different disease states |
| Ligand | Receptor | LRpair | Pathway | Tissue | Disease Stage |
| Page: 1 |
Top |
Single-cell gene regulatory network inference analysis |
| Find out the significant the regulons (TFs) and the target genes of each regulon across cell types for different disease states |
| TF | Cell Type | Tissue | Disease Stage | Target Gene | RSS | Regulon Activity |
| ∗The dot plots of a searched regulon are shown for all cell subpopulations in each disease state of each tissue based on the regulon specific score inferred using pySCENIC and by calculating the average expression. |
| Page: 1 |
Top |
Somatic mutation of malignant transformation related genes |
| Annotation of somatic variants for genes involved in malignant transformation |
| Hugo Symbol | Variant Class | Variant Classification | dbSNP RS | HGVSc | HGVSp | HGVSp Short | SWISSPROT | BIOTYPE | SIFT | PolyPhen | Tumor Sample Barcode | Tissue | Histology | Sex | Age | Stage | Therapy Types | Drugs | Outcome |
| EHBP1 | SNV | Missense_Mutation | novel | c.289G>C | p.Glu97Gln | p.E97Q | Q8NDI1 | protein_coding | deleterious(0) | probably_damaging(0.995) | TCGA-5L-AAT1-01 | Breast | breast invasive carcinoma | Female | <65 | III/IV | Hormone Therapy | letrozol | SD |
| EHBP1 | SNV | Missense_Mutation | novel | c.1392N>C | p.Lys464Asn | p.K464N | Q8NDI1 | protein_coding | deleterious(0) | probably_damaging(0.999) | TCGA-AN-A046-01 | Breast | breast invasive carcinoma | Female | >=65 | I/II | Unknown | Unknown | SD |
| EHBP1 | SNV | Missense_Mutation | novel | c.1141N>G | p.Pro381Ala | p.P381A | Q8NDI1 | protein_coding | tolerated(0.81) | benign(0.021) | TCGA-AO-A0JD-01 | Breast | breast invasive carcinoma | Female | <65 | III/IV | Chemotherapy | cyclophosphamide | SD |
| EHBP1 | SNV | Missense_Mutation | c.469N>T | p.Ile157Phe | p.I157F | Q8NDI1 | protein_coding | deleterious(0) | probably_damaging(0.998) | TCGA-B6-A0IN-01 | Breast | breast invasive carcinoma | Female | <65 | I/II | Unknown | Unknown | PD | |
| EHBP1 | SNV | Missense_Mutation | novel | c.65N>T | p.Ala22Val | p.A22V | Q8NDI1 | protein_coding | deleterious(0.01) | possibly_damaging(0.902) | TCGA-BH-A0HF-01 | Breast | breast invasive carcinoma | Female | >=65 | I/II | Hormone Therapy | arimidex | SD |
| EHBP1 | SNV | Missense_Mutation | novel | c.3236N>A | p.Ala1079Glu | p.A1079E | Q8NDI1 | protein_coding | tolerated(0.23) | probably_damaging(0.999) | TCGA-C8-A274-01 | Breast | breast invasive carcinoma | Female | <65 | I/II | Hormone Therapy | tamoxiphen | SD |
| EHBP1 | SNV | Missense_Mutation | c.2923G>A | p.Glu975Lys | p.E975K | Q8NDI1 | protein_coding | tolerated(0.06) | benign(0.101) | TCGA-D8-A1JJ-01 | Breast | breast invasive carcinoma | Female | <65 | I/II | Chemotherapy | doxorubicine | SD | |
| EHBP1 | SNV | Missense_Mutation | c.1430N>G | p.Ser477Cys | p.S477C | Q8NDI1 | protein_coding | deleterious(0) | probably_damaging(0.989) | TCGA-E2-A14V-01 | Breast | breast invasive carcinoma | Female | <65 | I/II | Chemotherapy | cyclophosphamide | SD | |
| EHBP1 | SNV | Missense_Mutation | c.713C>T | p.Ser238Leu | p.S238L | Q8NDI1 | protein_coding | tolerated(0.07) | probably_damaging(0.966) | TCGA-GM-A2D9-01 | Breast | breast invasive carcinoma | Female | >=65 | I/II | Hormone Therapy | arimidex | SD | |
| EHBP1 | SNV | Missense_Mutation | novel | c.34N>C | p.Gly12Arg | p.G12R | Q8NDI1 | protein_coding | deleterious(0) | probably_damaging(0.998) | TCGA-LL-A8F5-01 | Breast | breast invasive carcinoma | Female | <65 | I/II | Chemotherapy | cyclophosphamide | SD |
| Page: 1 2 3 4 5 6 7 8 9 10 11 12 13 |
Top |
Related drugs of malignant transformation related genes |
| Identification of chemicals and drugs interact with genes involved in malignant transfromation |
| (DGIdb 4.0) |
| Entrez ID | Symbol | Category | Interaction Types | Drug Claim Name | Drug Name | PMIDs |
| Page: 1 |

Copyright 2023-Present -The University of Texas Health Science Center at Houston |