
|
|||||
|
 | |
| |
| |
| |
| |
| |
|
Gene: EFCAB14 |
Gene summary for EFCAB14 |
| Gene information | Species | Human | Gene symbol | EFCAB14 | Gene ID | 9813 |
| Gene name | EF-hand calcium binding domain 14 | |
| Gene Alias | KIAA0494 | |
| Cytomap | 1p33 | |
| Gene Type | protein-coding | GO ID | GO:0003674 | UniProtAcc | O75071 |
Top |
Malignant transformation analysis |
| Identification of the aberrant gene expression in precancerous and cancerous lesions by comparing the gene expression of stem-like cells in diseased tissues with normal stem cells |
| Entrez ID | Symbol | Replicates | Species | Organ | Tissue | Adj P-value | Log2FC | Malignancy |
| 9813 | EFCAB14 | P56T-E | Human | Esophagus | ESCC | 2.35e-09 | 9.95e-01 | 0.1613 |
| 9813 | EFCAB14 | P57T-E | Human | Esophagus | ESCC | 1.11e-20 | 3.67e-01 | 0.0926 |
| 9813 | EFCAB14 | P61T-E | Human | Esophagus | ESCC | 7.40e-18 | 4.15e-01 | 0.099 |
| 9813 | EFCAB14 | P62T-E | Human | Esophagus | ESCC | 1.08e-41 | 7.74e-01 | 0.1302 |
| 9813 | EFCAB14 | P65T-E | Human | Esophagus | ESCC | 3.03e-19 | 3.02e-01 | 0.0978 |
| 9813 | EFCAB14 | P74T-E | Human | Esophagus | ESCC | 5.37e-16 | 4.28e-01 | 0.1479 |
| 9813 | EFCAB14 | P75T-E | Human | Esophagus | ESCC | 4.81e-26 | 5.58e-01 | 0.1125 |
| 9813 | EFCAB14 | P76T-E | Human | Esophagus | ESCC | 4.58e-12 | 1.82e-01 | 0.1207 |
| 9813 | EFCAB14 | P79T-E | Human | Esophagus | ESCC | 3.27e-17 | 3.19e-01 | 0.1154 |
| 9813 | EFCAB14 | P80T-E | Human | Esophagus | ESCC | 4.69e-19 | 6.14e-01 | 0.155 |
| 9813 | EFCAB14 | P82T-E | Human | Esophagus | ESCC | 3.91e-18 | 8.32e-01 | 0.1072 |
| 9813 | EFCAB14 | P83T-E | Human | Esophagus | ESCC | 2.00e-16 | 4.96e-01 | 0.1738 |
| 9813 | EFCAB14 | P84T-E | Human | Esophagus | ESCC | 4.96e-04 | 2.98e-01 | 0.0933 |
| 9813 | EFCAB14 | P89T-E | Human | Esophagus | ESCC | 7.65e-10 | 4.48e-01 | 0.1752 |
| 9813 | EFCAB14 | P91T-E | Human | Esophagus | ESCC | 4.92e-13 | 1.06e+00 | 0.1828 |
| 9813 | EFCAB14 | P94T-E | Human | Esophagus | ESCC | 4.41e-03 | 4.28e-01 | 0.0879 |
| 9813 | EFCAB14 | P104T-E | Human | Esophagus | ESCC | 1.35e-03 | 4.79e-01 | 0.0931 |
| 9813 | EFCAB14 | P107T-E | Human | Esophagus | ESCC | 2.04e-26 | 5.02e-01 | 0.171 |
| 9813 | EFCAB14 | P126T-E | Human | Esophagus | ESCC | 2.67e-10 | 8.43e-01 | 0.1125 |
| 9813 | EFCAB14 | P127T-E | Human | Esophagus | ESCC | 6.29e-32 | 4.97e-01 | 0.0826 |
| Page: 1 2 3 4 5 6 7 8 |
| Tissue | Expression Dynamics | Abbreviation |
| Colorectum (GSE201348) |  | FAP: Familial adenomatous polyposis |
| CRC: Colorectal cancer | ||
| Colorectum (HTA11) |  | AD: Adenomas |
| SER: Sessile serrated lesions | ||
| MSI-H: Microsatellite-high colorectal cancer | ||
| MSS: Microsatellite stable colorectal cancer | ||
| Esophagus | 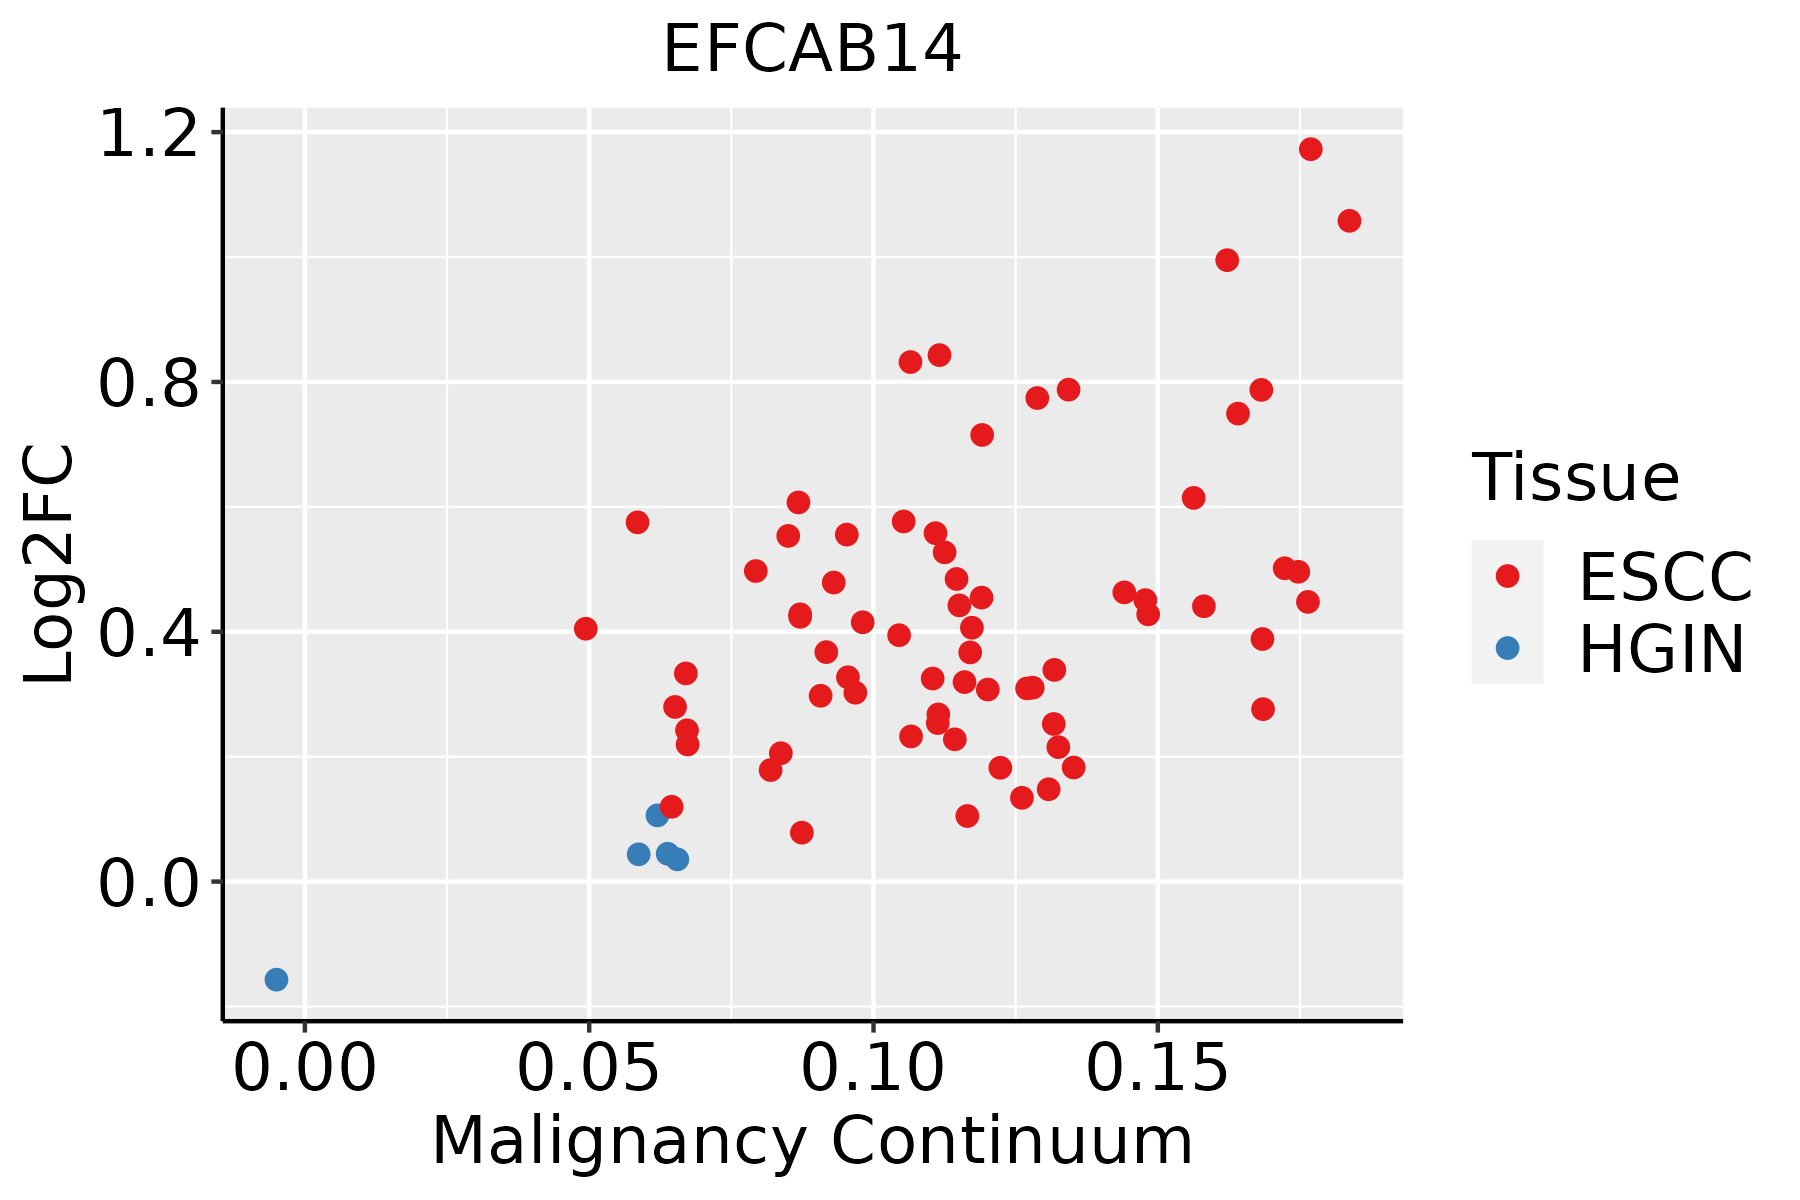 | ESCC: Esophageal squamous cell carcinoma |
| HGIN: High-grade intraepithelial neoplasias | ||
| LGIN: Low-grade intraepithelial neoplasias | ||
| Liver |  | HCC: Hepatocellular carcinoma |
| NAFLD: Non-alcoholic fatty liver disease | ||
| Oral Cavity | 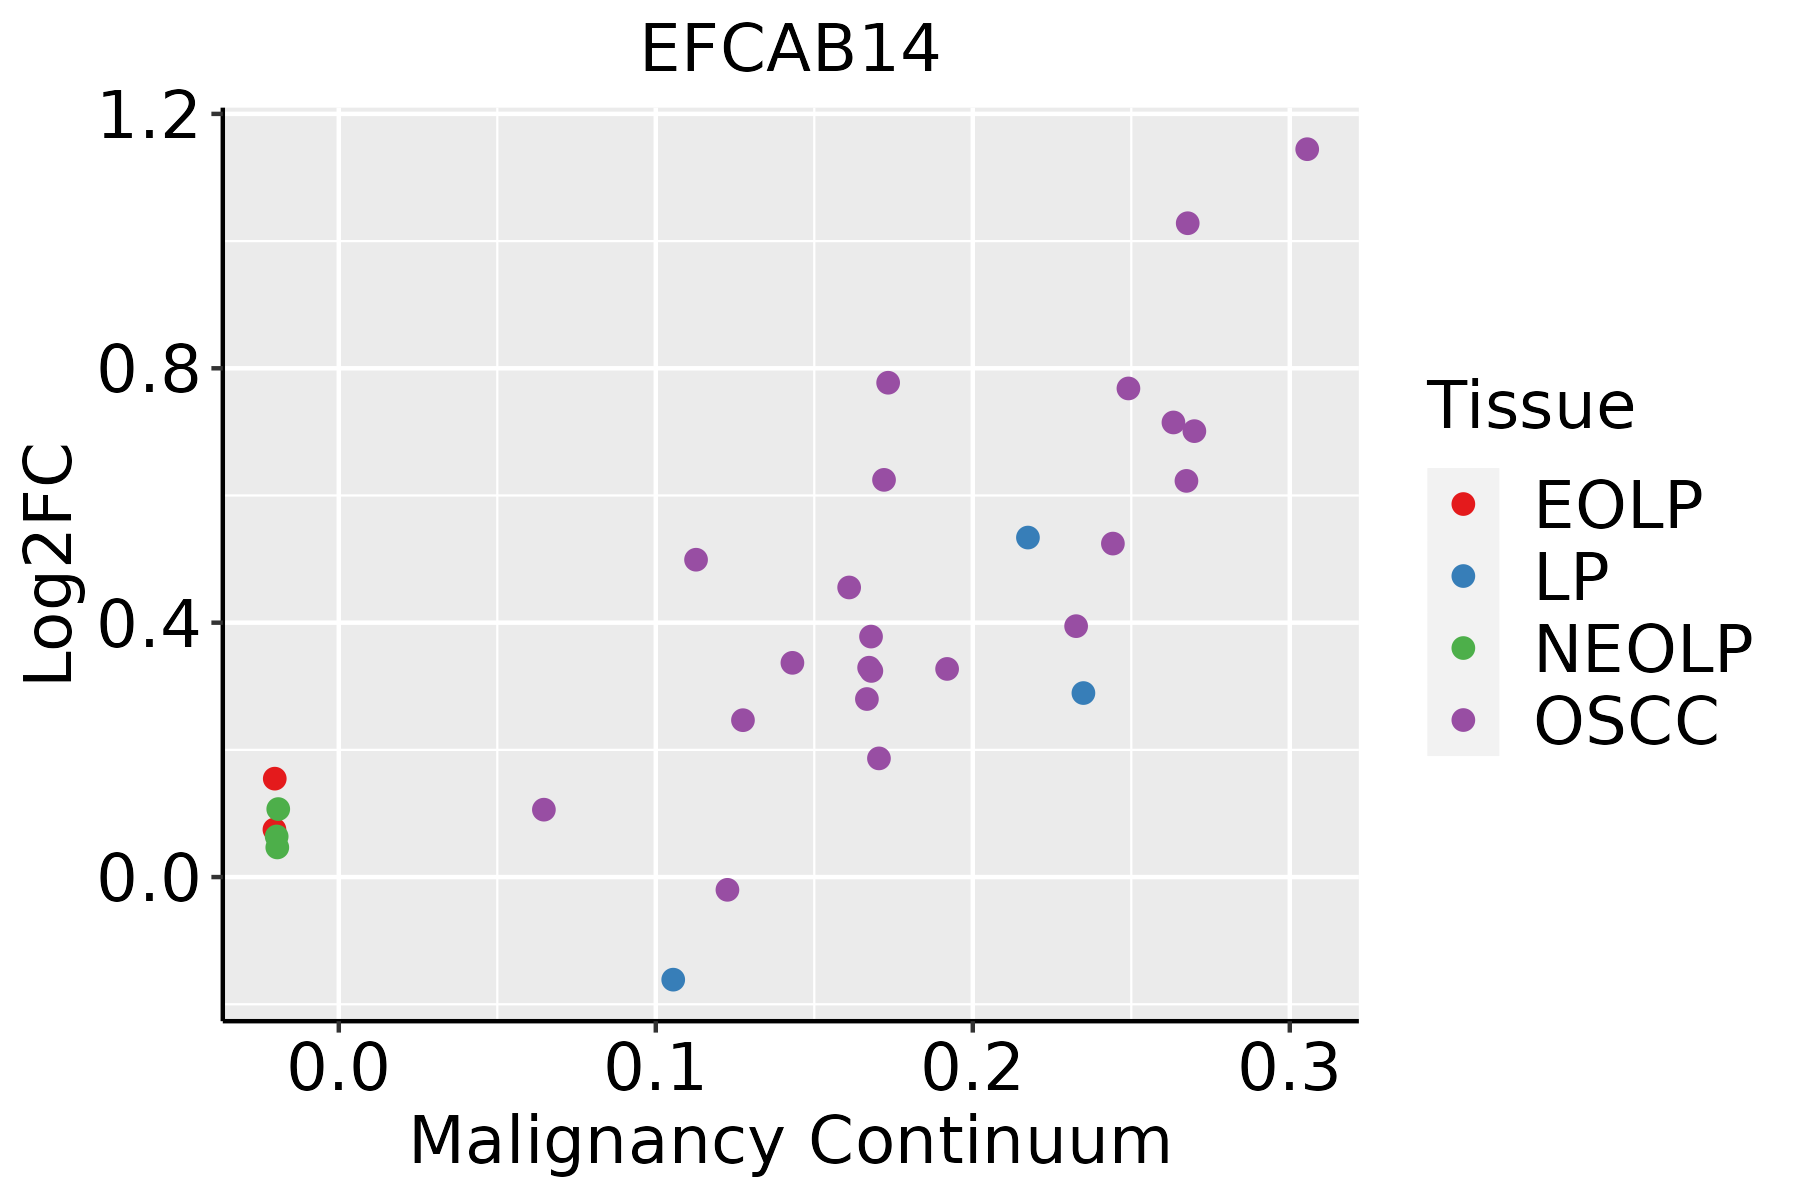 | EOLP: Erosive Oral lichen planus |
| LP: leukoplakia | ||
| NEOLP: Non-erosive oral lichen planus | ||
| OSCC: Oral squamous cell carcinoma | ||
| Prostate | 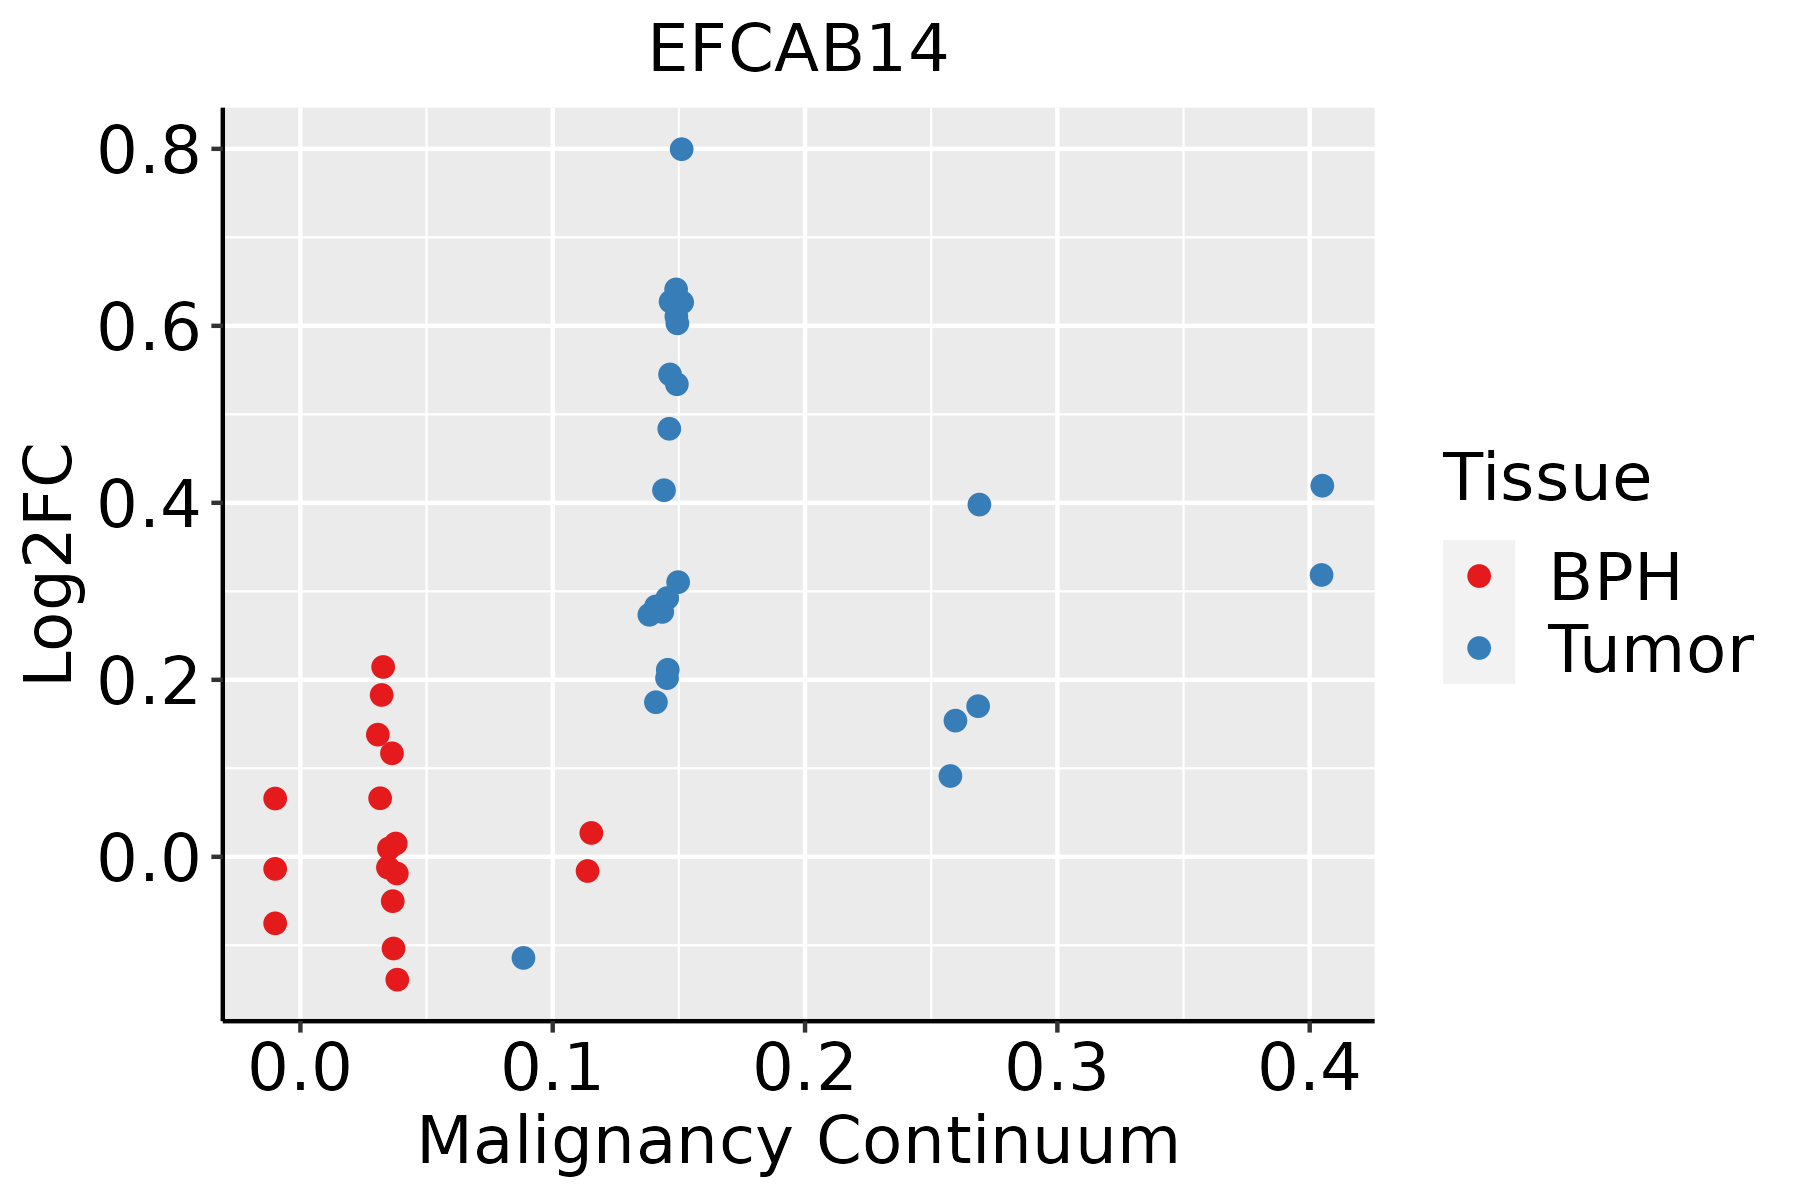 | BPH: Benign Prostatic Hyperplasia |
| Skin | 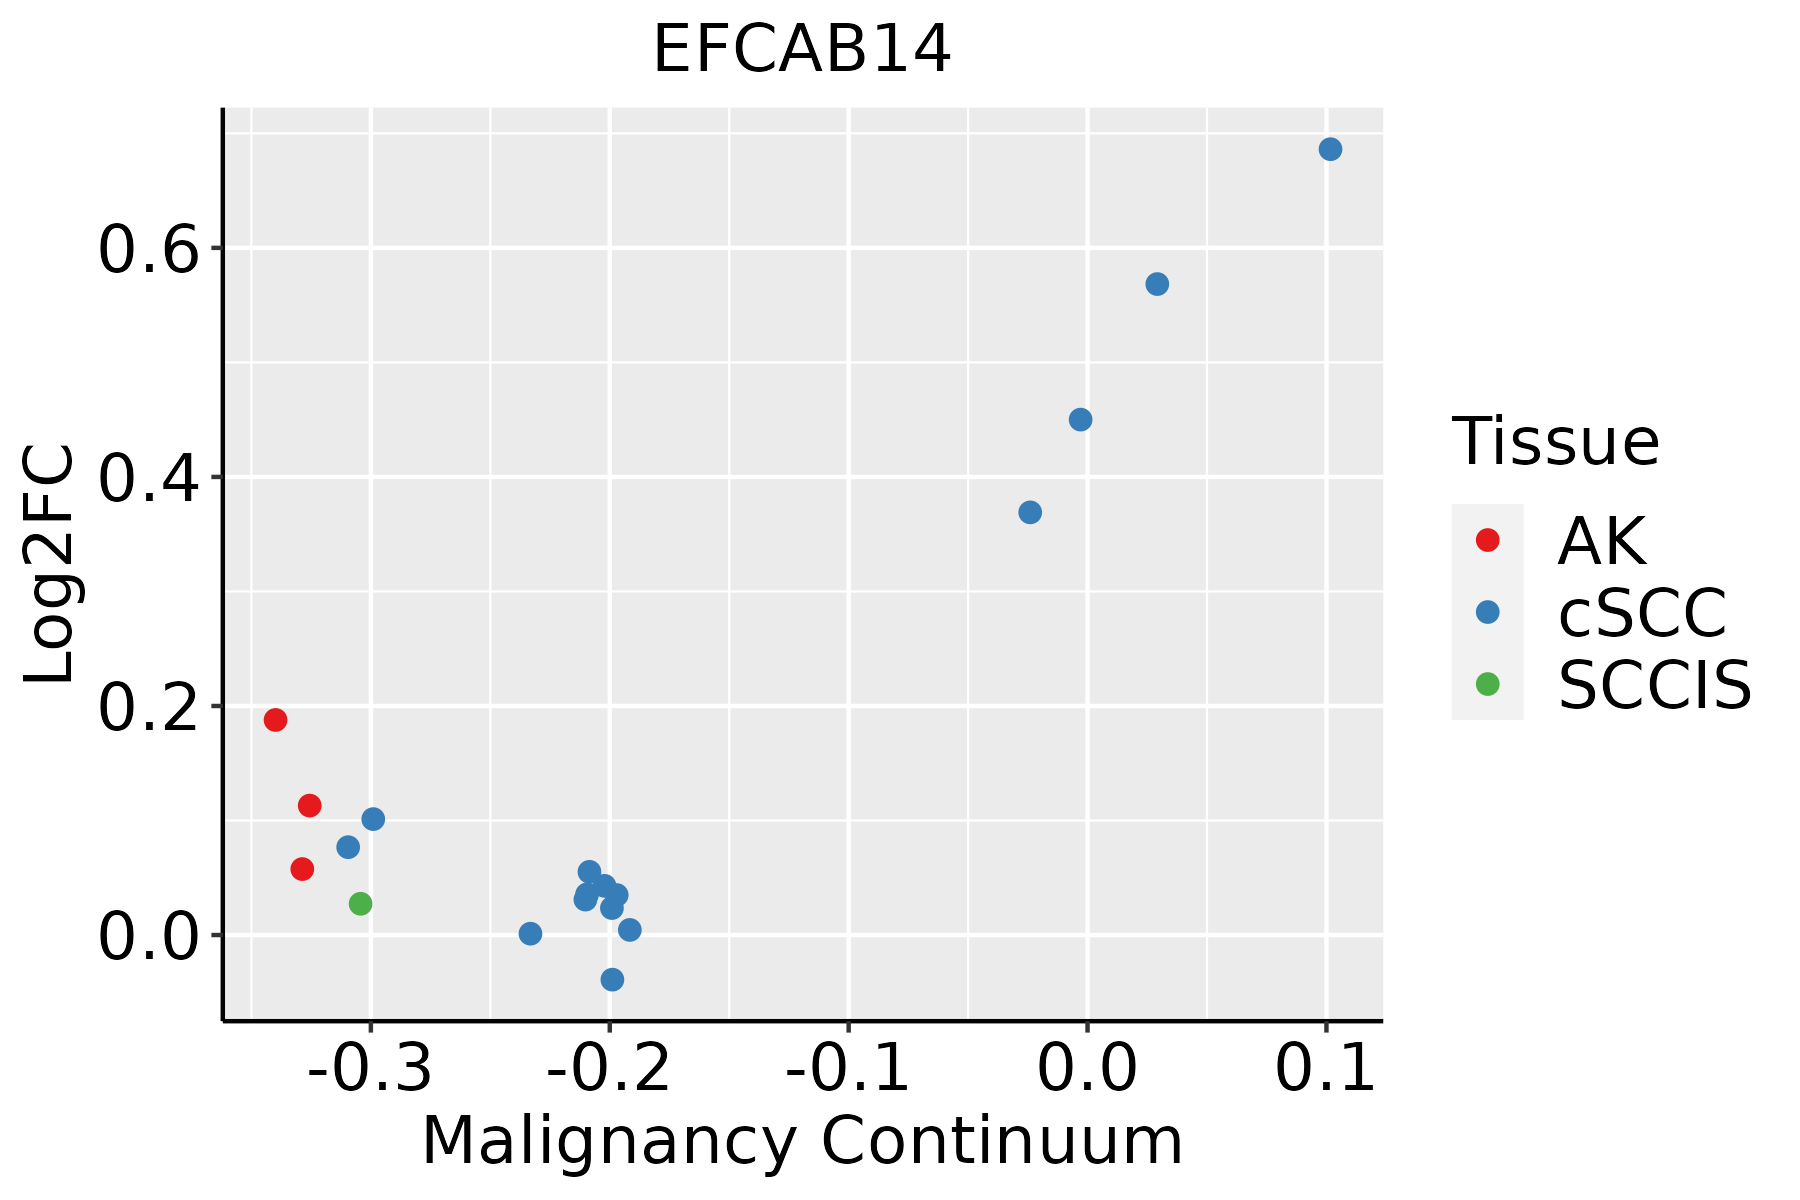 | AK: Actinic keratosis |
| cSCC: Cutaneous squamous cell carcinoma | ||
| SCCIS:squamous cell carcinoma in situ | ||
| Thyroid | 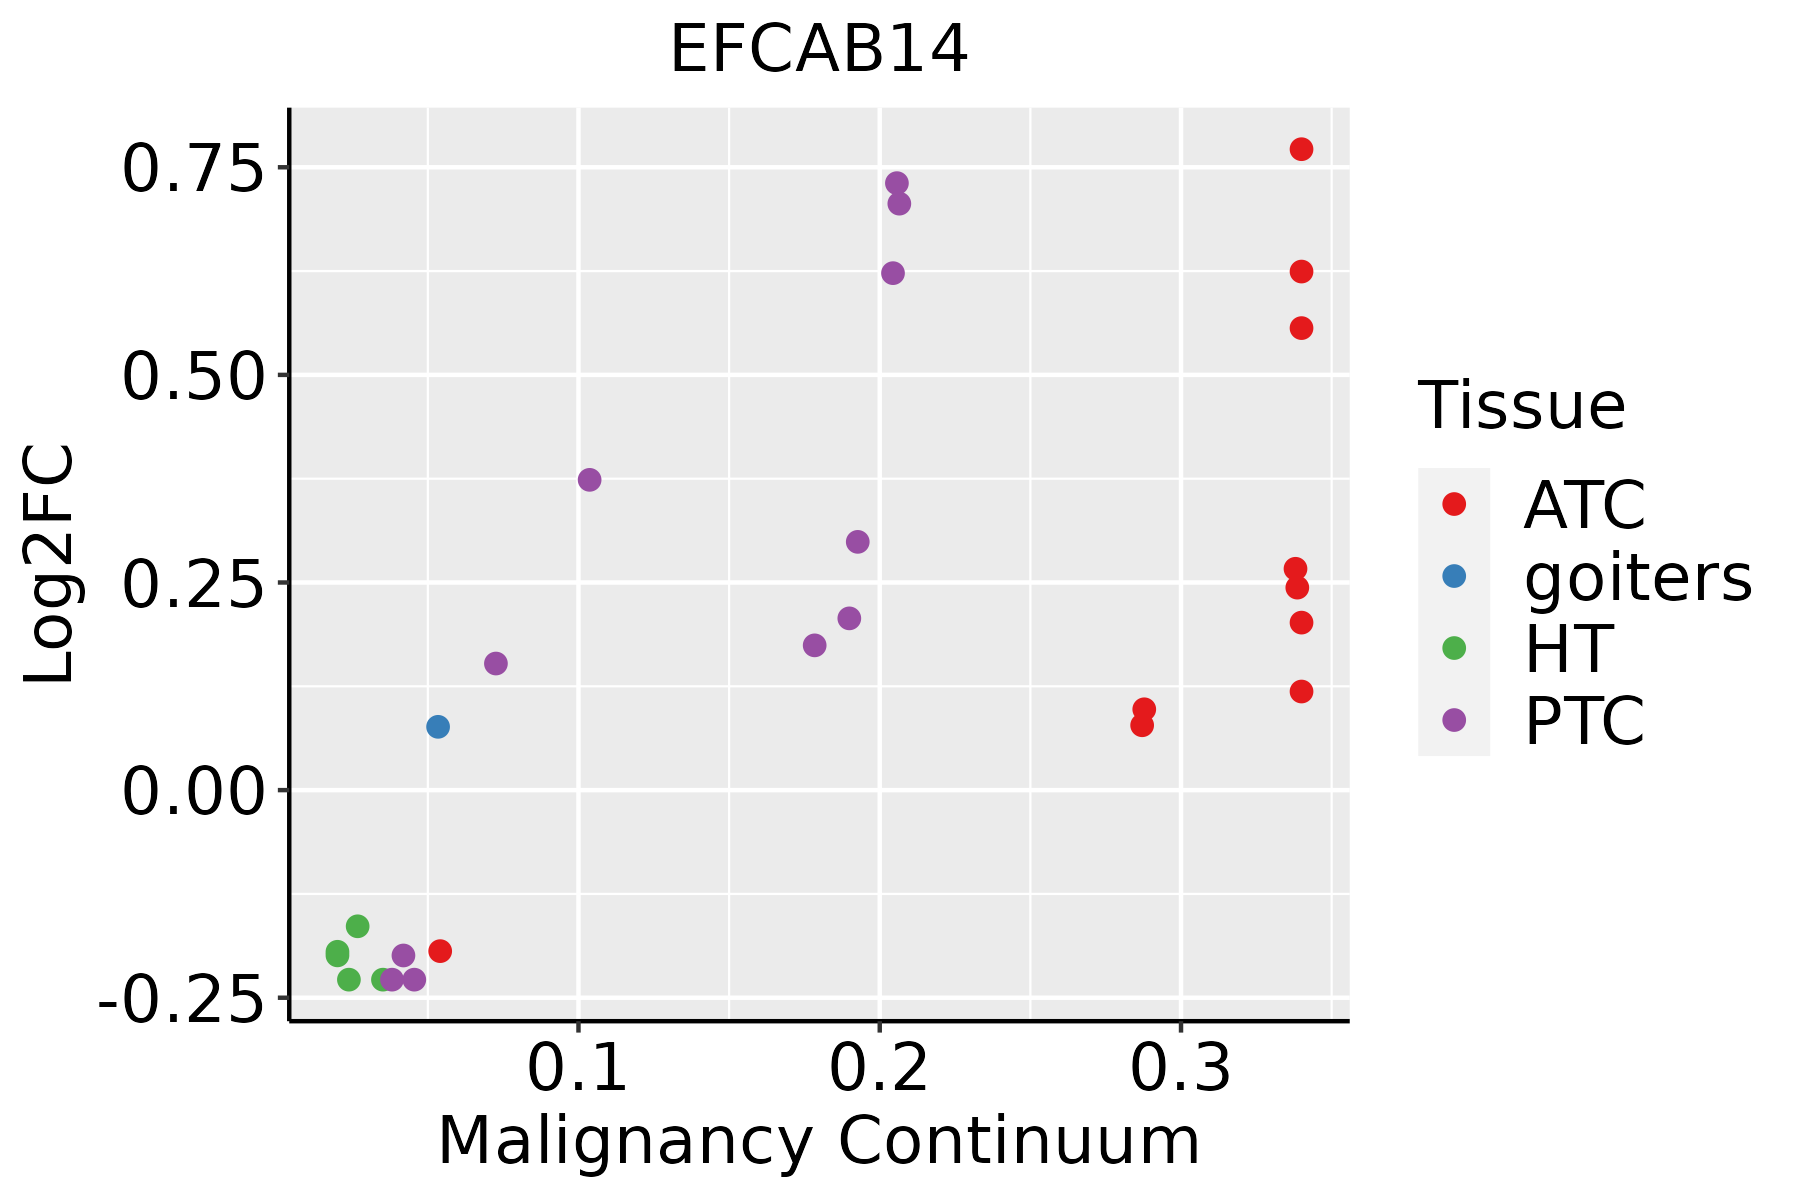 | ATC: Anaplastic thyroid cancer |
| HT: Hashimoto's thyroiditis | ||
| PTC: Papillary thyroid cancer |
| ∗log2FC in expression of this searched gene in stem-like cells from each diseased tissue sample relative to stem-like cells in normal samples in each tissue plotted against the malignancy continuum. Samples are colored based on if they are from different disease stage. |
Top |
Malignant transformation related pathway analysis |
| Find out the enriched GO biological processes and KEGG pathways involved in transition from healthy to precancer to cancer |
| Tissue | Disease Stage | Enriched GO biological Processes |
| Colorectum | AD |  |
| Colorectum | SER |  |
| Colorectum | MSS |  |
| Colorectum | MSI-H |  |
| Colorectum | FAP |  |
| ∗Top 15 enriched GO BP terms are showed in the bar plot of each disease state in each tissue. Each row represents a significant GO biological process which is colored according to the -log10(p.adjust). |
| Page: 1 2 3 4 5 6 7 8 9 |
| GO ID | Tissue | Disease Stage | Description | Gene Ratio | Bg Ratio | pvalue | p.adjust | Count |
| Page: 1 |
| Pathway ID | Tissue | Disease Stage | Description | Gene Ratio | Bg Ratio | pvalue | p.adjust | qvalue | Count |
| Page: 1 |
Top |
Cell-cell communication analysis |
| Identification of potential cell-cell interactions between two cell types and their ligand-receptor pairs for different disease states |
| Ligand | Receptor | LRpair | Pathway | Tissue | Disease Stage |
| Page: 1 |
Top |
Single-cell gene regulatory network inference analysis |
| Find out the significant the regulons (TFs) and the target genes of each regulon across cell types for different disease states |
| TF | Cell Type | Tissue | Disease Stage | Target Gene | RSS | Regulon Activity |
| ∗The dot plots of a searched regulon are shown for all cell subpopulations in each disease state of each tissue based on the regulon specific score inferred using pySCENIC and by calculating the average expression. |
| Page: 1 |
Top |
Somatic mutation of malignant transformation related genes |
| Annotation of somatic variants for genes involved in malignant transformation |
| Hugo Symbol | Variant Class | Variant Classification | dbSNP RS | HGVSc | HGVSp | HGVSp Short | SWISSPROT | BIOTYPE | SIFT | PolyPhen | Tumor Sample Barcode | Tissue | Histology | Sex | Age | Stage | Therapy Types | Drugs | Outcome |
| EFCAB14 | SNV | Missense_Mutation | c.1331N>T | p.Arg444Leu | p.R444L | O75071 | protein_coding | tolerated(0.45) | benign(0.001) | TCGA-A1-A0SI-01 | Breast | breast invasive carcinoma | Female | <65 | I/II | Unknown | Unknown | SD | |
| EFCAB14 | SNV | Missense_Mutation | novel | c.1213N>G | p.Pro405Ala | p.P405A | O75071 | protein_coding | deleterious(0.02) | probably_damaging(0.998) | TCGA-A8-A08H-01 | Breast | breast invasive carcinoma | Female | >=65 | I/II | Unknown | Unknown | SD |
| EFCAB14 | SNV | Missense_Mutation | c.116C>T | p.Ser39Leu | p.S39L | O75071 | protein_coding | deleterious(0) | probably_damaging(0.997) | TCGA-A8-A09N-01 | Breast | breast invasive carcinoma | Female | <65 | III/IV | Unknown | Unknown | SD | |
| EFCAB14 | insertion | Frame_Shift_Ins | novel | c.1210_1211insTTTTTAGTAAAGAT | p.Lys404IlefsTer27 | p.K404Ifs*27 | O75071 | protein_coding | TCGA-A8-A08H-01 | Breast | breast invasive carcinoma | Female | >=65 | I/II | Unknown | Unknown | SD | ||
| EFCAB14 | SNV | Missense_Mutation | rs148637456 | c.1435N>A | p.Asp479Asn | p.D479N | O75071 | protein_coding | tolerated(0.11) | benign(0.012) | TCGA-VS-A8EC-01 | Cervix | cervical & endocervical cancer | Female | <65 | III/IV | Chemotherapy | carboplatin | CR |
| EFCAB14 | SNV | Missense_Mutation | c.987N>A | p.Met329Ile | p.M329I | O75071 | protein_coding | tolerated(0.16) | benign(0) | TCGA-AA-3930-01 | Colorectum | colon adenocarcinoma | Male | >=65 | III/IV | Chemotherapy | capecitabine | PD | |
| EFCAB14 | SNV | Missense_Mutation | c.1016N>T | p.Arg339Ile | p.R339I | O75071 | protein_coding | tolerated(0.18) | possibly_damaging(0.549) | TCGA-CA-6718-01 | Colorectum | colon adenocarcinoma | Male | <65 | I/II | Unknown | Unknown | PD | |
| EFCAB14 | SNV | Missense_Mutation | c.604T>G | p.Leu202Val | p.L202V | O75071 | protein_coding | tolerated(0.09) | benign(0.41) | TCGA-DM-A280-01 | Colorectum | colon adenocarcinoma | Female | >=65 | I/II | Unknown | Unknown | SD | |
| EFCAB14 | SNV | Missense_Mutation | c.89N>A | p.Arg30His | p.R30H | O75071 | protein_coding | deleterious(0.04) | probably_damaging(0.999) | TCGA-F5-6813-01 | Colorectum | rectum adenocarcinoma | Male | >=65 | III/IV | Unknown | Unknown | PD | |
| EFCAB14 | SNV | Missense_Mutation | novel | c.1094N>T | p.Ser365Phe | p.S365F | O75071 | protein_coding | deleterious(0) | possibly_damaging(0.76) | TCGA-A5-A0G2-01 | Endometrium | uterine corpus endometrioid carcinoma | Female | <65 | III/IV | Unknown | Unknown | SD |
| Page: 1 2 3 4 5 |
Top |
Related drugs of malignant transformation related genes |
| Identification of chemicals and drugs interact with genes involved in malignant transfromation |
| (DGIdb 4.0) |
| Entrez ID | Symbol | Category | Interaction Types | Drug Claim Name | Drug Name | PMIDs |
| Page: 1 |

Copyright 2023-Present -The University of Texas Health Science Center at Houston |