
|
|||||
|
 | |
| |
| |
| |
| |
| |
|
Gene: DYNC1H1 |
Gene summary for DYNC1H1 |
| Gene information | Species | Human | Gene symbol | DYNC1H1 | Gene ID | 1778 |
| Gene name | dynein cytoplasmic 1 heavy chain 1 | |
| Gene Alias | CMT2O | |
| Cytomap | 14q32.31 | |
| Gene Type | protein-coding | GO ID | GO:0000226 | UniProtAcc | Q14204 |
Top |
Malignant transformation analysis |
| Identification of the aberrant gene expression in precancerous and cancerous lesions by comparing the gene expression of stem-like cells in diseased tissues with normal stem cells |
| Entrez ID | Symbol | Replicates | Species | Organ | Tissue | Adj P-value | Log2FC | Malignancy |
| 1778 | DYNC1H1 | P30T-E | Human | Esophagus | ESCC | 2.29e-52 | 2.19e+00 | 0.137 |
| 1778 | DYNC1H1 | P31T-E | Human | Esophagus | ESCC | 2.40e-53 | 1.13e+00 | 0.1251 |
| 1778 | DYNC1H1 | P32T-E | Human | Esophagus | ESCC | 1.89e-52 | 1.41e+00 | 0.1666 |
| 1778 | DYNC1H1 | P36T-E | Human | Esophagus | ESCC | 6.29e-25 | 9.74e-01 | 0.1187 |
| 1778 | DYNC1H1 | P37T-E | Human | Esophagus | ESCC | 2.37e-70 | 1.70e+00 | 0.1371 |
| 1778 | DYNC1H1 | P38T-E | Human | Esophagus | ESCC | 1.09e-06 | 3.15e-01 | 0.127 |
| 1778 | DYNC1H1 | P39T-E | Human | Esophagus | ESCC | 9.50e-21 | 5.29e-01 | 0.0894 |
| 1778 | DYNC1H1 | P40T-E | Human | Esophagus | ESCC | 1.68e-21 | 7.24e-01 | 0.109 |
| 1778 | DYNC1H1 | P42T-E | Human | Esophagus | ESCC | 7.90e-49 | 1.21e+00 | 0.1175 |
| 1778 | DYNC1H1 | P44T-E | Human | Esophagus | ESCC | 1.19e-20 | 6.47e-01 | 0.1096 |
| 1778 | DYNC1H1 | P47T-E | Human | Esophagus | ESCC | 2.10e-24 | 5.39e-01 | 0.1067 |
| 1778 | DYNC1H1 | P48T-E | Human | Esophagus | ESCC | 1.51e-45 | 9.41e-01 | 0.0959 |
| 1778 | DYNC1H1 | P49T-E | Human | Esophagus | ESCC | 6.49e-21 | 2.79e+00 | 0.1768 |
| 1778 | DYNC1H1 | P52T-E | Human | Esophagus | ESCC | 1.04e-43 | 9.49e-01 | 0.1555 |
| 1778 | DYNC1H1 | P54T-E | Human | Esophagus | ESCC | 9.47e-50 | 1.36e+00 | 0.0975 |
| 1778 | DYNC1H1 | P56T-E | Human | Esophagus | ESCC | 3.07e-17 | 1.75e+00 | 0.1613 |
| 1778 | DYNC1H1 | P57T-E | Human | Esophagus | ESCC | 3.81e-43 | 1.12e+00 | 0.0926 |
| 1778 | DYNC1H1 | P61T-E | Human | Esophagus | ESCC | 9.69e-81 | 2.36e+00 | 0.099 |
| 1778 | DYNC1H1 | P62T-E | Human | Esophagus | ESCC | 1.16e-71 | 1.39e+00 | 0.1302 |
| 1778 | DYNC1H1 | P65T-E | Human | Esophagus | ESCC | 4.12e-55 | 1.19e+00 | 0.0978 |
| Page: 1 2 3 4 5 6 7 8 9 10 11 |
| Tissue | Expression Dynamics | Abbreviation |
| Colorectum (GSE201348) |  | FAP: Familial adenomatous polyposis |
| CRC: Colorectal cancer | ||
| Colorectum (HTA11) |  | AD: Adenomas |
| SER: Sessile serrated lesions | ||
| MSI-H: Microsatellite-high colorectal cancer | ||
| MSS: Microsatellite stable colorectal cancer | ||
| Esophagus | 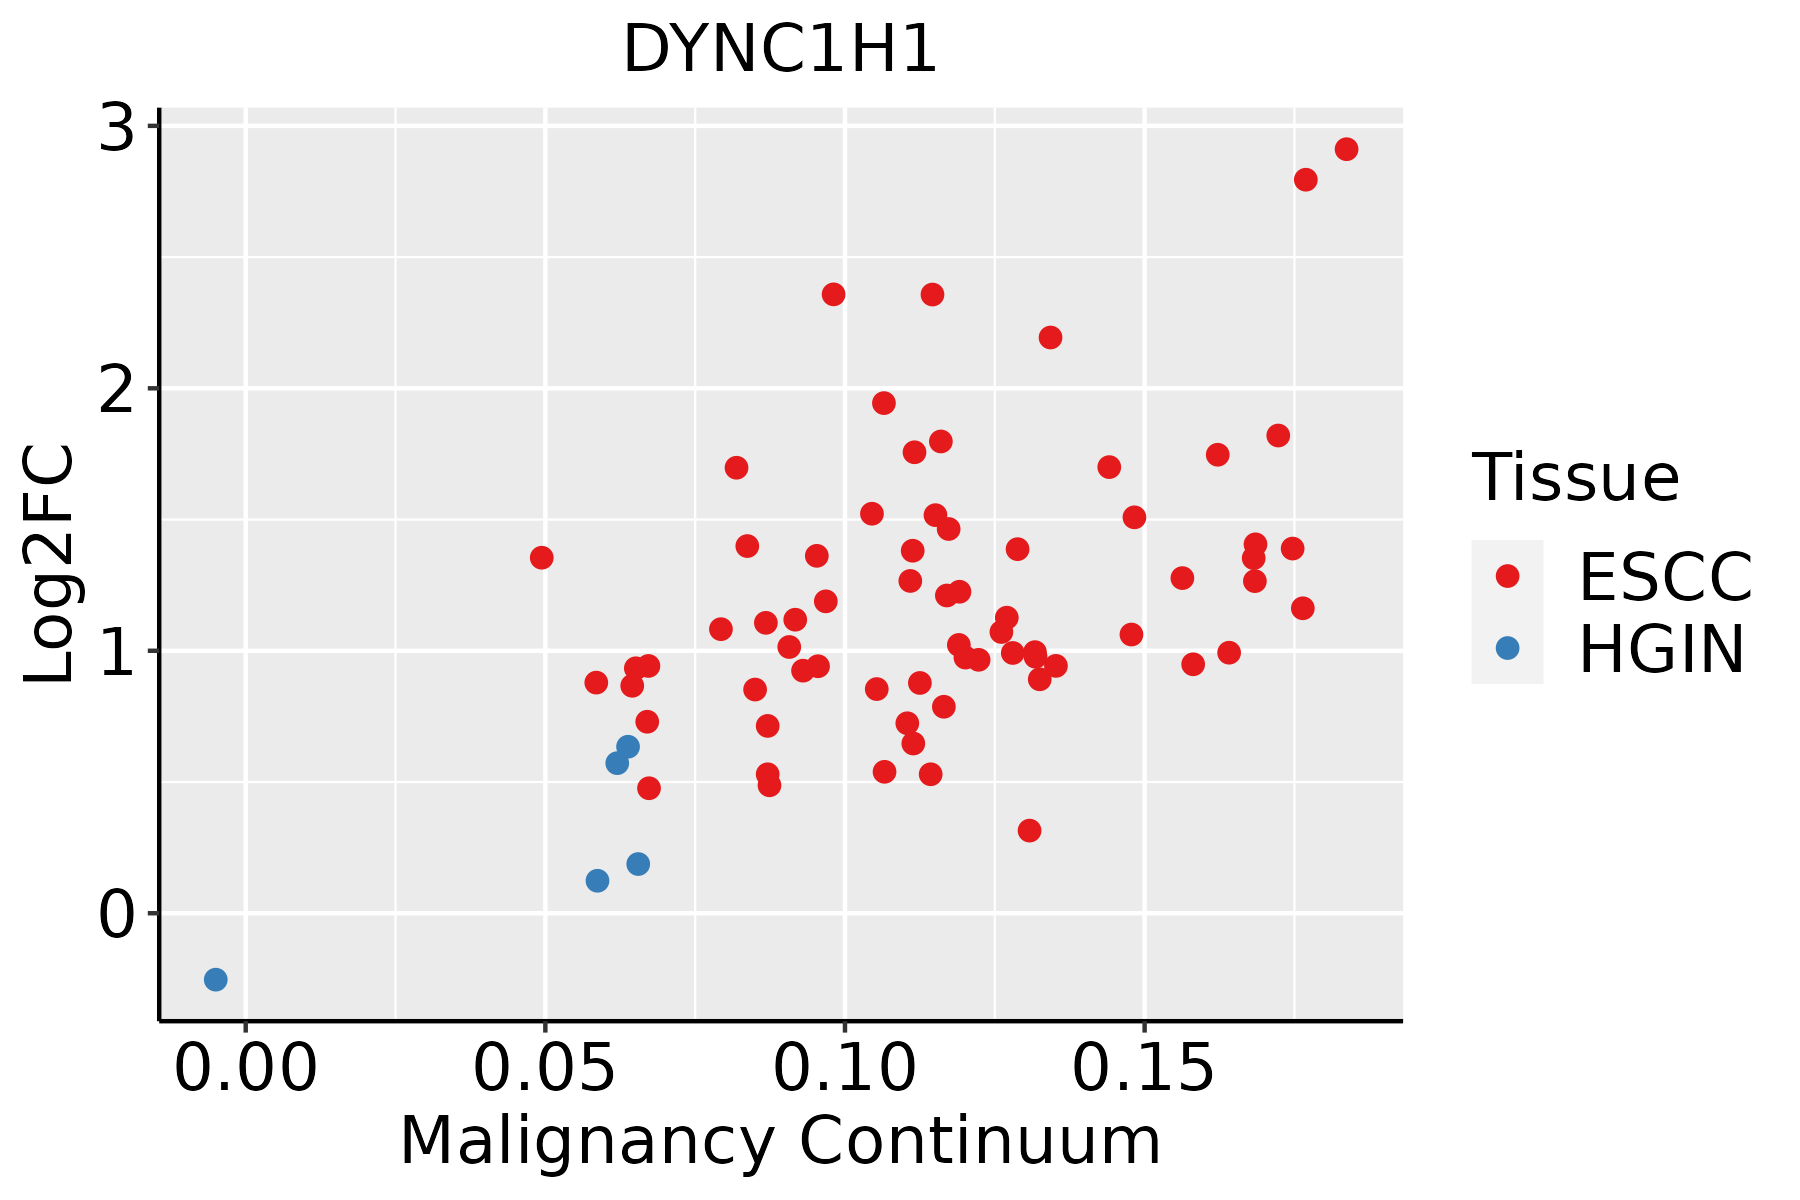 | ESCC: Esophageal squamous cell carcinoma |
| HGIN: High-grade intraepithelial neoplasias | ||
| LGIN: Low-grade intraepithelial neoplasias | ||
| Liver |  | HCC: Hepatocellular carcinoma |
| NAFLD: Non-alcoholic fatty liver disease | ||
| Lung | 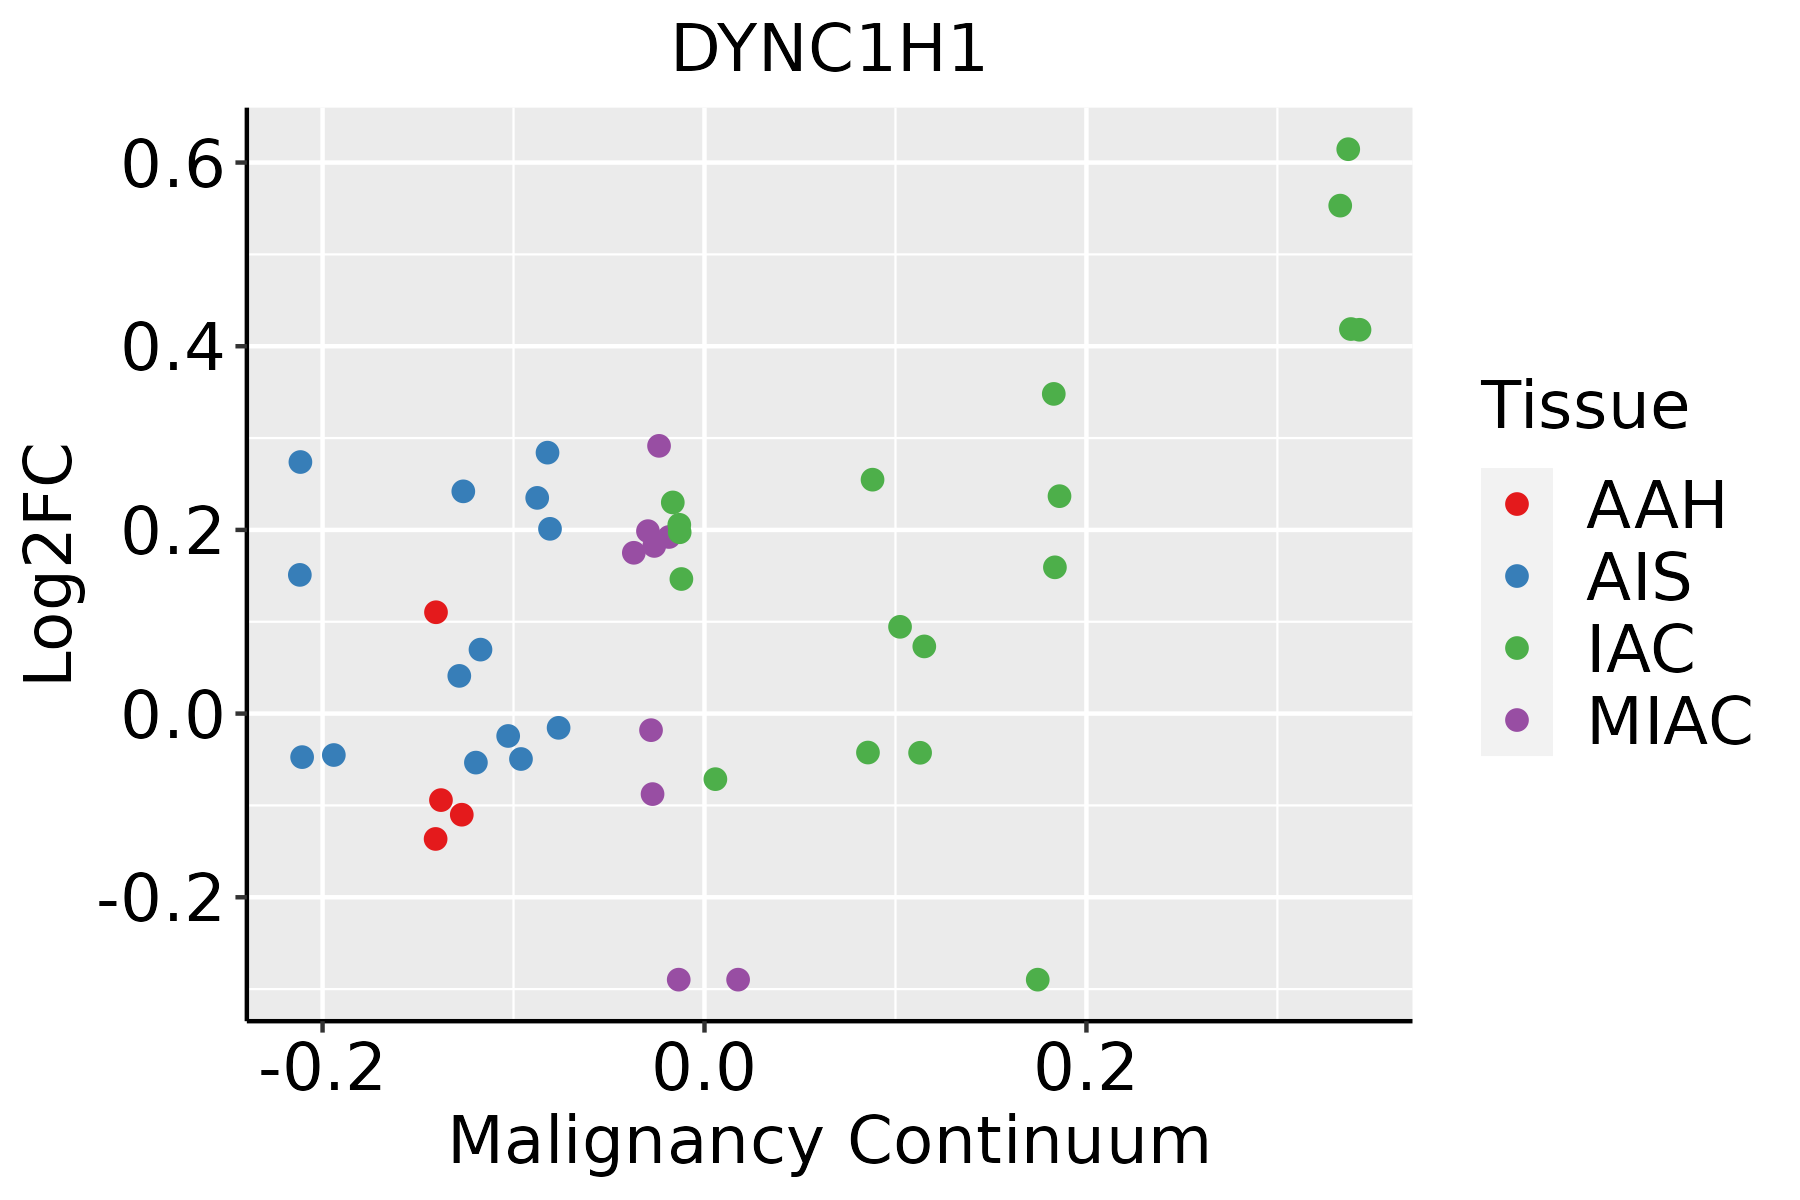 | AAH: Atypical adenomatous hyperplasia |
| AIS: Adenocarcinoma in situ | ||
| IAC: Invasive lung adenocarcinoma | ||
| MIA: Minimally invasive adenocarcinoma | ||
| Oral Cavity | 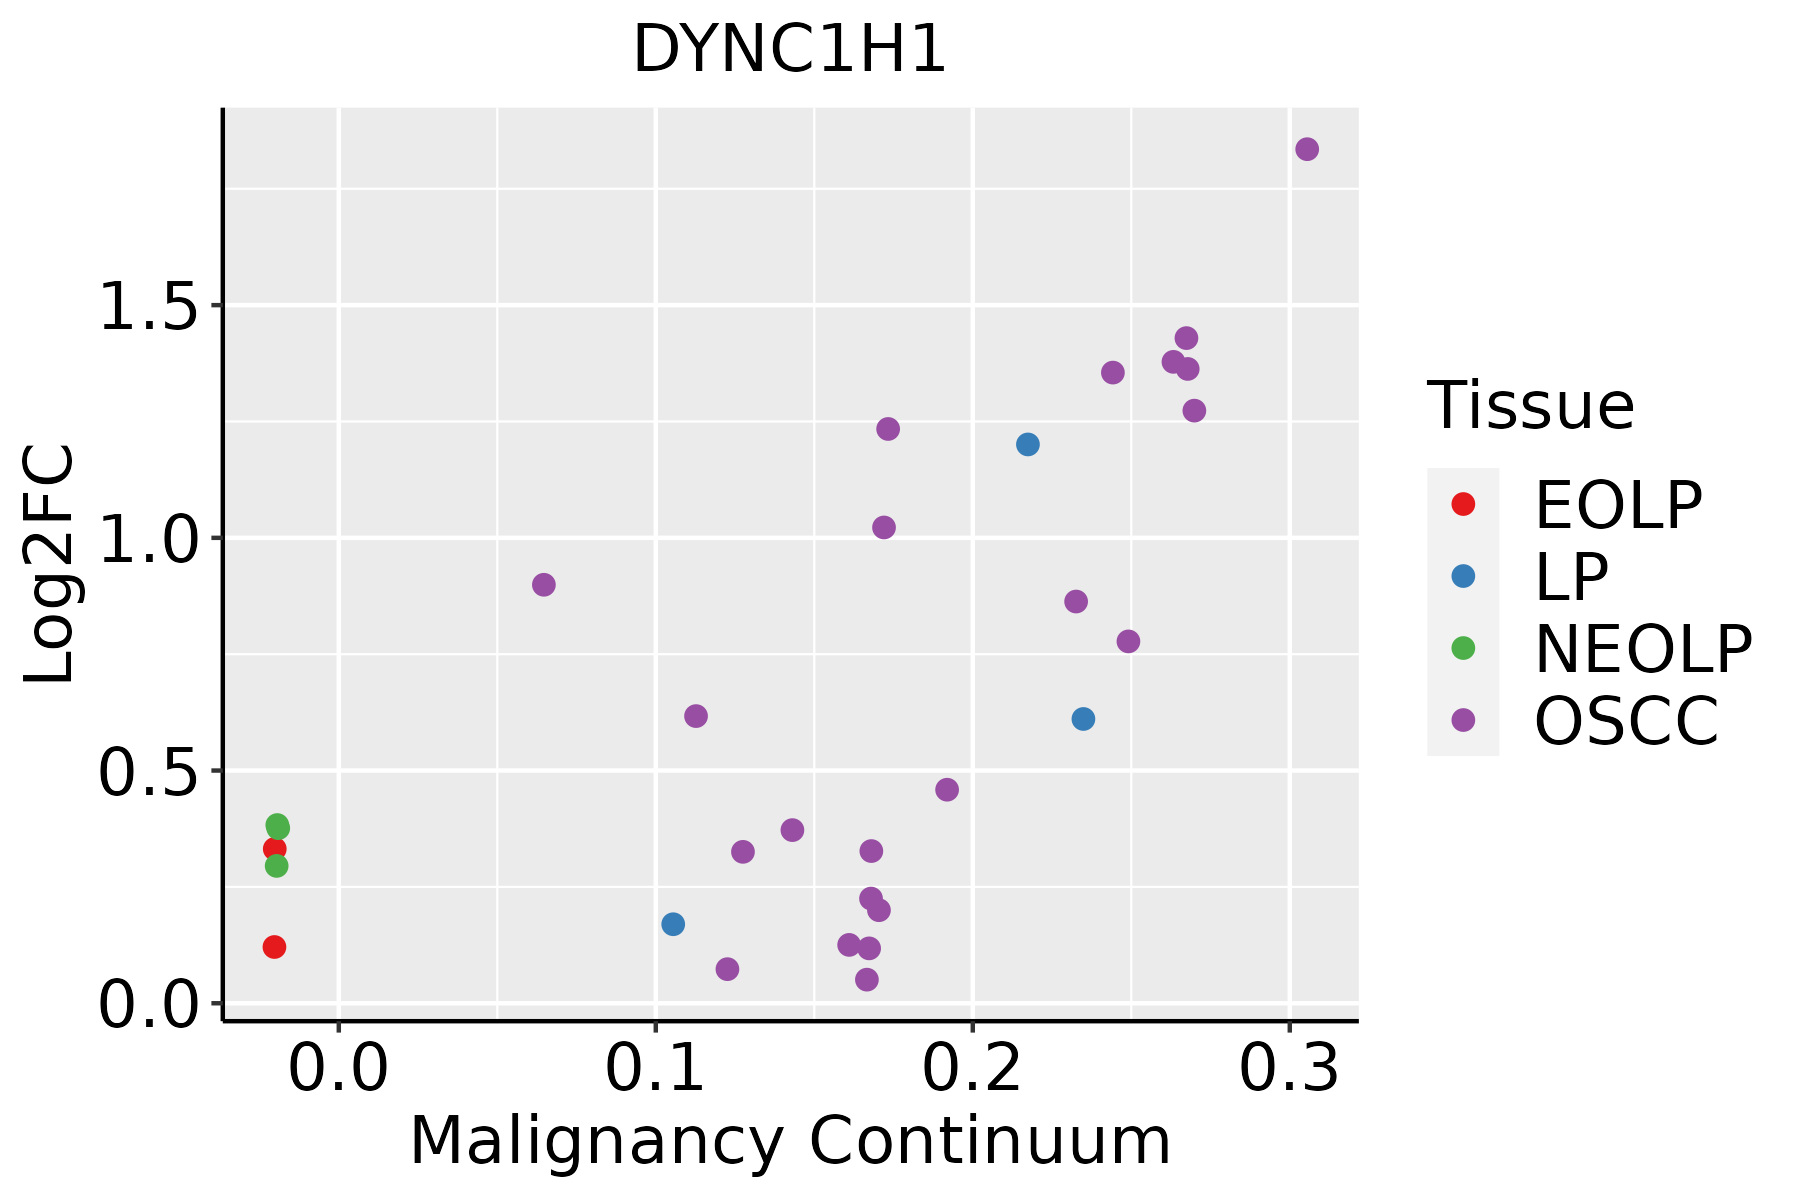 | EOLP: Erosive Oral lichen planus |
| LP: leukoplakia | ||
| NEOLP: Non-erosive oral lichen planus | ||
| OSCC: Oral squamous cell carcinoma | ||
| Prostate | 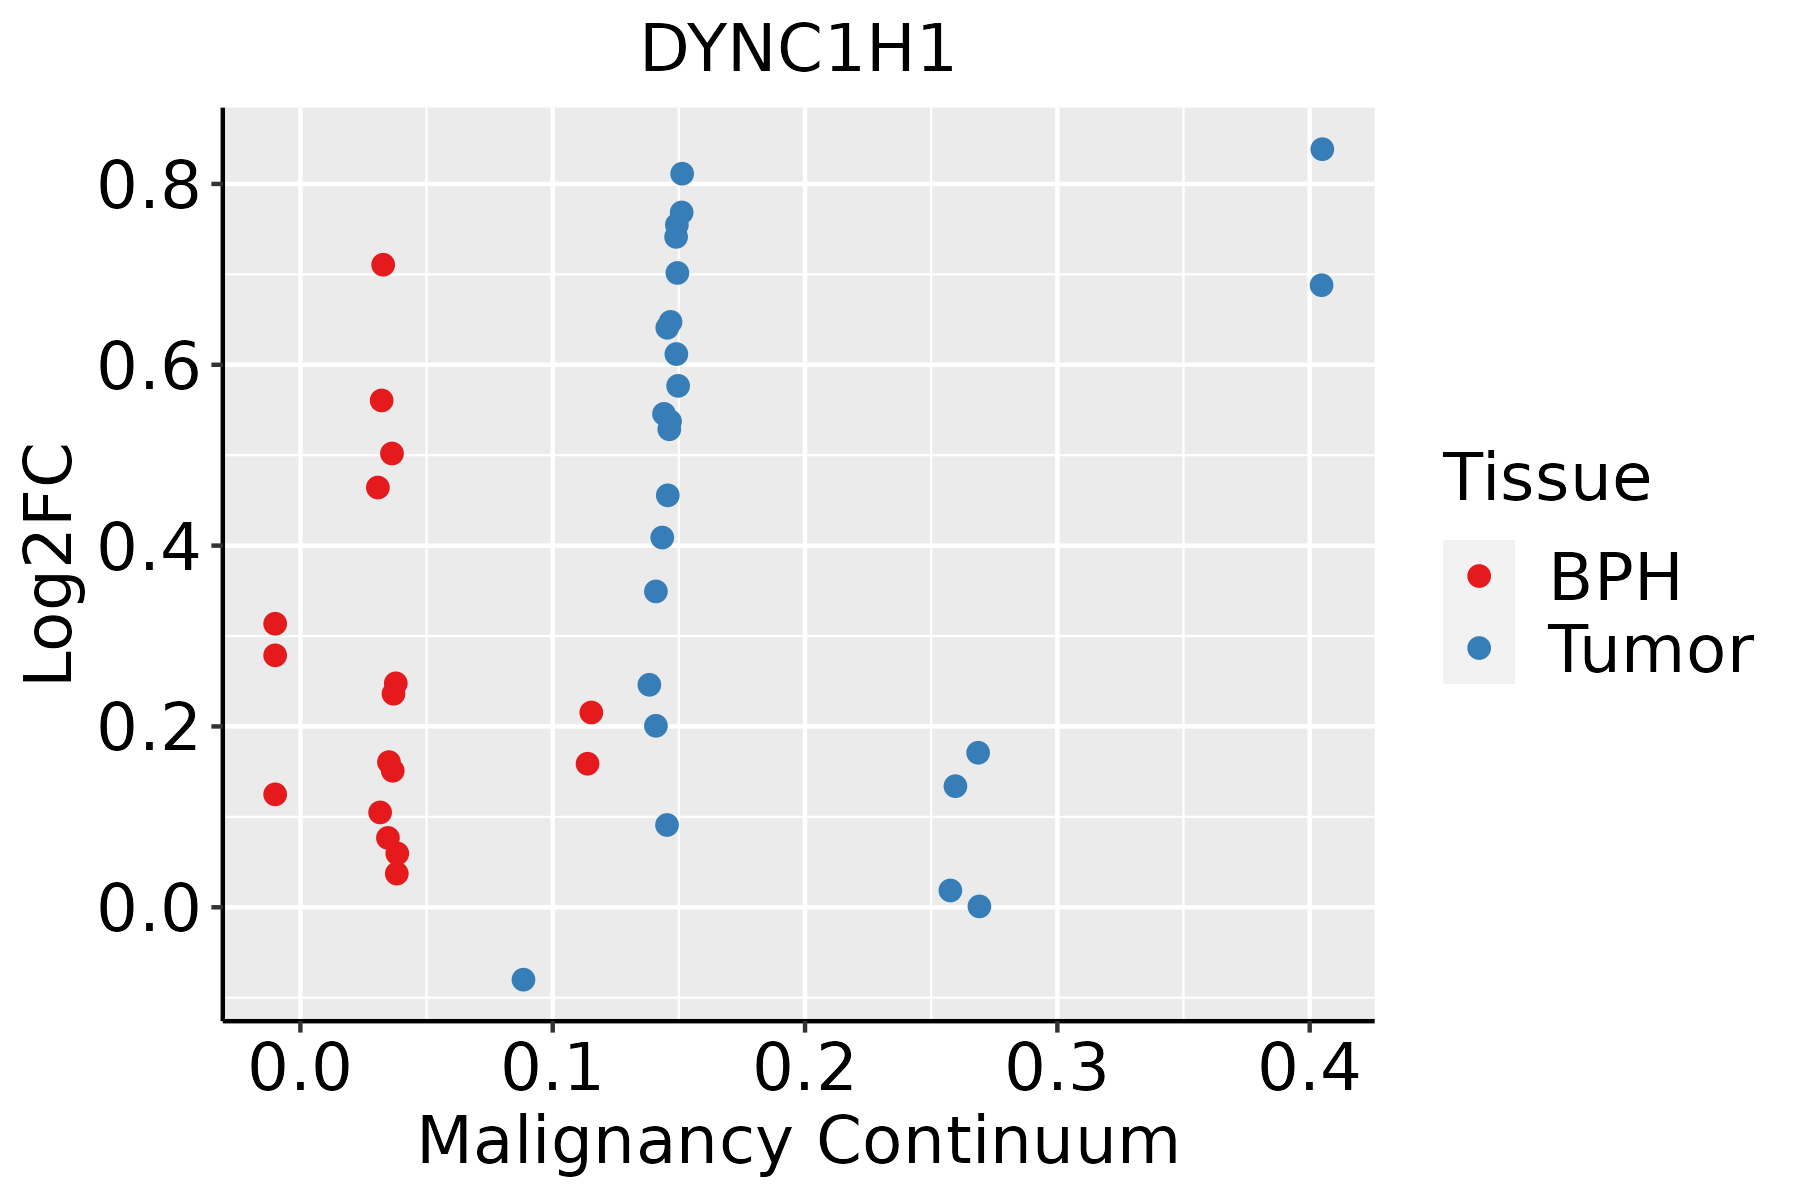 | BPH: Benign Prostatic Hyperplasia |
| Skin |  | AK: Actinic keratosis |
| cSCC: Cutaneous squamous cell carcinoma | ||
| SCCIS:squamous cell carcinoma in situ | ||
| Thyroid |  | ATC: Anaplastic thyroid cancer |
| HT: Hashimoto's thyroiditis | ||
| PTC: Papillary thyroid cancer |
| ∗log2FC in expression of this searched gene in stem-like cells from each diseased tissue sample relative to stem-like cells in normal samples in each tissue plotted against the malignancy continuum. Samples are colored based on if they are from different disease stage. |
Top |
Malignant transformation related pathway analysis |
| Find out the enriched GO biological processes and KEGG pathways involved in transition from healthy to precancer to cancer |
| Tissue | Disease Stage | Enriched GO biological Processes |
| Colorectum | AD |  |
| Colorectum | SER |  |
| Colorectum | MSS |  |
| Colorectum | MSI-H |  |
| Colorectum | FAP |  |
| ∗Top 15 enriched GO BP terms are showed in the bar plot of each disease state in each tissue. Each row represents a significant GO biological process which is colored according to the -log10(p.adjust). |
| Page: 1 2 3 4 5 6 7 8 9 |
| GO ID | Tissue | Disease Stage | Description | Gene Ratio | Bg Ratio | pvalue | p.adjust | Count |
| GO:0051495 | Colorectum | AD | positive regulation of cytoskeleton organization | 89/3918 | 226/18723 | 1.61e-10 | 1.56e-08 | 89 |
| GO:0051656 | Colorectum | AD | establishment of organelle localization | 131/3918 | 390/18723 | 3.00e-09 | 2.06e-07 | 131 |
| GO:0032388 | Colorectum | AD | positive regulation of intracellular transport | 74/3918 | 202/18723 | 1.83e-07 | 7.80e-06 | 74 |
| GO:0032386 | Colorectum | AD | regulation of intracellular transport | 109/3918 | 337/18723 | 5.33e-07 | 1.95e-05 | 109 |
| GO:0051650 | Colorectum | AD | establishment of vesicle localization | 57/3918 | 161/18723 | 1.47e-05 | 3.15e-04 | 57 |
| GO:0051648 | Colorectum | AD | vesicle localization | 59/3918 | 177/18723 | 7.83e-05 | 1.25e-03 | 59 |
| GO:0007051 | Colorectum | AD | spindle organization | 58/3918 | 184/18723 | 4.71e-04 | 5.20e-03 | 58 |
| GO:1902850 | Colorectum | AD | microtubule cytoskeleton organization involved in mitosis | 48/3918 | 147/18723 | 5.87e-04 | 6.21e-03 | 48 |
| GO:0030705 | Colorectum | AD | cytoskeleton-dependent intracellular transport | 60/3918 | 195/18723 | 7.56e-04 | 7.59e-03 | 60 |
| GO:0007052 | Colorectum | AD | mitotic spindle organization | 40/3918 | 120/18723 | 1.03e-03 | 9.61e-03 | 40 |
| GO:0033962 | Colorectum | AD | P-body assembly | 11/3918 | 21/18723 | 1.43e-03 | 1.22e-02 | 11 |
| GO:0007097 | Colorectum | AD | nuclear migration | 10/3918 | 20/18723 | 3.67e-03 | 2.60e-02 | 10 |
| GO:0120162 | Colorectum | AD | positive regulation of cold-induced thermogenesis | 32/3918 | 97/18723 | 3.74e-03 | 2.63e-02 | 32 |
| GO:0051225 | Colorectum | AD | spindle assembly | 37/3918 | 117/18723 | 4.32e-03 | 2.96e-02 | 37 |
| GO:0045787 | Colorectum | AD | positive regulation of cell cycle | 85/3918 | 313/18723 | 4.76e-03 | 3.22e-02 | 85 |
| GO:0051647 | Colorectum | AD | nucleus localization | 11/3918 | 24/18723 | 5.43e-03 | 3.55e-02 | 11 |
| GO:0072384 | Colorectum | AD | organelle transport along microtubule | 28/3918 | 85/18723 | 6.55e-03 | 4.07e-02 | 28 |
| GO:0106106 | Colorectum | AD | cold-induced thermogenesis | 43/3918 | 144/18723 | 7.05e-03 | 4.31e-02 | 43 |
| GO:0120161 | Colorectum | AD | regulation of cold-induced thermogenesis | 43/3918 | 144/18723 | 7.05e-03 | 4.31e-02 | 43 |
| GO:0070507 | Colorectum | AD | regulation of microtubule cytoskeleton organization | 44/3918 | 148/18723 | 7.05e-03 | 4.31e-02 | 44 |
| Page: 1 2 3 4 5 6 7 8 9 10 11 12 13 14 15 16 17 18 19 20 21 22 23 24 25 26 27 28 |
| Pathway ID | Tissue | Disease Stage | Description | Gene Ratio | Bg Ratio | pvalue | p.adjust | qvalue | Count |
| hsa05132 | Colorectum | AD | Salmonella infection | 102/2092 | 249/8465 | 7.65e-09 | 1.28e-07 | 8.17e-08 | 102 |
| hsa04962 | Colorectum | AD | Vasopressin-regulated water reabsorption | 19/2092 | 44/8465 | 5.48e-03 | 2.48e-02 | 1.58e-02 | 19 |
| hsa051321 | Colorectum | AD | Salmonella infection | 102/2092 | 249/8465 | 7.65e-09 | 1.28e-07 | 8.17e-08 | 102 |
| hsa049621 | Colorectum | AD | Vasopressin-regulated water reabsorption | 19/2092 | 44/8465 | 5.48e-03 | 2.48e-02 | 1.58e-02 | 19 |
| hsa051326 | Colorectum | MSI-H | Salmonella infection | 43/797 | 249/8465 | 5.91e-05 | 8.33e-04 | 6.98e-04 | 43 |
| hsa04145 | Colorectum | MSI-H | Phagosome | 27/797 | 152/8465 | 8.74e-04 | 1.01e-02 | 8.48e-03 | 27 |
| hsa051327 | Colorectum | MSI-H | Salmonella infection | 43/797 | 249/8465 | 5.91e-05 | 8.33e-04 | 6.98e-04 | 43 |
| hsa041451 | Colorectum | MSI-H | Phagosome | 27/797 | 152/8465 | 8.74e-04 | 1.01e-02 | 8.48e-03 | 27 |
| hsa051328 | Colorectum | FAP | Salmonella infection | 67/1404 | 249/8465 | 2.04e-05 | 2.52e-04 | 1.53e-04 | 67 |
| hsa051329 | Colorectum | FAP | Salmonella infection | 67/1404 | 249/8465 | 2.04e-05 | 2.52e-04 | 1.53e-04 | 67 |
| hsa0513210 | Colorectum | CRC | Salmonella infection | 48/1091 | 249/8465 | 2.43e-03 | 1.69e-02 | 1.15e-02 | 48 |
| hsa0513211 | Colorectum | CRC | Salmonella infection | 48/1091 | 249/8465 | 2.43e-03 | 1.69e-02 | 1.15e-02 | 48 |
| hsa05132211 | Esophagus | ESCC | Salmonella infection | 191/4205 | 249/8465 | 6.51e-19 | 5.45e-17 | 2.79e-17 | 191 |
| hsa0414530 | Esophagus | ESCC | Phagosome | 100/4205 | 152/8465 | 3.81e-05 | 1.72e-04 | 8.82e-05 | 100 |
| hsa0496223 | Esophagus | ESCC | Vasopressin-regulated water reabsorption | 33/4205 | 44/8465 | 5.27e-04 | 1.78e-03 | 9.13e-04 | 33 |
| hsa05132310 | Esophagus | ESCC | Salmonella infection | 191/4205 | 249/8465 | 6.51e-19 | 5.45e-17 | 2.79e-17 | 191 |
| hsa04145114 | Esophagus | ESCC | Phagosome | 100/4205 | 152/8465 | 3.81e-05 | 1.72e-04 | 8.82e-05 | 100 |
| hsa0496233 | Esophagus | ESCC | Vasopressin-regulated water reabsorption | 33/4205 | 44/8465 | 5.27e-04 | 1.78e-03 | 9.13e-04 | 33 |
| hsa0513222 | Liver | Cirrhotic | Salmonella infection | 121/2530 | 249/8465 | 2.47e-10 | 5.13e-09 | 3.16e-09 | 121 |
| hsa0414514 | Liver | Cirrhotic | Phagosome | 73/2530 | 152/8465 | 1.61e-06 | 1.78e-05 | 1.10e-05 | 73 |
| Page: 1 2 3 4 |
Top |
Cell-cell communication analysis |
| Identification of potential cell-cell interactions between two cell types and their ligand-receptor pairs for different disease states |
| Ligand | Receptor | LRpair | Pathway | Tissue | Disease Stage |
| Page: 1 |
Top |
Single-cell gene regulatory network inference analysis |
| Find out the significant the regulons (TFs) and the target genes of each regulon across cell types for different disease states |
| TF | Cell Type | Tissue | Disease Stage | Target Gene | RSS | Regulon Activity |
| ∗The dot plots of a searched regulon are shown for all cell subpopulations in each disease state of each tissue based on the regulon specific score inferred using pySCENIC and by calculating the average expression. |
| Page: 1 |
Top |
Somatic mutation of malignant transformation related genes |
| Annotation of somatic variants for genes involved in malignant transformation |
| Hugo Symbol | Variant Class | Variant Classification | dbSNP RS | HGVSc | HGVSp | HGVSp Short | SWISSPROT | BIOTYPE | SIFT | PolyPhen | Tumor Sample Barcode | Tissue | Histology | Sex | Age | Stage | Therapy Types | Drugs | Outcome |
| DYNC1H1 | SNV | Missense_Mutation | novel | c.5356N>A | p.Glu1786Lys | p.E1786K | Q14204 | protein_coding | tolerated(0.32) | benign(0.007) | TCGA-3C-AALI-01 | Breast | breast invasive carcinoma | Female | <65 | I/II | Unspecific | Poly E | Complete Response |
| DYNC1H1 | SNV | Missense_Mutation | novel | c.13254N>C | p.Lys4418Asn | p.K4418N | Q14204 | protein_coding | tolerated(1) | benign(0.001) | TCGA-3C-AALI-01 | Breast | breast invasive carcinoma | Female | <65 | I/II | Unspecific | Poly E | Complete Response |
| DYNC1H1 | SNV | Missense_Mutation | novel | c.11389N>T | p.Val3797Leu | p.V3797L | Q14204 | protein_coding | deleterious(0.01) | probably_damaging(0.962) | TCGA-A2-A0T2-01 | Breast | breast invasive carcinoma | Female | >=65 | III/IV | Chemotherapy | xeloda | PD |
| DYNC1H1 | SNV | Missense_Mutation | c.13316N>G | p.Glu4439Gly | p.E4439G | Q14204 | protein_coding | tolerated(0.14) | benign(0.243) | TCGA-A2-A0YJ-01 | Breast | breast invasive carcinoma | Female | <65 | III/IV | Chemotherapy | cytoxan | PD | |
| DYNC1H1 | SNV | Missense_Mutation | c.262G>A | p.Val88Ile | p.V88I | Q14204 | protein_coding | tolerated(0.2) | benign(0.035) | TCGA-A7-A26H-01 | Breast | breast invasive carcinoma | Female | >=65 | I/II | Hormone Therapy | anastrozole | PD | |
| DYNC1H1 | SNV | Missense_Mutation | c.1585N>G | p.Asn529Asp | p.N529D | Q14204 | protein_coding | tolerated(0.61) | benign(0.025) | TCGA-A8-A06R-01 | Breast | breast invasive carcinoma | Female | >=65 | I/II | Chemotherapy | 5-fluorouracil | CR | |
| DYNC1H1 | SNV | Missense_Mutation | c.7222N>A | p.Ala2408Thr | p.A2408T | Q14204 | protein_coding | tolerated(0.53) | benign(0) | TCGA-A8-A07B-01 | Breast | breast invasive carcinoma | Female | >=65 | I/II | Unknown | Unknown | SD | |
| DYNC1H1 | SNV | Missense_Mutation | c.4451N>C | p.Cys1484Ser | p.C1484S | Q14204 | protein_coding | deleterious(0) | possibly_damaging(0.783) | TCGA-A8-A09K-01 | Breast | breast invasive carcinoma | Female | >=65 | I/II | Unknown | Unknown | SD | |
| DYNC1H1 | SNV | Missense_Mutation | novel | c.1284N>C | p.Glu428Asp | p.E428D | Q14204 | protein_coding | tolerated(0.48) | benign(0.007) | TCGA-AC-A3W6-01 | Breast | breast invasive carcinoma | Female | >=65 | III/IV | Unknown | Unknown | SD |
| DYNC1H1 | SNV | Missense_Mutation | novel | c.4915N>C | p.Glu1639Gln | p.E1639Q | Q14204 | protein_coding | deleterious(0) | probably_damaging(0.977) | TCGA-AC-A5XS-01 | Breast | breast invasive carcinoma | Female | >=65 | I/II | Hormone Therapy | femara | SD |
| Page: 1 2 3 4 5 6 7 8 9 10 11 12 13 14 15 16 17 18 19 20 21 22 23 24 25 26 27 28 29 30 31 32 33 34 35 36 37 38 39 40 41 42 43 44 |
Top |
Related drugs of malignant transformation related genes |
| Identification of chemicals and drugs interact with genes involved in malignant transfromation |
| (DGIdb 4.0) |
| Entrez ID | Symbol | Category | Interaction Types | Drug Claim Name | Drug Name | PMIDs |
| Page: 1 |

Copyright 2023-Present -The University of Texas Health Science Center at Houston |