
|
|||||
|
 | |
| |
| |
| |
| |
| |
|
Gene: DUSP5 |
Gene summary for DUSP5 |
| Gene information | Species | Human | Gene symbol | DUSP5 | Gene ID | 1847 |
| Gene name | dual specificity phosphatase 5 | |
| Gene Alias | DUSP | |
| Cytomap | 10q25.2 | |
| Gene Type | protein-coding | GO ID | GO:0000165 | UniProtAcc | Q16690 |
Top |
Malignant transformation analysis |
| Identification of the aberrant gene expression in precancerous and cancerous lesions by comparing the gene expression of stem-like cells in diseased tissues with normal stem cells |
| Entrez ID | Symbol | Replicates | Species | Organ | Tissue | Adj P-value | Log2FC | Malignancy |
| 1847 | DUSP5 | C46 | Human | Oral cavity | OSCC | 6.77e-06 | 6.34e-01 | 0.1673 |
| 1847 | DUSP5 | C57 | Human | Oral cavity | OSCC | 2.52e-25 | 1.73e+00 | 0.1679 |
| 1847 | DUSP5 | C08 | Human | Oral cavity | OSCC | 8.21e-18 | 7.56e-01 | 0.1919 |
| 1847 | DUSP5 | C09 | Human | Oral cavity | OSCC | 6.35e-16 | 8.33e-01 | 0.1431 |
| 1847 | DUSP5 | LN46 | Human | Oral cavity | OSCC | 5.10e-17 | 1.68e+00 | 0.1666 |
| 1847 | DUSP5 | LP15 | Human | Oral cavity | LP | 7.20e-03 | 6.03e-01 | 0.2174 |
| 1847 | DUSP5 | EOLP-1 | Human | Oral cavity | EOLP | 4.30e-09 | 3.83e-01 | -0.0202 |
| 1847 | DUSP5 | NEOLP-3 | Human | Oral cavity | NEOLP | 9.07e-03 | 1.22e-01 | -0.0191 |
| 1847 | DUSP5 | SYSMH2 | Human | Oral cavity | OSCC | 2.95e-13 | 6.04e-01 | 0.2326 |
| 1847 | DUSP5 | SYSMH3 | Human | Oral cavity | OSCC | 8.05e-03 | 1.82e-01 | 0.2442 |
| 1847 | DUSP5 | SYSMH4 | Human | Oral cavity | OSCC | 2.81e-05 | 3.64e-02 | 0.1226 |
| 1847 | DUSP5 | SYSMH6 | Human | Oral cavity | OSCC | 5.14e-06 | 3.16e-01 | 0.1275 |
| 1847 | DUSP5 | GSM5252135_BPH511PrPUr_Fcol_3GEX | Human | Prostate | BPH | 6.43e-20 | 1.70e+00 | -0.1833 |
| 1847 | DUSP5 | 047563_1562-all-cells | Human | Prostate | BPH | 1.30e-05 | -3.31e-01 | 0.0791 |
| 1847 | DUSP5 | 048752_1579-all-cells | Human | Prostate | BPH | 1.88e-04 | -4.01e-01 | 0.1008 |
| 1847 | DUSP5 | 052095_1628-all-cells | Human | Prostate | BPH | 8.13e-05 | -4.14e-01 | 0.1032 |
| 1847 | DUSP5 | 052097_1595-all-cells | Human | Prostate | BPH | 1.08e-07 | -4.02e-01 | 0.0972 |
| 1847 | DUSP5 | 052099_1652-all-cells | Human | Prostate | BPH | 8.76e-20 | -5.73e-01 | 0.1038 |
| 1847 | DUSP5 | Dong_P1 | Human | Prostate | Tumor | 2.17e-30 | 4.30e-02 | 0.035 |
| 1847 | DUSP5 | Dong_P3 | Human | Prostate | Tumor | 2.63e-11 | -3.51e-01 | 0.0278 |
| Page: 1 2 3 4 5 6 |
| Tissue | Expression Dynamics | Abbreviation |
| Cervix | 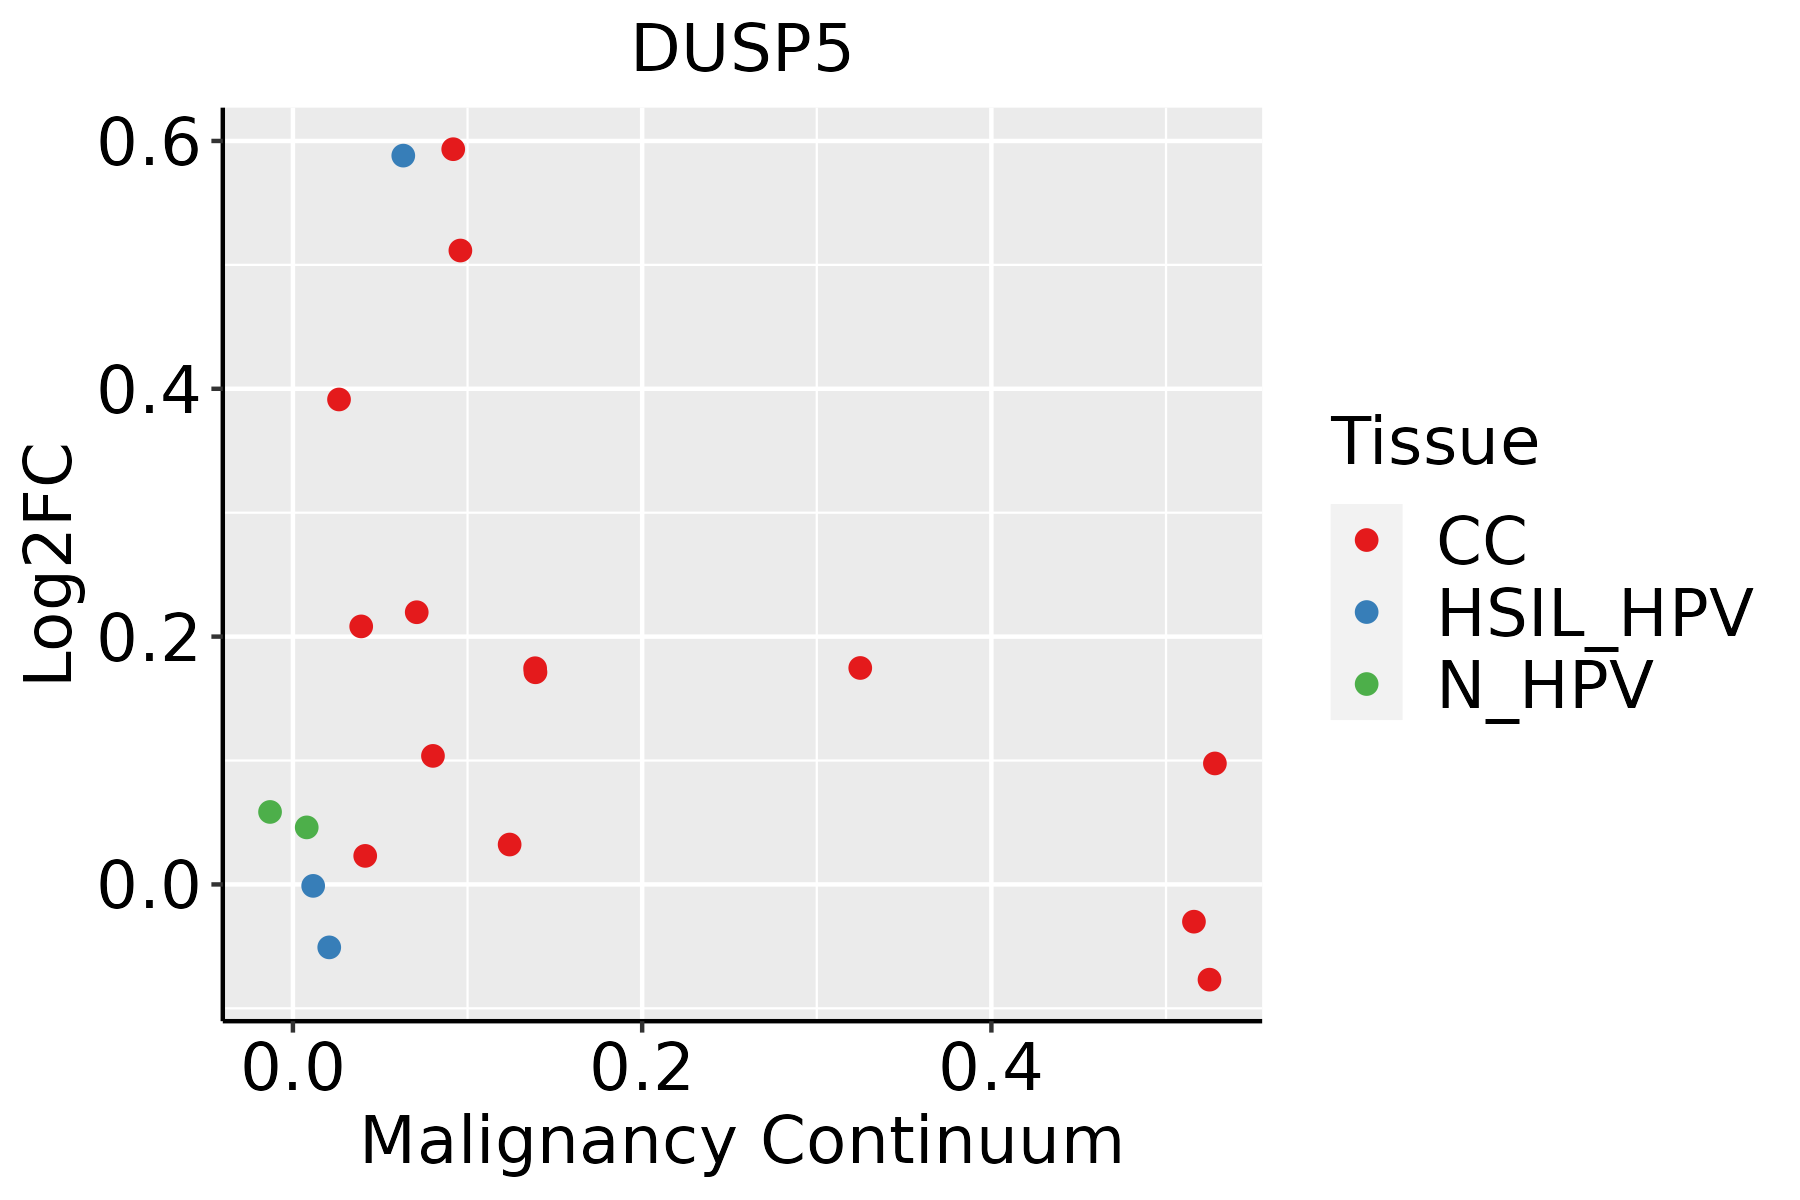 | CC: Cervix cancer |
| HSIL_HPV: HPV-infected high-grade squamous intraepithelial lesions | ||
| N_HPV: HPV-infected normal cervix | ||
| Colorectum (GSE201348) |  | FAP: Familial adenomatous polyposis |
| CRC: Colorectal cancer | ||
| Colorectum (HTA11) |  | AD: Adenomas |
| SER: Sessile serrated lesions | ||
| MSI-H: Microsatellite-high colorectal cancer | ||
| MSS: Microsatellite stable colorectal cancer | ||
| Esophagus | 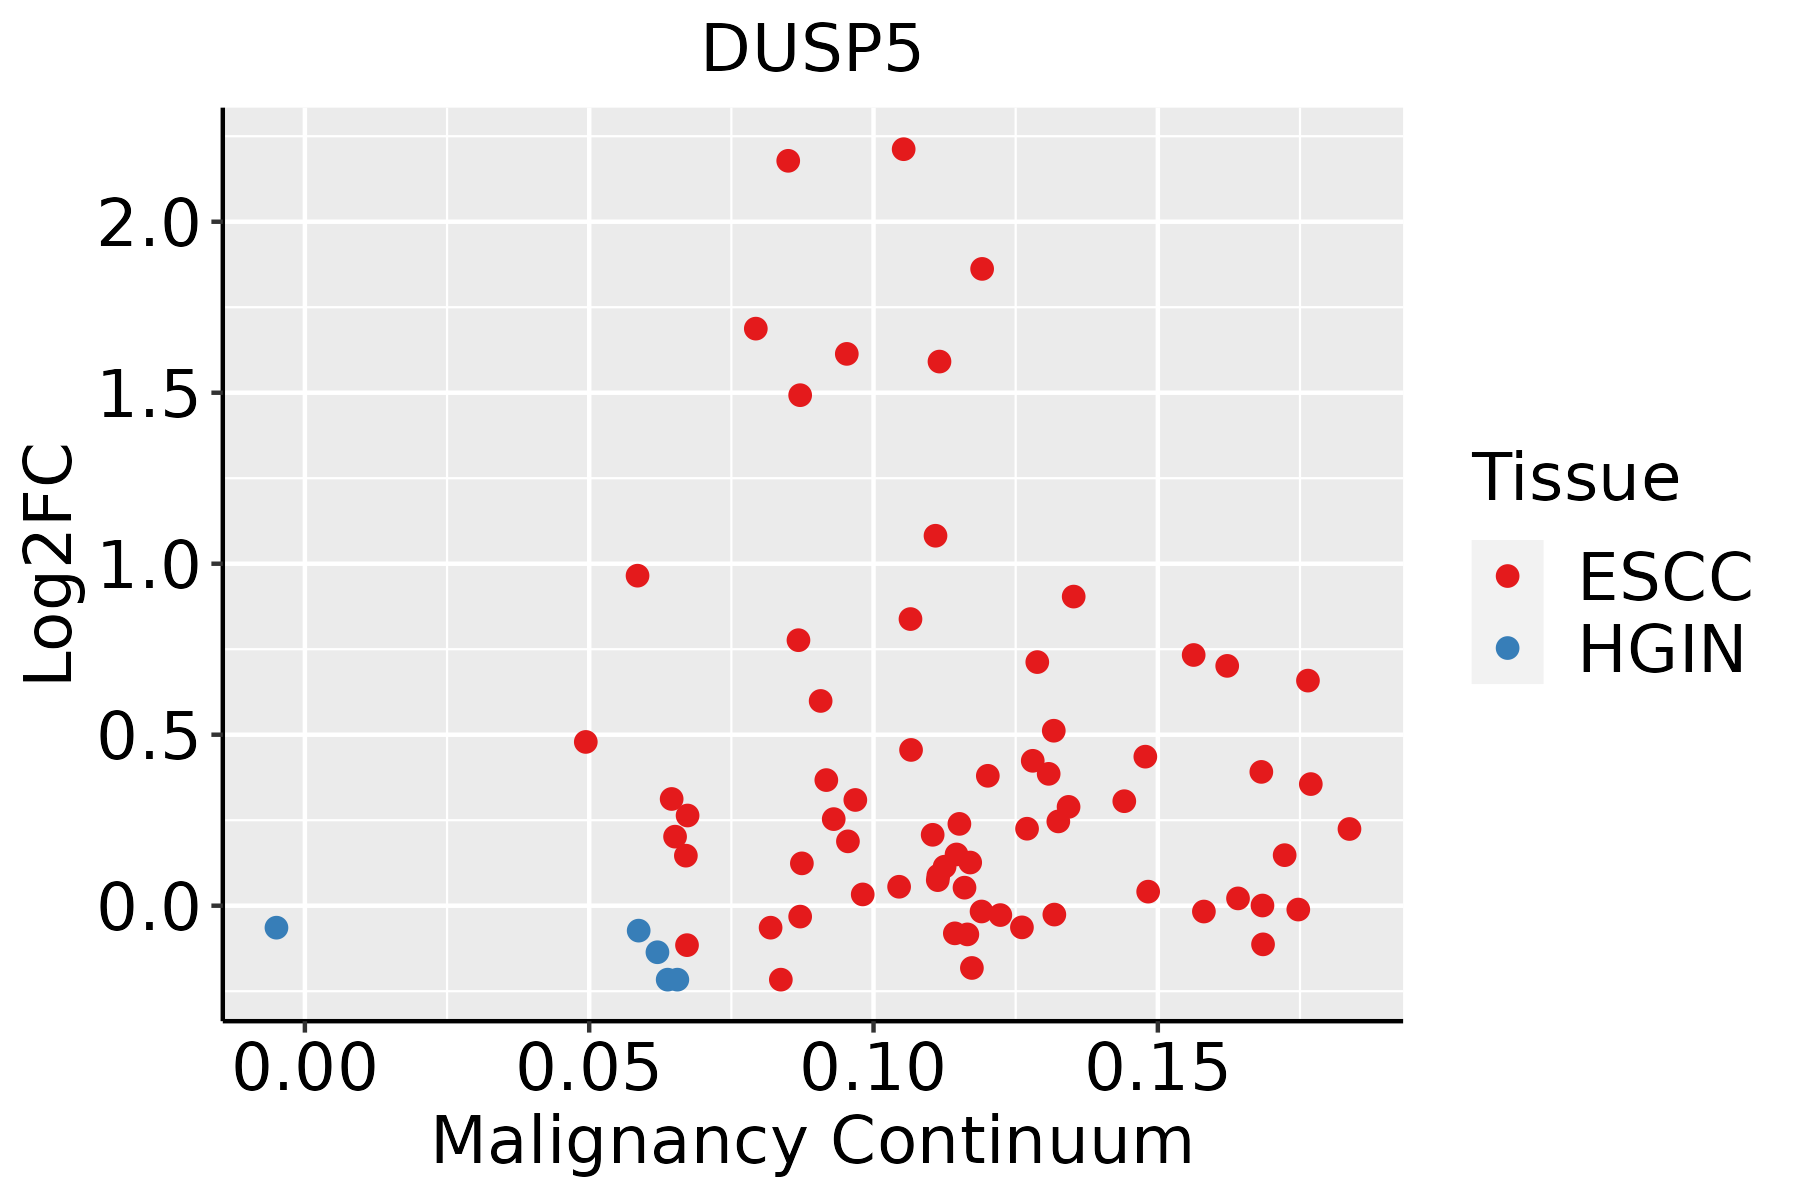 | ESCC: Esophageal squamous cell carcinoma |
| HGIN: High-grade intraepithelial neoplasias | ||
| LGIN: Low-grade intraepithelial neoplasias | ||
| Liver |  | HCC: Hepatocellular carcinoma |
| NAFLD: Non-alcoholic fatty liver disease | ||
| Oral Cavity |  | EOLP: Erosive Oral lichen planus |
| LP: leukoplakia | ||
| NEOLP: Non-erosive oral lichen planus | ||
| OSCC: Oral squamous cell carcinoma | ||
| Prostate | 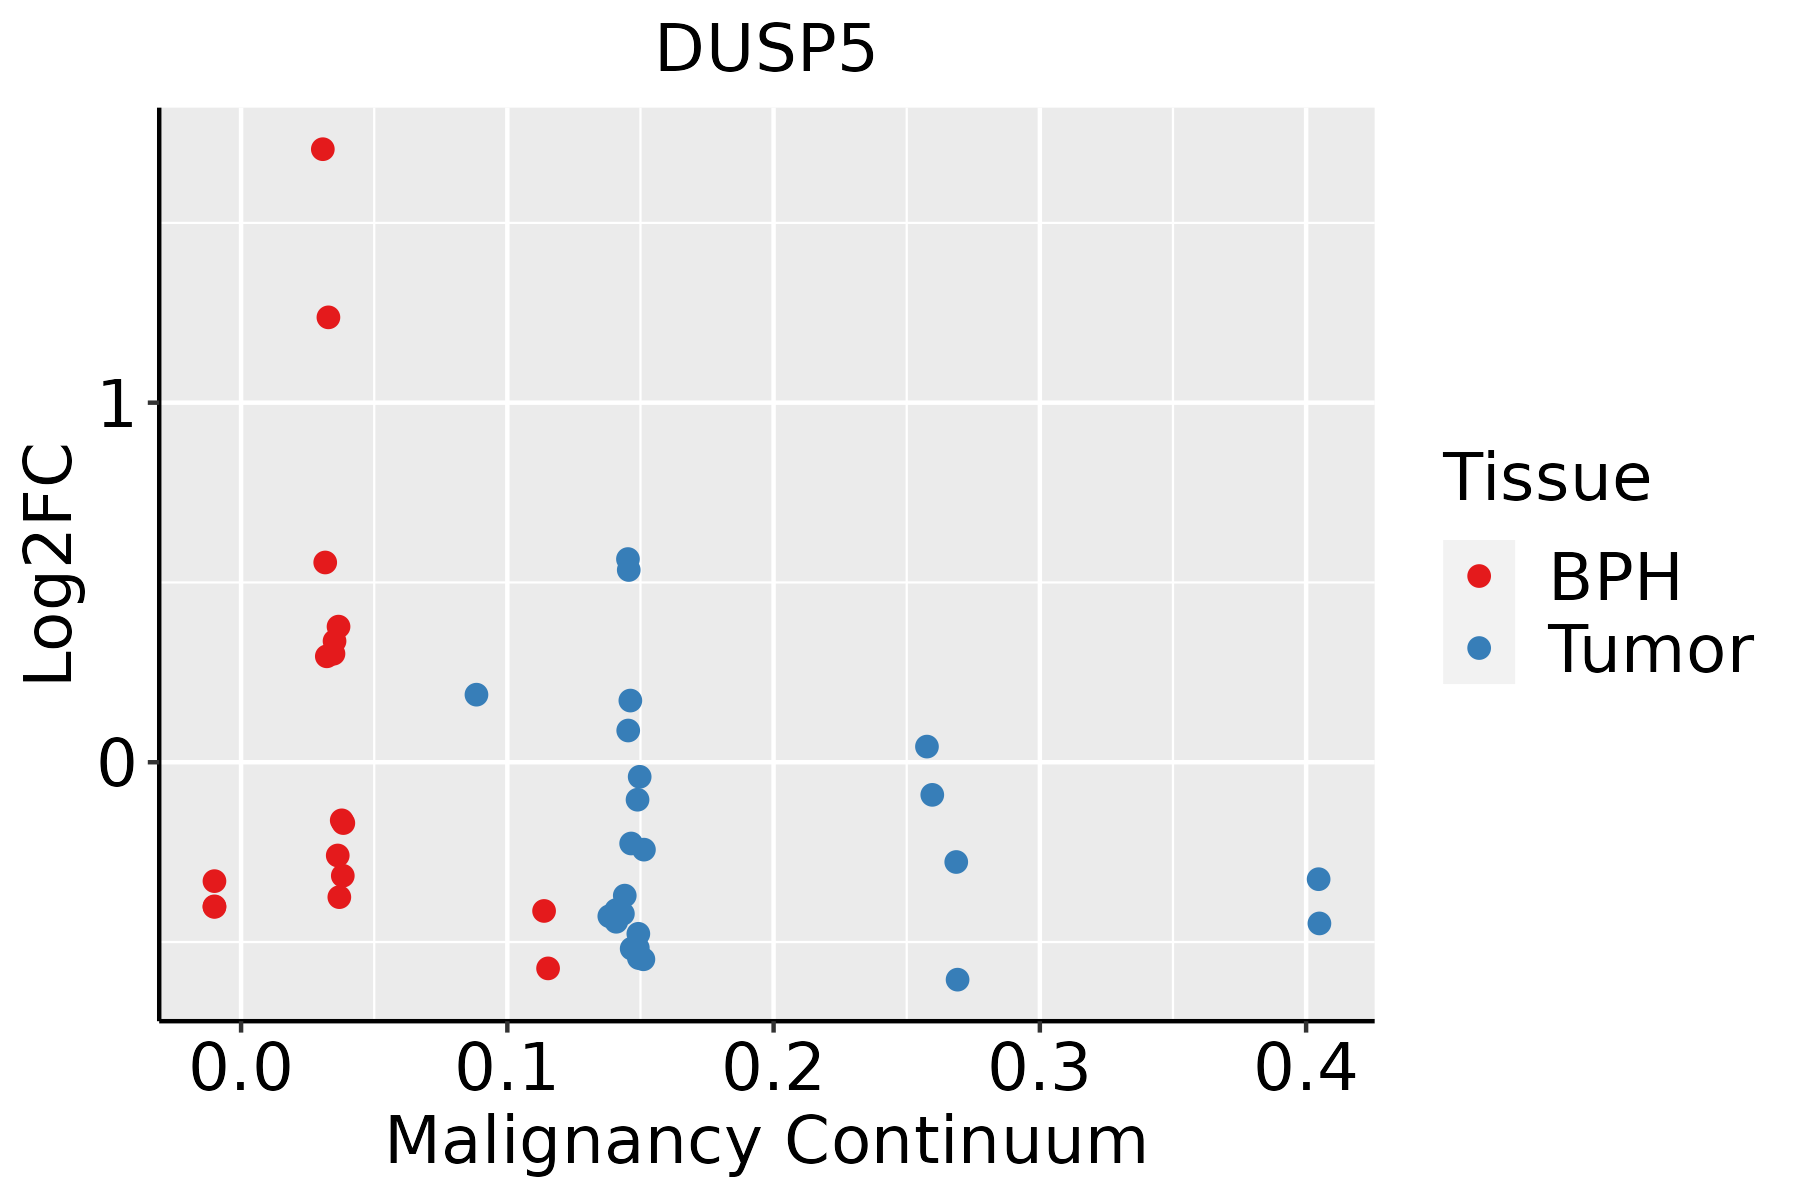 | BPH: Benign Prostatic Hyperplasia |
| Thyroid |  | ATC: Anaplastic thyroid cancer |
| HT: Hashimoto's thyroiditis | ||
| PTC: Papillary thyroid cancer |
| ∗log2FC in expression of this searched gene in stem-like cells from each diseased tissue sample relative to stem-like cells in normal samples in each tissue plotted against the malignancy continuum. Samples are colored based on if they are from different disease stage. |
Top |
Malignant transformation related pathway analysis |
| Find out the enriched GO biological processes and KEGG pathways involved in transition from healthy to precancer to cancer |
| Tissue | Disease Stage | Enriched GO biological Processes |
| Colorectum | AD |  |
| Colorectum | SER |  |
| Colorectum | MSS |  |
| Colorectum | MSI-H |  |
| Colorectum | FAP |  |
| ∗Top 15 enriched GO BP terms are showed in the bar plot of each disease state in each tissue. Each row represents a significant GO biological process which is colored according to the -log10(p.adjust). |
| Page: 1 2 3 4 5 6 7 8 9 |
| GO ID | Tissue | Disease Stage | Description | Gene Ratio | Bg Ratio | pvalue | p.adjust | Count |
| GO:00064708 | Cervix | CC | protein dephosphorylation | 60/2311 | 281/18723 | 1.33e-05 | 2.68e-04 | 60 |
| GO:00073695 | Cervix | CC | gastrulation | 42/2311 | 185/18723 | 5.83e-05 | 8.46e-04 | 42 |
| GO:00074923 | Cervix | CC | endoderm development | 20/2311 | 77/18723 | 8.40e-04 | 7.30e-03 | 20 |
| GO:00434099 | Cervix | CC | negative regulation of MAPK cascade | 37/2311 | 180/18723 | 1.17e-03 | 9.50e-03 | 37 |
| GO:00163117 | Cervix | CC | dephosphorylation | 73/2311 | 417/18723 | 1.23e-03 | 9.87e-03 | 73 |
| GO:0001704 | Cervix | CC | formation of primary germ layer | 27/2311 | 121/18723 | 1.49e-03 | 1.16e-02 | 27 |
| GO:00017041 | Cervix | HSIL_HPV | formation of primary germ layer | 13/737 | 121/18723 | 9.63e-04 | 1.20e-02 | 13 |
| GO:004340913 | Cervix | HSIL_HPV | negative regulation of MAPK cascade | 16/737 | 180/18723 | 2.05e-03 | 2.13e-02 | 16 |
| GO:000736911 | Cervix | HSIL_HPV | gastrulation | 16/737 | 185/18723 | 2.71e-03 | 2.58e-02 | 16 |
| GO:0001706 | Cervix | HSIL_HPV | endoderm formation | 7/737 | 54/18723 | 5.04e-03 | 4.12e-02 | 7 |
| GO:00064701 | Colorectum | SER | protein dephosphorylation | 65/2897 | 281/18723 | 4.44e-04 | 6.51e-03 | 65 |
| GO:00434091 | Colorectum | SER | negative regulation of MAPK cascade | 45/2897 | 180/18723 | 5.81e-04 | 7.98e-03 | 45 |
| GO:00163111 | Colorectum | SER | dephosphorylation | 86/2897 | 417/18723 | 2.73e-03 | 2.46e-02 | 86 |
| GO:00073691 | Colorectum | SER | gastrulation | 43/2897 | 185/18723 | 3.44e-03 | 2.92e-02 | 43 |
| GO:001631110 | Esophagus | ESCC | dephosphorylation | 251/8552 | 417/18723 | 1.26e-09 | 2.99e-08 | 251 |
| GO:000647018 | Esophagus | ESCC | protein dephosphorylation | 177/8552 | 281/18723 | 3.13e-09 | 6.72e-08 | 177 |
| GO:00073698 | Esophagus | ESCC | gastrulation | 115/8552 | 185/18723 | 4.35e-06 | 4.64e-05 | 115 |
| GO:00074926 | Esophagus | ESCC | endoderm development | 54/8552 | 77/18723 | 1.20e-05 | 1.12e-04 | 54 |
| GO:00017064 | Esophagus | ESCC | endoderm formation | 38/8552 | 54/18723 | 2.08e-04 | 1.31e-03 | 38 |
| GO:00017044 | Esophagus | ESCC | formation of primary germ layer | 75/8552 | 121/18723 | 2.17e-04 | 1.36e-03 | 75 |
| Page: 1 2 3 4 5 |
| Pathway ID | Tissue | Disease Stage | Description | Gene Ratio | Bg Ratio | pvalue | p.adjust | qvalue | Count |
| hsa040109 | Cervix | CC | MAPK signaling pathway | 62/1267 | 302/8465 | 4.89e-03 | 1.67e-02 | 9.86e-03 | 62 |
| hsa0401012 | Cervix | CC | MAPK signaling pathway | 62/1267 | 302/8465 | 4.89e-03 | 1.67e-02 | 9.86e-03 | 62 |
| hsa0401014 | Oral cavity | OSCC | MAPK signaling pathway | 165/3704 | 302/8465 | 7.11e-05 | 2.74e-04 | 1.40e-04 | 165 |
| hsa0401015 | Oral cavity | OSCC | MAPK signaling pathway | 165/3704 | 302/8465 | 7.11e-05 | 2.74e-04 | 1.40e-04 | 165 |
| hsa0401023 | Oral cavity | EOLP | MAPK signaling pathway | 68/1218 | 302/8465 | 7.48e-05 | 3.40e-04 | 2.01e-04 | 68 |
| hsa0401033 | Oral cavity | EOLP | MAPK signaling pathway | 68/1218 | 302/8465 | 7.48e-05 | 3.40e-04 | 2.01e-04 | 68 |
| hsa0401041 | Oral cavity | NEOLP | MAPK signaling pathway | 59/1112 | 302/8465 | 9.40e-04 | 4.67e-03 | 2.94e-03 | 59 |
| hsa0401051 | Oral cavity | NEOLP | MAPK signaling pathway | 59/1112 | 302/8465 | 9.40e-04 | 4.67e-03 | 2.94e-03 | 59 |
| hsa0401010 | Prostate | BPH | MAPK signaling pathway | 87/1718 | 302/8465 | 2.05e-04 | 1.13e-03 | 6.98e-04 | 87 |
| hsa0401013 | Prostate | BPH | MAPK signaling pathway | 87/1718 | 302/8465 | 2.05e-04 | 1.13e-03 | 6.98e-04 | 87 |
| hsa0401022 | Prostate | Tumor | MAPK signaling pathway | 87/1791 | 302/8465 | 8.46e-04 | 3.94e-03 | 2.45e-03 | 87 |
| hsa0401032 | Prostate | Tumor | MAPK signaling pathway | 87/1791 | 302/8465 | 8.46e-04 | 3.94e-03 | 2.45e-03 | 87 |
| Page: 1 |
Top |
Cell-cell communication analysis |
| Identification of potential cell-cell interactions between two cell types and their ligand-receptor pairs for different disease states |
| Ligand | Receptor | LRpair | Pathway | Tissue | Disease Stage |
| Page: 1 |
Top |
Single-cell gene regulatory network inference analysis |
| Find out the significant the regulons (TFs) and the target genes of each regulon across cell types for different disease states |
| TF | Cell Type | Tissue | Disease Stage | Target Gene | RSS | Regulon Activity |
| ∗The dot plots of a searched regulon are shown for all cell subpopulations in each disease state of each tissue based on the regulon specific score inferred using pySCENIC and by calculating the average expression. |
| Page: 1 |
Top |
Somatic mutation of malignant transformation related genes |
| Annotation of somatic variants for genes involved in malignant transformation |
| Hugo Symbol | Variant Class | Variant Classification | dbSNP RS | HGVSc | HGVSp | HGVSp Short | SWISSPROT | BIOTYPE | SIFT | PolyPhen | Tumor Sample Barcode | Tissue | Histology | Sex | Age | Stage | Therapy Types | Drugs | Outcome |
| DUSP5 | insertion | Nonsense_Mutation | novel | c.913_914insTTTTTTCCTCTCTCAAATGAACAA | p.Gly305delinsValPheSerSerLeuLysTerThrSer | p.G305delinsVFSSLK*TS | Q16690 | protein_coding | TCGA-AO-A0JB-01 | Breast | breast invasive carcinoma | Female | <65 | III/IV | Chemotherapy | cyclophosphamide | SD | ||
| DUSP5 | insertion | Frame_Shift_Ins | novel | c.797_798insCACTT | p.Ile267ThrfsTer2 | p.I267Tfs*2 | Q16690 | protein_coding | TCGA-BH-A0HF-01 | Breast | breast invasive carcinoma | Female | >=65 | I/II | Hormone Therapy | arimidex | SD | ||
| DUSP5 | insertion | Frame_Shift_Ins | novel | c.799_800insCTCAAGCTCCATGCTGTATGCACAGAAAAGTTGGCATCTTT | p.Ile267ThrfsTer27 | p.I267Tfs*27 | Q16690 | protein_coding | TCGA-BH-A0HF-01 | Breast | breast invasive carcinoma | Female | >=65 | I/II | Hormone Therapy | arimidex | SD | ||
| DUSP5 | SNV | Missense_Mutation | c.388N>A | p.Glu130Lys | p.E130K | Q16690 | protein_coding | deleterious(0.02) | possibly_damaging(0.824) | TCGA-C5-A1MK-01 | Cervix | cervical & endocervical cancer | Female | >=65 | III/IV | Chemotherapy | carboplatin | PD | |
| DUSP5 | SNV | Missense_Mutation | rs370573010 | c.388G>C | p.Glu130Gln | p.E130Q | Q16690 | protein_coding | deleterious(0.02) | possibly_damaging(0.526) | TCGA-IR-A3LA-01 | Cervix | cervical & endocervical cancer | Female | <65 | I/II | Chemotherapy | cisplatin | CR |
| DUSP5 | SNV | Missense_Mutation | rs141147474 | c.1076N>T | p.Ser359Leu | p.S359L | Q16690 | protein_coding | deleterious(0) | probably_damaging(0.994) | TCGA-AA-A00N-01 | Colorectum | colon adenocarcinoma | Male | >=65 | I/II | Unknown | Unknown | PD |
| DUSP5 | SNV | Missense_Mutation | c.91N>C | p.Tyr31His | p.Y31H | Q16690 | protein_coding | deleterious(0) | probably_damaging(0.999) | TCGA-AM-5821-01 | Colorectum | colon adenocarcinoma | Female | >=65 | I/II | Unknown | Unknown | SD | |
| DUSP5 | SNV | Missense_Mutation | rs775205143 | c.940G>A | p.Glu314Lys | p.E314K | Q16690 | protein_coding | deleterious(0.02) | benign(0.134) | TCGA-AZ-4315-01 | Colorectum | colon adenocarcinoma | Male | <65 | I/II | Unknown | Unknown | SD |
| DUSP5 | SNV | Missense_Mutation | novel | c.739N>T | p.Asp247Tyr | p.D247Y | Q16690 | protein_coding | deleterious(0) | probably_damaging(0.983) | TCGA-CA-6717-01 | Colorectum | colon adenocarcinoma | Male | <65 | I/II | Chemotherapy | oxaliplatin | CR |
| DUSP5 | SNV | Missense_Mutation | rs144264318 | c.640N>T | p.Arg214Trp | p.R214W | Q16690 | protein_coding | tolerated(0.07) | benign(0.042) | TCGA-F4-6806-01 | Colorectum | colon adenocarcinoma | Female | <65 | I/II | Chemotherapy | irinotecan | PD |
| Page: 1 2 3 4 5 6 |
Top |
Related drugs of malignant transformation related genes |
| Identification of chemicals and drugs interact with genes involved in malignant transfromation |
| (DGIdb 4.0) |
| Entrez ID | Symbol | Category | Interaction Types | Drug Claim Name | Drug Name | PMIDs |
| Page: 1 |

Copyright 2023-Present -The University of Texas Health Science Center at Houston |