
|
|||||
|
 | |
| |
| |
| |
| |
| |
|
Gene: DNPH1 |
Gene summary for DNPH1 |
| Gene information | Species | Human | Gene symbol | DNPH1 | Gene ID | 10591 |
| Gene name | 2'-deoxynucleoside 5'-phosphate N-hydrolase 1 | |
| Gene Alias | C6orf108 | |
| Cytomap | 6p21.1 | |
| Gene Type | protein-coding | GO ID | GO:0000255 | UniProtAcc | O43598 |
Top |
Malignant transformation analysis |
| Identification of the aberrant gene expression in precancerous and cancerous lesions by comparing the gene expression of stem-like cells in diseased tissues with normal stem cells |
| Entrez ID | Symbol | Replicates | Species | Organ | Tissue | Adj P-value | Log2FC | Malignancy |
| 10591 | DNPH1 | AEH-subject3 | Human | Endometrium | AEH | 3.55e-05 | -4.22e-02 | -0.2576 |
| 10591 | DNPH1 | AEH-subject4 | Human | Endometrium | AEH | 1.87e-04 | -1.70e-01 | -0.2657 |
| 10591 | DNPH1 | AEH-subject5 | Human | Endometrium | AEH | 1.13e-10 | -3.59e-01 | -0.2953 |
| 10591 | DNPH1 | EEC-subject1 | Human | Endometrium | EEC | 1.99e-10 | -2.34e-01 | -0.2682 |
| 10591 | DNPH1 | EEC-subject2 | Human | Endometrium | EEC | 1.57e-02 | -1.22e-01 | -0.2607 |
| 10591 | DNPH1 | EEC-subject3 | Human | Endometrium | EEC | 1.26e-43 | -4.20e-01 | -0.2525 |
| 10591 | DNPH1 | EEC-subject4 | Human | Endometrium | EEC | 1.27e-03 | -3.18e-02 | -0.2571 |
| 10591 | DNPH1 | EEC-subject5 | Human | Endometrium | EEC | 2.97e-06 | -1.98e-01 | -0.249 |
| 10591 | DNPH1 | GSM5276934 | Human | Endometrium | EEC | 1.88e-13 | -3.44e-01 | -0.0913 |
| 10591 | DNPH1 | GSM5276937 | Human | Endometrium | EEC | 5.09e-05 | -3.29e-01 | -0.0897 |
| 10591 | DNPH1 | GSM6177620_NYU_UCEC1_lib1_lib1 | Human | Endometrium | EEC | 2.04e-18 | -2.31e-01 | -0.1869 |
| 10591 | DNPH1 | GSM6177620_NYU_UCEC1_lib2_lib2 | Human | Endometrium | EEC | 7.18e-16 | -2.10e-01 | -0.1875 |
| 10591 | DNPH1 | GSM6177620_NYU_UCEC1_lib3_lib3 | Human | Endometrium | EEC | 2.97e-23 | -1.80e-01 | -0.1883 |
| 10591 | DNPH1 | GSM6177621_NYU_UCEC2_lib1_lib1 | Human | Endometrium | EEC | 1.69e-21 | -1.38e-01 | -0.1934 |
| 10591 | DNPH1 | GSM6177622_NYU_UCEC3_lib1_lib1 | Human | Endometrium | EEC | 3.30e-39 | -2.33e-01 | -0.1917 |
| 10591 | DNPH1 | GSM6177622_NYU_UCEC3_lib2_lib2 | Human | Endometrium | EEC | 2.11e-30 | -1.94e-01 | -0.1916 |
| 10591 | DNPH1 | GSM6177623_NYU_UCEC3_Vis | Human | Endometrium | EEC | 1.14e-02 | -1.22e-01 | -0.1269 |
| 10591 | DNPH1 | LZE2T | Human | Esophagus | ESCC | 9.03e-17 | 2.35e+00 | 0.082 |
| 10591 | DNPH1 | LZE4T | Human | Esophagus | ESCC | 1.42e-33 | 1.03e+00 | 0.0811 |
| 10591 | DNPH1 | LZE5T | Human | Esophagus | ESCC | 3.96e-07 | 8.71e-01 | 0.0514 |
| Page: 1 2 3 4 5 6 7 8 9 10 11 12 |
| Tissue | Expression Dynamics | Abbreviation |
| Breast |  | IDC: Invasive ductal carcinoma |
| DCIS: Ductal carcinoma in situ | ||
| Precancer(BRCA1-mut): Precancerous lesion from BRCA1 mutation carriers | ||
| Colorectum (GSE201348) |  | FAP: Familial adenomatous polyposis |
| CRC: Colorectal cancer | ||
| Colorectum (HTA11) |  | AD: Adenomas |
| SER: Sessile serrated lesions | ||
| MSI-H: Microsatellite-high colorectal cancer | ||
| MSS: Microsatellite stable colorectal cancer | ||
| Endometrium | 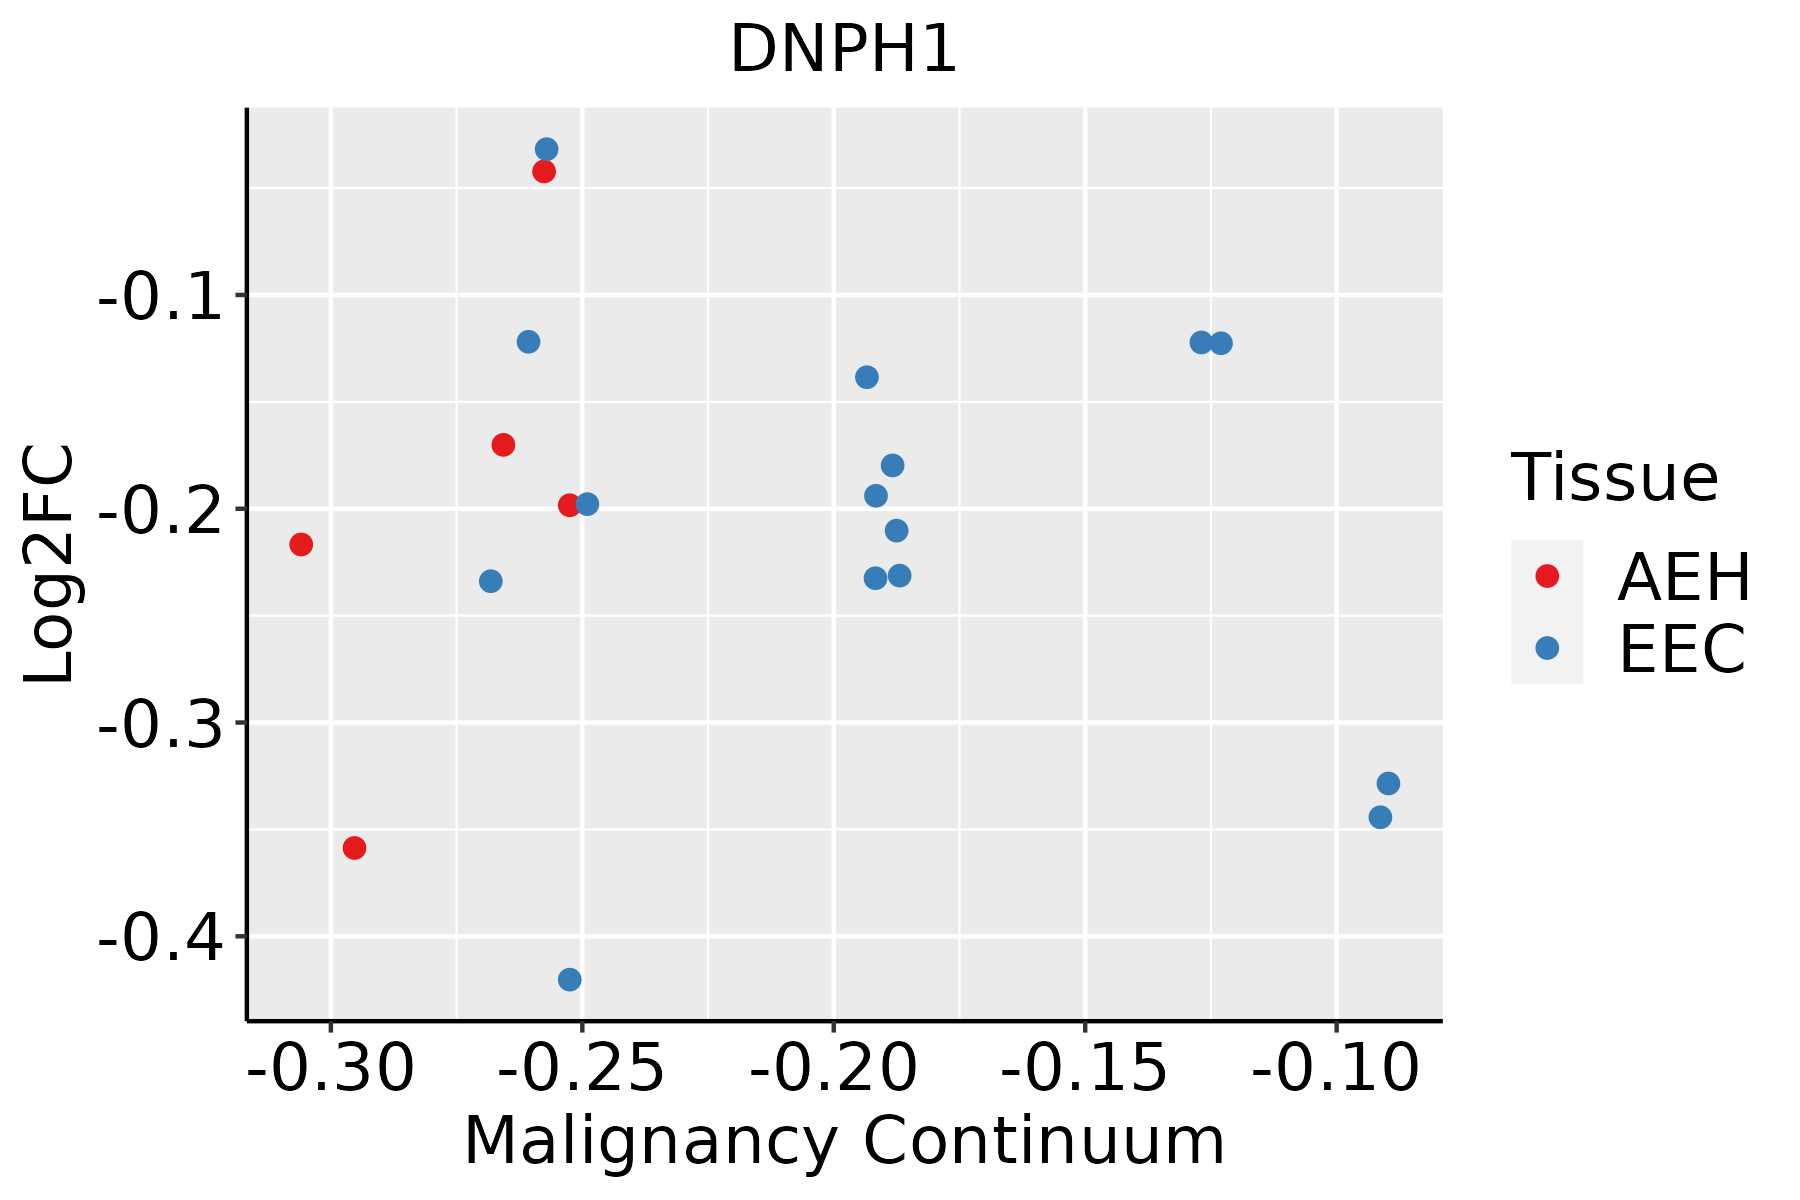 | AEH: Atypical endometrial hyperplasia |
| EEC: Endometrioid Cancer | ||
| Esophagus | 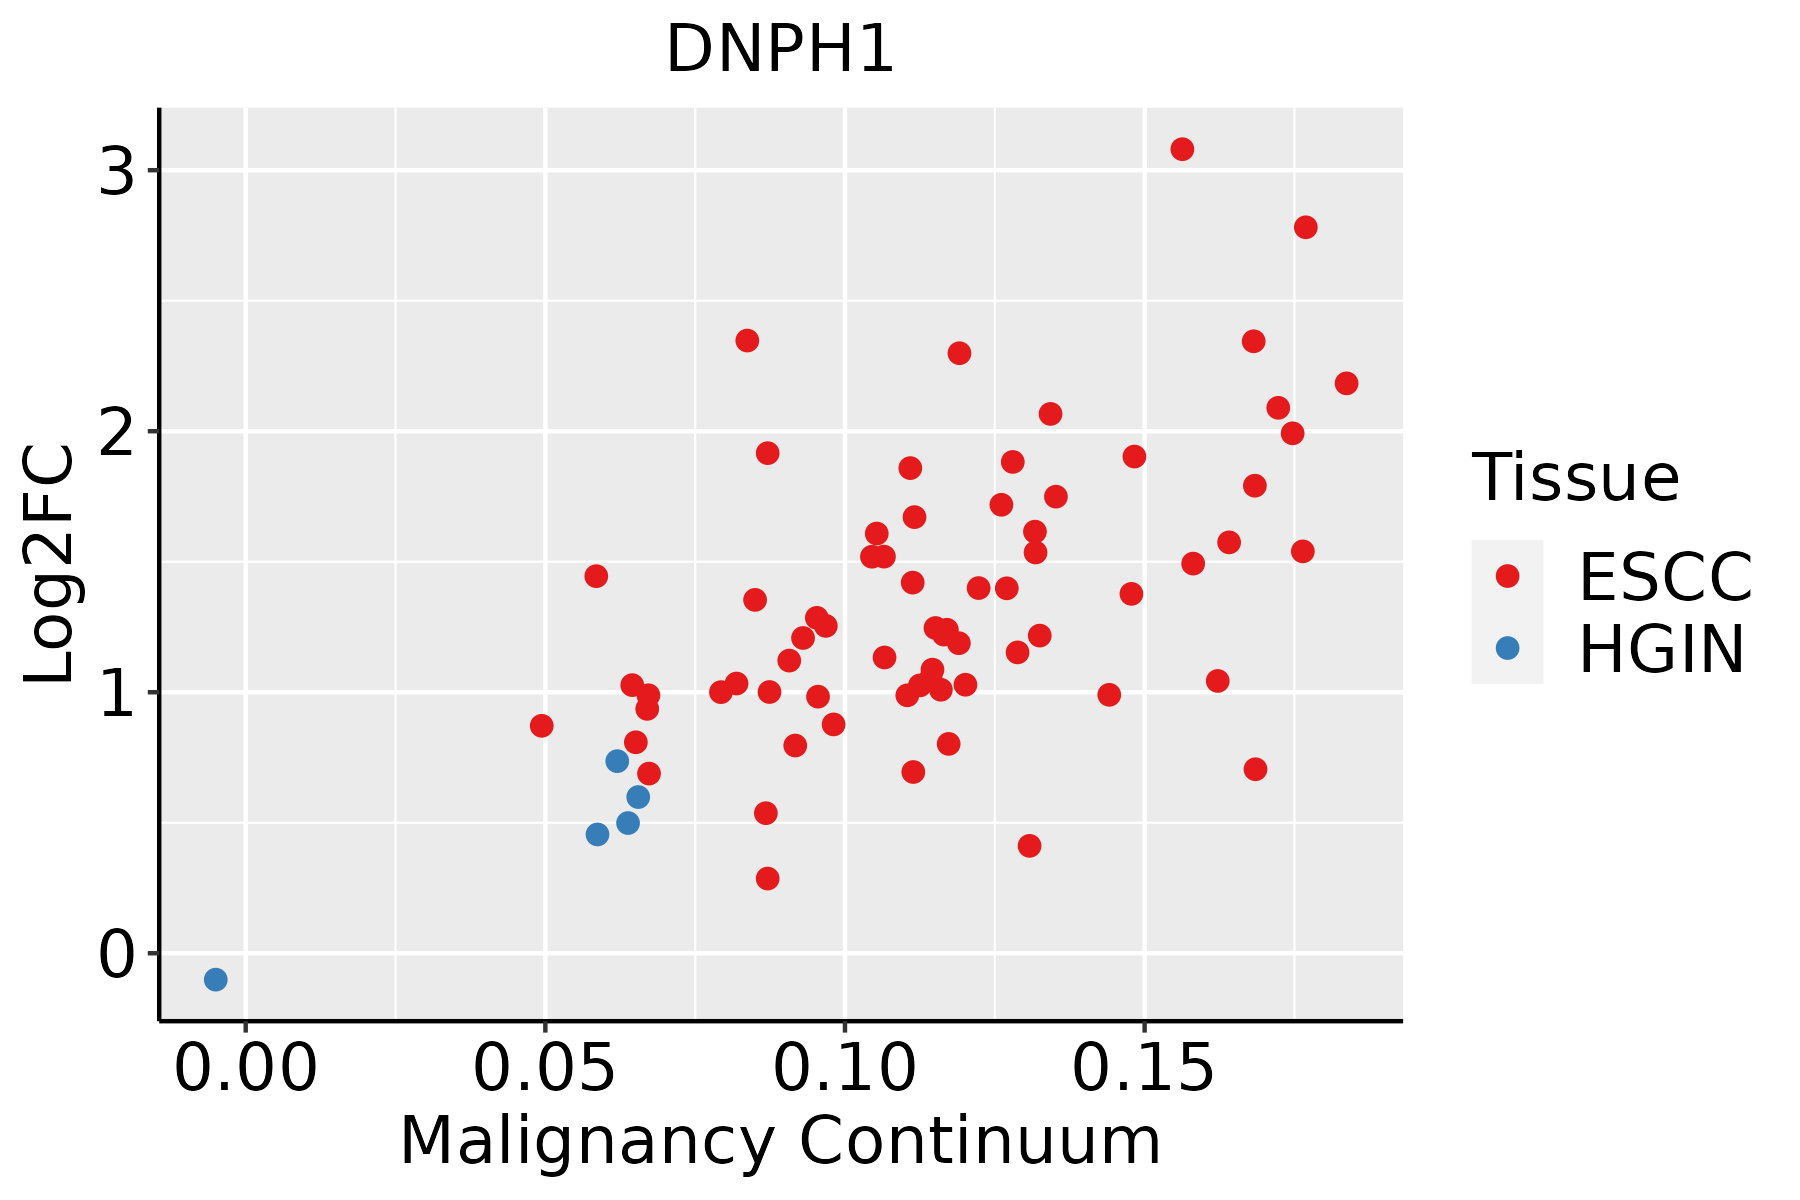 | ESCC: Esophageal squamous cell carcinoma |
| HGIN: High-grade intraepithelial neoplasias | ||
| LGIN: Low-grade intraepithelial neoplasias | ||
| GC |  | CAG: Chronic atrophic gastritis |
| CAG with IM: Chronic atrophic gastritis with intestinal metaplasia | ||
| CSG: Chronic superficial gastritis | ||
| GC: Gastric cancer | ||
| SIM: Severe intestinal metaplasia | ||
| WIM: Wild intestinal metaplasia | ||
| Liver | 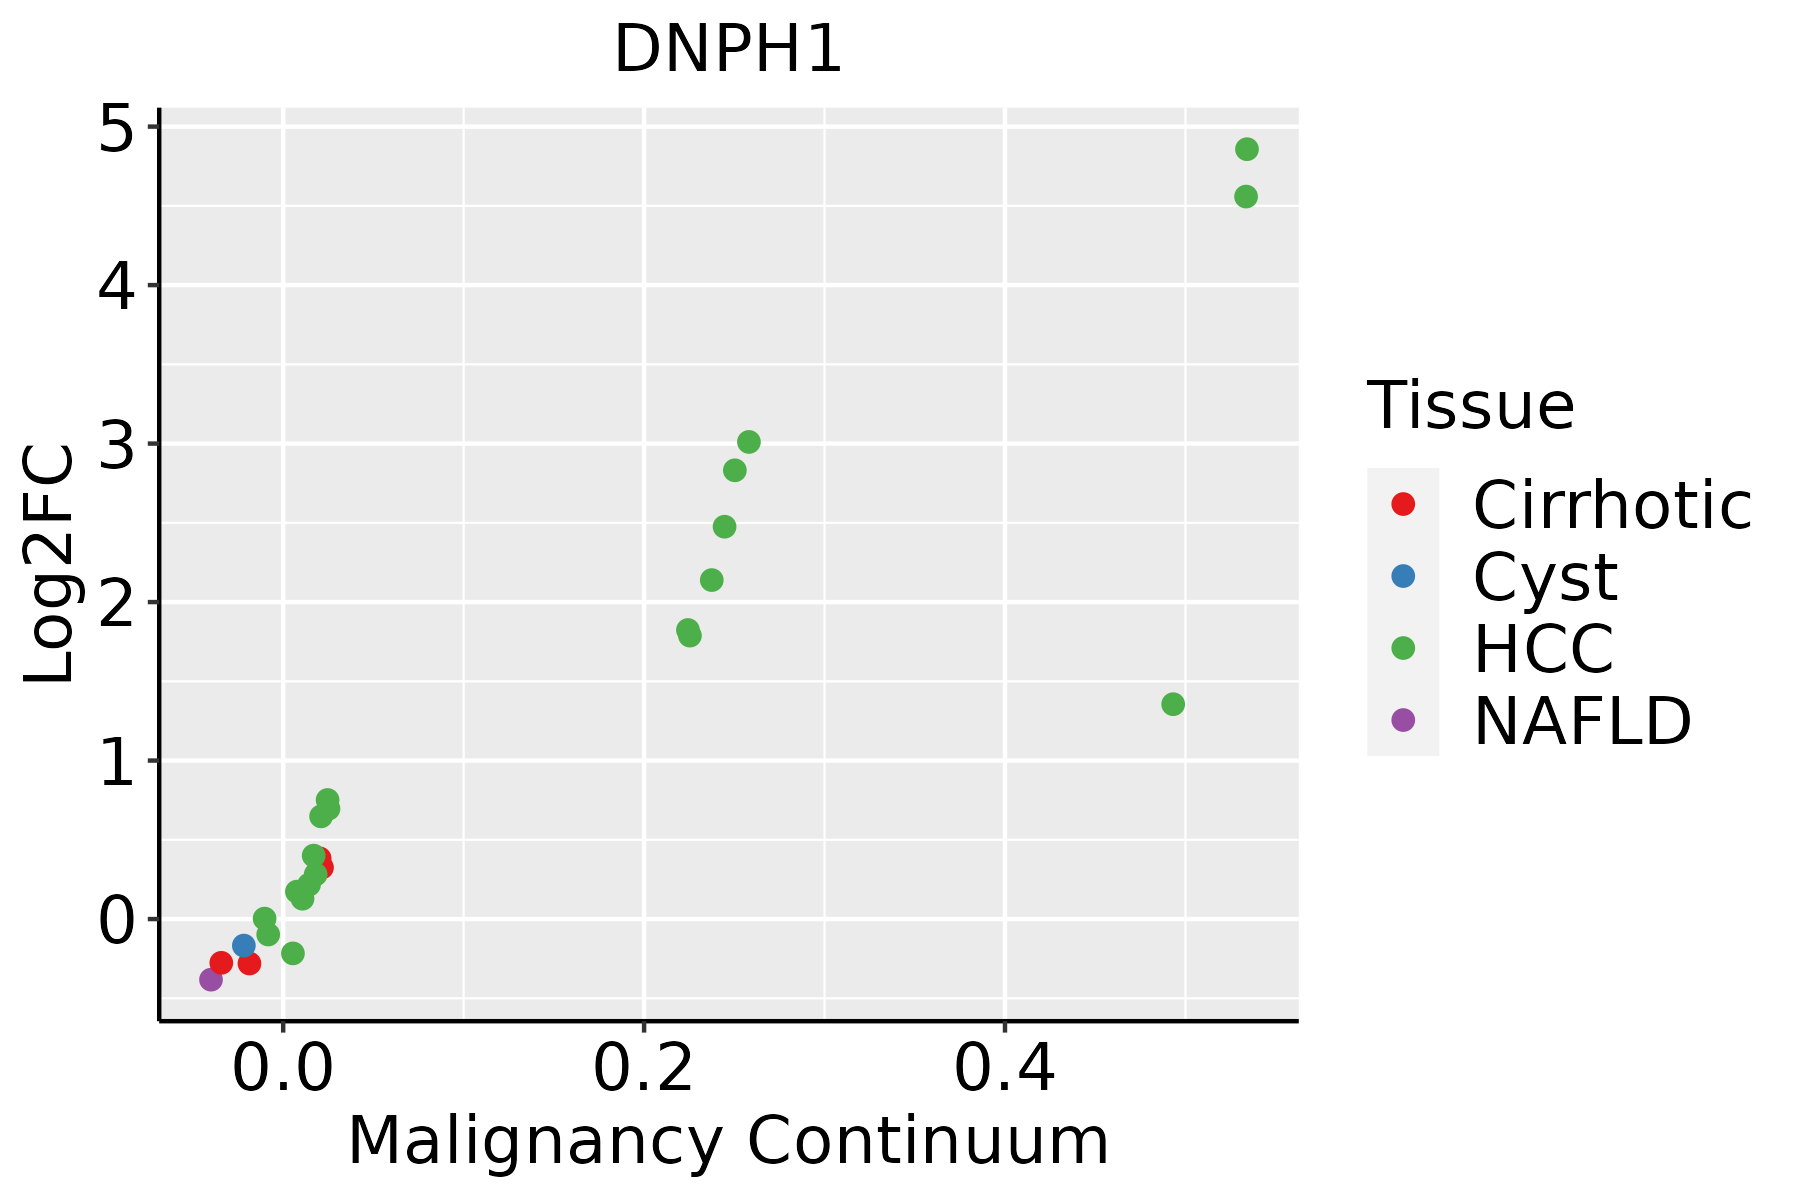 | HCC: Hepatocellular carcinoma |
| NAFLD: Non-alcoholic fatty liver disease | ||
| Oral Cavity | 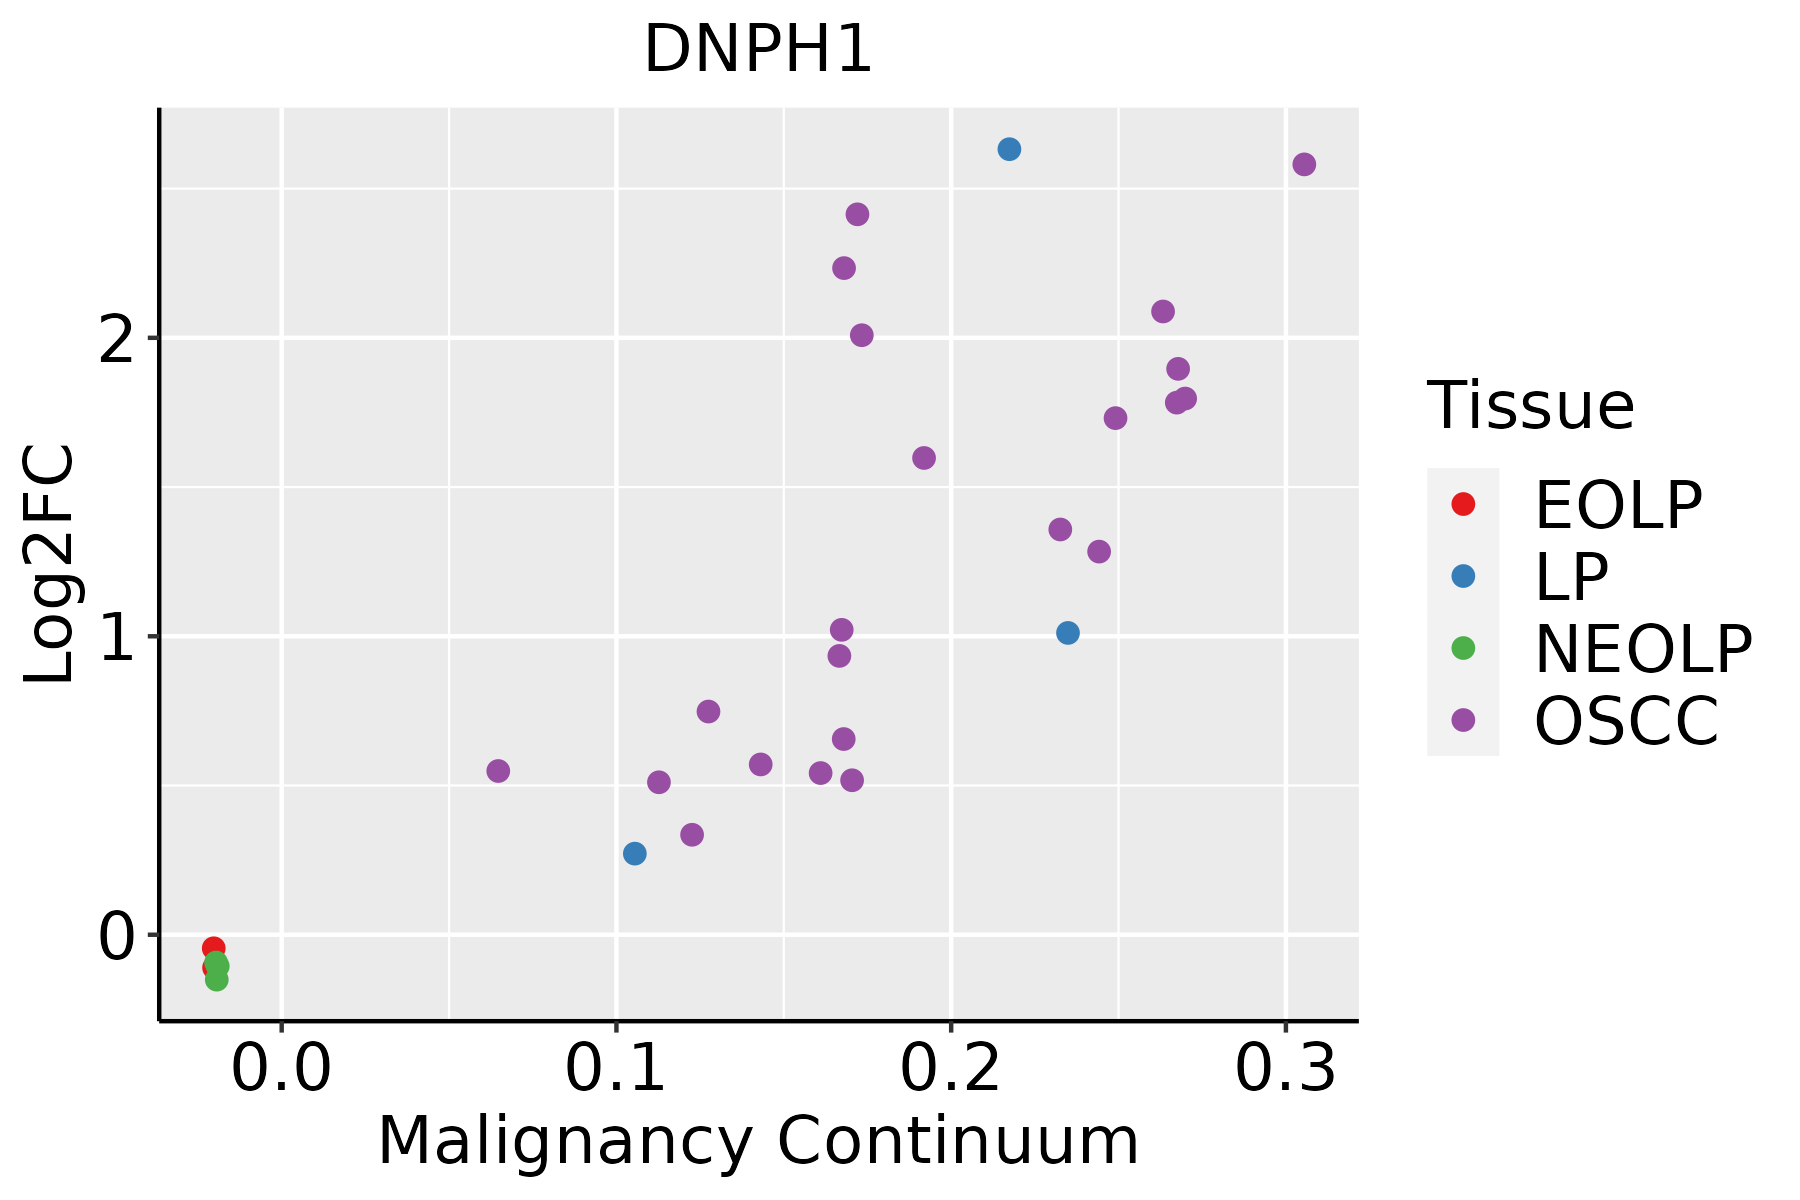 | EOLP: Erosive Oral lichen planus |
| LP: leukoplakia | ||
| NEOLP: Non-erosive oral lichen planus | ||
| OSCC: Oral squamous cell carcinoma | ||
| Prostate | 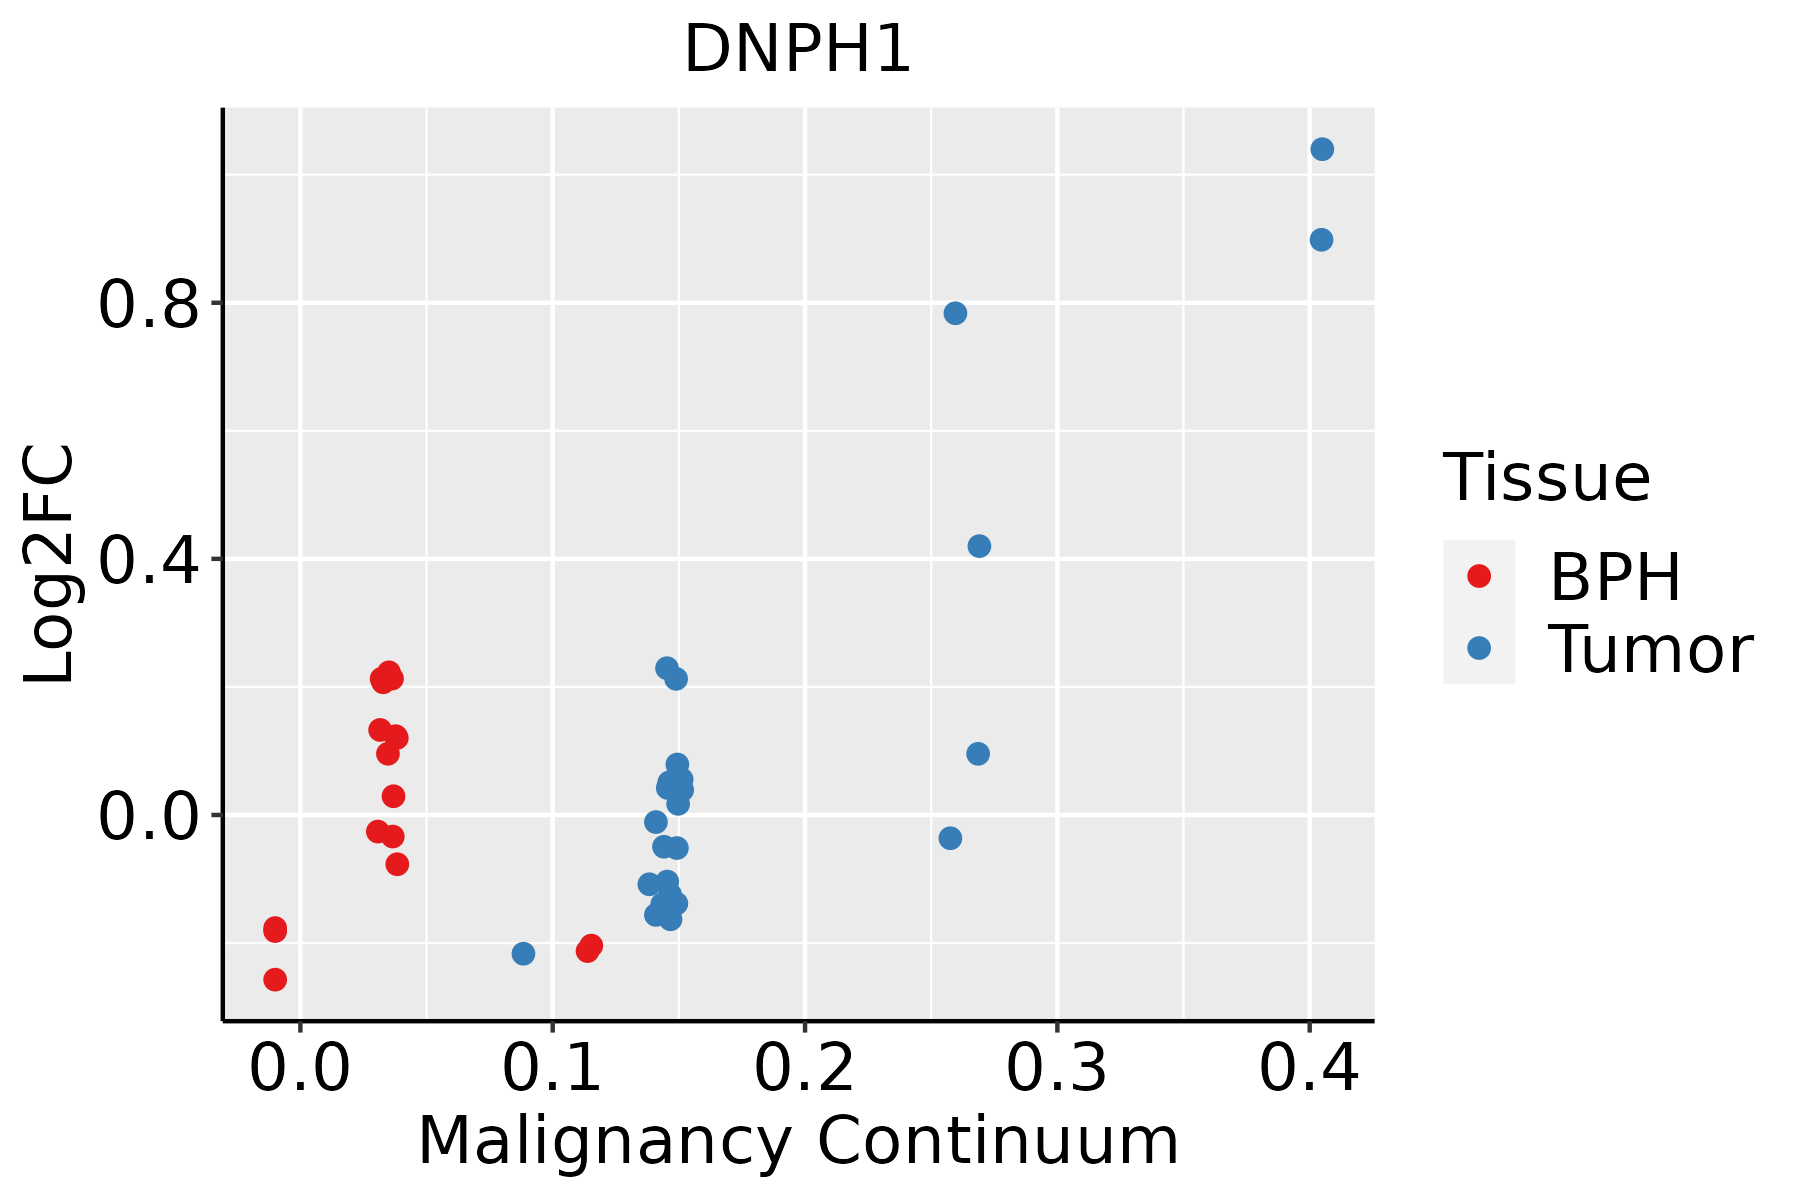 | BPH: Benign Prostatic Hyperplasia |
| Skin |  | AK: Actinic keratosis |
| cSCC: Cutaneous squamous cell carcinoma | ||
| SCCIS:squamous cell carcinoma in situ | ||
| Thyroid | 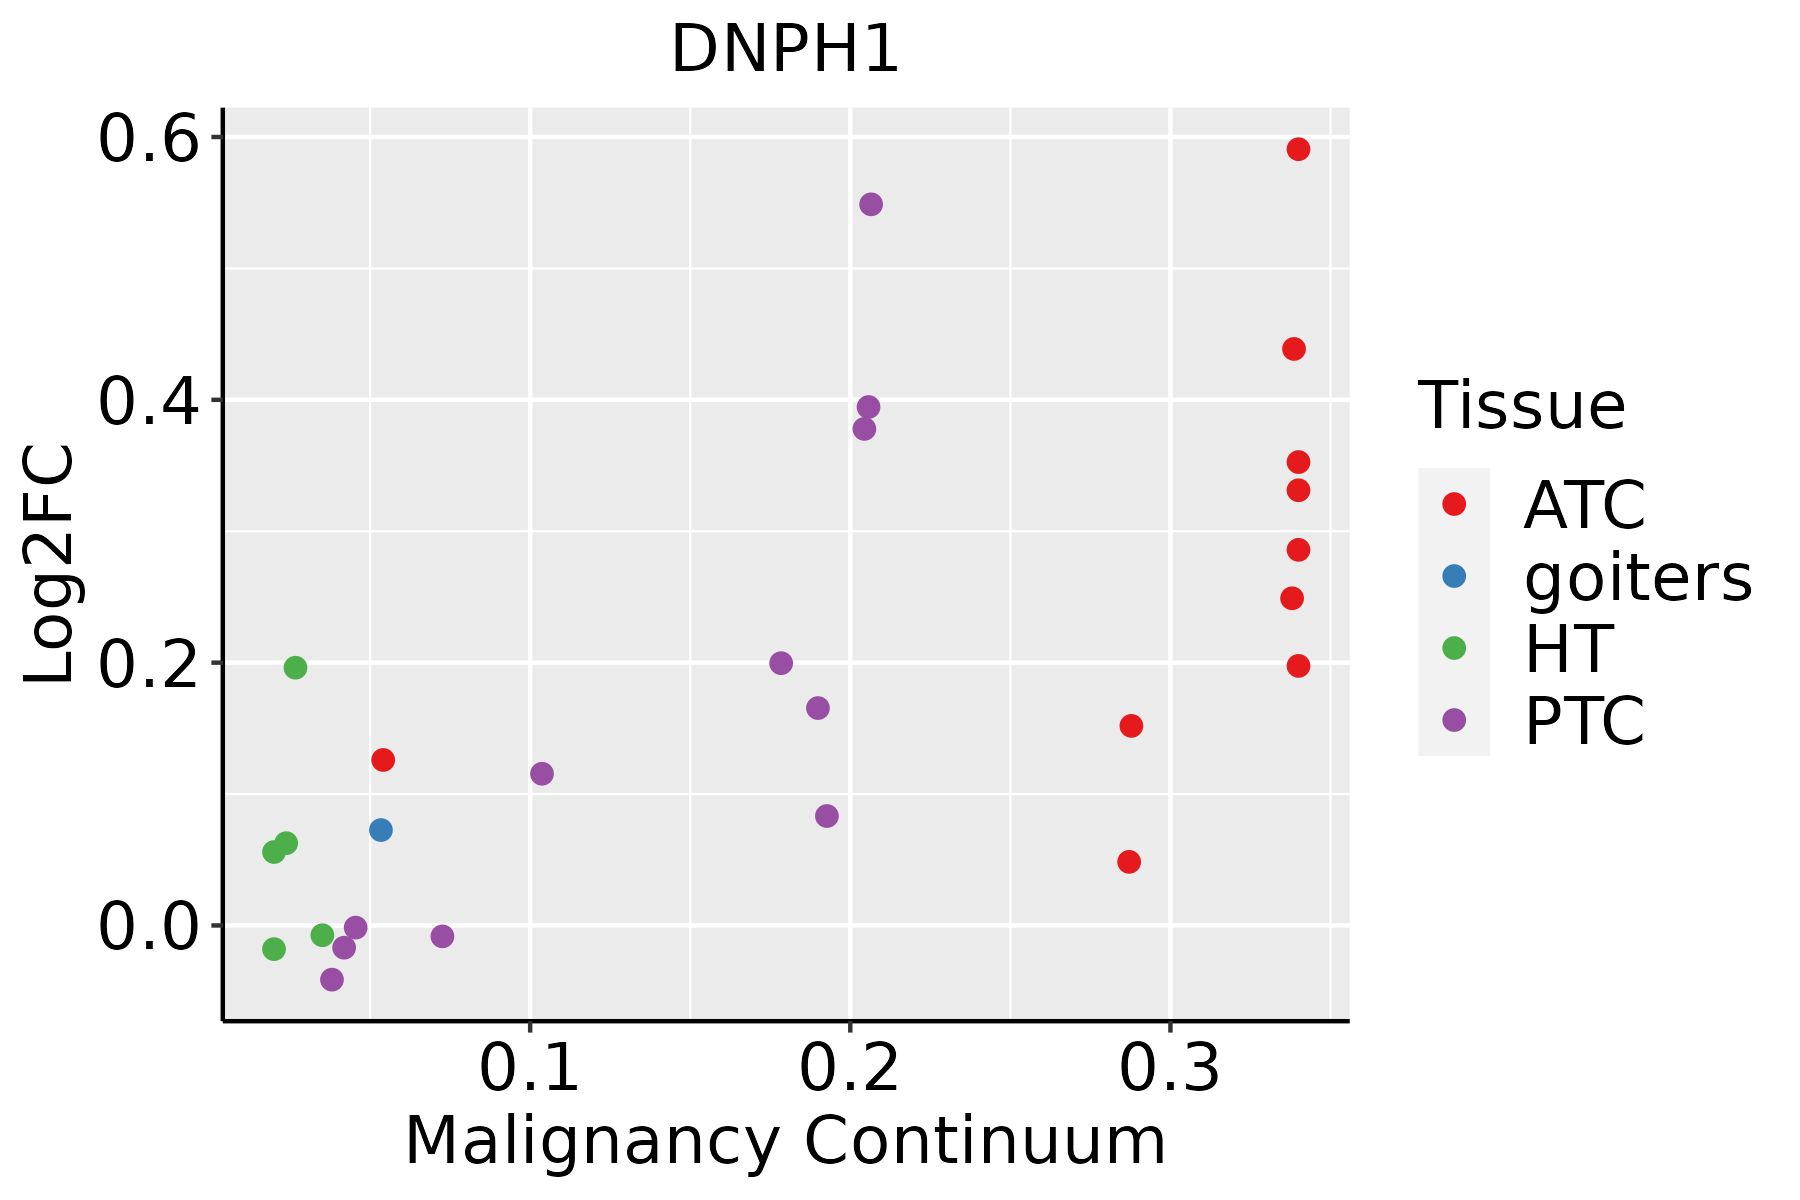 | ATC: Anaplastic thyroid cancer |
| HT: Hashimoto's thyroiditis | ||
| PTC: Papillary thyroid cancer |
| ∗log2FC in expression of this searched gene in stem-like cells from each diseased tissue sample relative to stem-like cells in normal samples in each tissue plotted against the malignancy continuum. Samples are colored based on if they are from different disease stage. |
Top |
Malignant transformation related pathway analysis |
| Find out the enriched GO biological processes and KEGG pathways involved in transition from healthy to precancer to cancer |
| Tissue | Disease Stage | Enriched GO biological Processes |
| Colorectum | AD |  |
| Colorectum | SER |  |
| Colorectum | MSS |  |
| Colorectum | MSI-H |  |
| Colorectum | FAP |  |
| ∗Top 15 enriched GO BP terms are showed in the bar plot of each disease state in each tissue. Each row represents a significant GO biological process which is colored according to the -log10(p.adjust). |
| Page: 1 2 3 4 5 6 7 8 9 |
| GO ID | Tissue | Disease Stage | Description | Gene Ratio | Bg Ratio | pvalue | p.adjust | Count |
| GO:00091179 | Breast | Precancer | nucleotide metabolic process | 56/1080 | 489/18723 | 7.40e-07 | 3.00e-05 | 56 |
| GO:00067539 | Breast | Precancer | nucleoside phosphate metabolic process | 56/1080 | 497/18723 | 1.24e-06 | 4.70e-05 | 56 |
| GO:00061639 | Breast | Precancer | purine nucleotide metabolic process | 47/1080 | 396/18723 | 2.14e-06 | 7.50e-05 | 47 |
| GO:00725219 | Breast | Precancer | purine-containing compound metabolic process | 47/1080 | 416/18723 | 8.19e-06 | 2.20e-04 | 47 |
| GO:00346558 | Breast | Precancer | nucleobase-containing compound catabolic process | 42/1080 | 407/18723 | 1.91e-04 | 3.06e-03 | 42 |
| GO:00467007 | Breast | Precancer | heterocycle catabolic process | 44/1080 | 445/18723 | 3.49e-04 | 4.88e-03 | 44 |
| GO:00442708 | Breast | Precancer | cellular nitrogen compound catabolic process | 44/1080 | 451/18723 | 4.64e-04 | 6.12e-03 | 44 |
| GO:00160497 | Breast | Precancer | cell growth | 46/1080 | 482/18723 | 5.63e-04 | 7.16e-03 | 46 |
| GO:00194397 | Breast | Precancer | aromatic compound catabolic process | 44/1080 | 467/18723 | 9.55e-04 | 1.07e-02 | 44 |
| GO:19013617 | Breast | Precancer | organic cyclic compound catabolic process | 45/1080 | 495/18723 | 1.73e-03 | 1.74e-02 | 45 |
| GO:00015587 | Breast | Precancer | regulation of cell growth | 39/1080 | 414/18723 | 1.81e-03 | 1.78e-02 | 39 |
| GO:000675313 | Breast | IDC | nucleoside phosphate metabolic process | 68/1434 | 497/18723 | 2.01e-06 | 8.23e-05 | 68 |
| GO:000911713 | Breast | IDC | nucleotide metabolic process | 67/1434 | 489/18723 | 2.28e-06 | 9.05e-05 | 67 |
| GO:000616314 | Breast | IDC | purine nucleotide metabolic process | 56/1434 | 396/18723 | 5.90e-06 | 1.90e-04 | 56 |
| GO:007252114 | Breast | IDC | purine-containing compound metabolic process | 57/1434 | 416/18723 | 1.28e-05 | 3.31e-04 | 57 |
| GO:001604913 | Breast | IDC | cell growth | 56/1434 | 482/18723 | 1.16e-03 | 1.26e-02 | 56 |
| GO:000155813 | Breast | IDC | regulation of cell growth | 49/1434 | 414/18723 | 1.55e-03 | 1.55e-02 | 49 |
| GO:190136112 | Breast | IDC | organic cyclic compound catabolic process | 56/1434 | 495/18723 | 2.12e-03 | 1.99e-02 | 56 |
| GO:004670012 | Breast | IDC | heterocycle catabolic process | 51/1434 | 445/18723 | 2.51e-03 | 2.25e-02 | 51 |
| GO:003465513 | Breast | IDC | nucleobase-containing compound catabolic process | 47/1434 | 407/18723 | 3.12e-03 | 2.63e-02 | 47 |
| Page: 1 2 3 4 5 6 7 8 9 10 11 12 13 14 15 16 17 18 |
| Pathway ID | Tissue | Disease Stage | Description | Gene Ratio | Bg Ratio | pvalue | p.adjust | qvalue | Count |
| Page: 1 |
Top |
Cell-cell communication analysis |
| Identification of potential cell-cell interactions between two cell types and their ligand-receptor pairs for different disease states |
| Ligand | Receptor | LRpair | Pathway | Tissue | Disease Stage |
| Page: 1 |
Top |
Single-cell gene regulatory network inference analysis |
| Find out the significant the regulons (TFs) and the target genes of each regulon across cell types for different disease states |
| TF | Cell Type | Tissue | Disease Stage | Target Gene | RSS | Regulon Activity |
| ∗The dot plots of a searched regulon are shown for all cell subpopulations in each disease state of each tissue based on the regulon specific score inferred using pySCENIC and by calculating the average expression. |
| Page: 1 |
Top |
Somatic mutation of malignant transformation related genes |
| Annotation of somatic variants for genes involved in malignant transformation |
| Hugo Symbol | Variant Class | Variant Classification | dbSNP RS | HGVSc | HGVSp | HGVSp Short | SWISSPROT | BIOTYPE | SIFT | PolyPhen | Tumor Sample Barcode | Tissue | Histology | Sex | Age | Stage | Therapy Types | Drugs | Outcome |
| DNPH1 | insertion | Frame_Shift_Ins | rs754125969 | c.255_256insAAAGC | p.Gln86LysfsTer11 | p.Q86Kfs*11 | O43598 | protein_coding | TCGA-A8-A091-01 | Breast | breast invasive carcinoma | Female | <65 | I/II | Chemotherapy | 5-fluorouracil | PD | ||
| DNPH1 | SNV | Missense_Mutation | rs763494634 | c.341N>A | p.Arg114Gln | p.R114Q | O43598 | protein_coding | tolerated(0.31) | benign(0.02) | TCGA-C5-A1ML-01 | Cervix | cervical & endocervical cancer | Female | <65 | I/II | Unknown | Unknown | PD |
| DNPH1 | SNV | Missense_Mutation | novel | c.274G>A | p.Ala92Thr | p.A92T | O43598 | protein_coding | deleterious(0) | probably_damaging(1) | TCGA-AJ-A3EK-01 | Endometrium | uterine corpus endometrioid carcinoma | Female | <65 | I/II | Chemotherapy | carboplatin | CR |
| DNPH1 | SNV | Missense_Mutation | c.221G>T | p.Arg74Met | p.R74M | O43598 | protein_coding | deleterious(0.01) | possibly_damaging(0.564) | TCGA-AP-A059-01 | Endometrium | uterine corpus endometrioid carcinoma | Female | >=65 | I/II | Unknown | Unknown | SD | |
| DNPH1 | SNV | Missense_Mutation | rs749012747 | c.416N>A | p.Arg139Gln | p.R139Q | O43598 | protein_coding | tolerated(0.37) | benign(0) | TCGA-B5-A0K6-01 | Endometrium | uterine corpus endometrioid carcinoma | Female | <65 | I/II | Unknown | Unknown | SD |
| DNPH1 | SNV | Missense_Mutation | c.463G>T | p.Asp155Tyr | p.D155Y | O43598 | protein_coding | deleterious(0) | benign(0.243) | TCGA-G3-A25U-01 | Liver | liver hepatocellular carcinoma | Female | <65 | I/II | Unknown | Unknown | SD | |
| DNPH1 | SNV | Missense_Mutation | c.206N>T | p.Ala69Val | p.A69V | O43598 | protein_coding | tolerated(0.1) | benign(0.045) | TCGA-BR-8363-01 | Stomach | stomach adenocarcinoma | Female | >=65 | I/II | Unknown | Unknown | SD | |
| DNPH1 | insertion | Frame_Shift_Ins | novel | c.209_210insAT | p.Gly71LeufsTer25 | p.G71Lfs*25 | O43598 | protein_coding | TCGA-FY-A4B0-01 | Thyroid | thyroid carcinoma | Male | >=65 | I/II | Hormone Therapy | synthroid | SD |
| Page: 1 |
Top |
Related drugs of malignant transformation related genes |
| Identification of chemicals and drugs interact with genes involved in malignant transfromation |
| (DGIdb 4.0) |
| Entrez ID | Symbol | Category | Interaction Types | Drug Claim Name | Drug Name | PMIDs |
| Page: 1 |

Copyright 2023-Present -The University of Texas Health Science Center at Houston |