Schematic overview of the cellular and molecular mechanisms involved in the cancer progression, including the proposed cellular and molecular mechanisms in cancer cells trajectory. AT1: alveolar type 1 cells; AT2: alveolar type 2 cells; AAH: atypical adenomatous hyperplasia; AIS: adenocarcinoma in situ; MIA: minimally invasive adenocarcinoma; IA: invasive adenocarcinoma; EMT: epithelial-mesenchymal transition

Home

Download

Statistics

Help

Contact

Center for Computational Systems Medicine
leaf

Gene summary

leaf

Malignant transformation analysis

leaf

Malignant transformation related pathway analysis

leaf

Cell-cell communication analysis

leaf

Single-cell gene regulatory network inference analysis

leaf

Somatic mutation of malignant transformation related genes

leaf

Related drugs of malignant transformation related genes

Gene: DHX29

Gene summary for DHX29

check button Gene summary.

Gene informationSpeciesHuman
Gene symbol

DHX29

Gene ID

54505

Gene nameDExH-box helicase 29
Gene AliasDDX29
Cytomap5q11.2
Gene Typeprotein-coding
GO ID

GO:0001731

UniProtAcc

Q7Z478


Top

Malignant transformation analysis

check button Identification of the aberrant gene expression in precancerous and cancerous lesions by comparing the gene expression of stem-like cells in diseased tissues with normal stem cells
check button Malignant transformation involving gene list.
Entrez IDSymbolReplicatesSpeciesOrganTissueAdj P-valueLog2FCMalignancy
54505DHX29P107T-EHumanEsophagusESCC2.85e-471.20e+000.171
54505DHX29P126T-EHumanEsophagusESCC8.47e-111.08e+000.1125
54505DHX29P127T-EHumanEsophagusESCC9.13e-245.34e-010.0826
54505DHX29P128T-EHumanEsophagusESCC2.68e-176.23e-010.1241
54505DHX29P130T-EHumanEsophagusESCC2.43e-561.05e+000.1676
54505DHX29HCC1_MengHumanLiverHCC4.70e-792.19e-010.0246
54505DHX29HCC2_MengHumanLiverHCC7.70e-12-2.33e-020.0107
54505DHX29cirrhotic1HumanLiverCirrhotic2.27e-092.24e-010.0202
54505DHX29cirrhotic2HumanLiverCirrhotic1.15e-027.76e-020.0201
54505DHX29HCC2HumanLiverHCC1.50e-184.58e+000.5341
54505DHX29Pt13.bHumanLiverHCC1.13e-213.49e-010.0251
54505DHX29Pt14.aHumanLiverHCC1.28e-053.94e-010.0169
54505DHX29S014HumanLiverHCC2.25e-229.80e-010.2254
54505DHX29S015HumanLiverHCC6.43e-201.12e+000.2375
54505DHX29S016HumanLiverHCC3.98e-219.55e-010.2243
54505DHX29S027HumanLiverHCC2.95e-078.27e-010.2446
54505DHX29S028HumanLiverHCC2.38e-106.71e-010.2503
54505DHX29S029HumanLiverHCC7.93e-191.02e+000.2581
54505DHX29C04HumanOral cavityOSCC3.40e-128.35e-010.2633
54505DHX29C21HumanOral cavityOSCC2.36e-571.65e+000.2678
Page: 1 2 3 4 5 6 7 

check button Transcriptomic changes along malignancy continuum.
TissueExpression DynamicsAbbreviation
EsophagusThe image shows the transcriptomic changes along malignancy continuum.log2FC in expression of this searched gene in stem-like cells from each diseased tissue sample relative to stem-like cells in normal samples in each tissue plotted against the malignancy continuum. Samples are colored based on if they are from different disease stage.
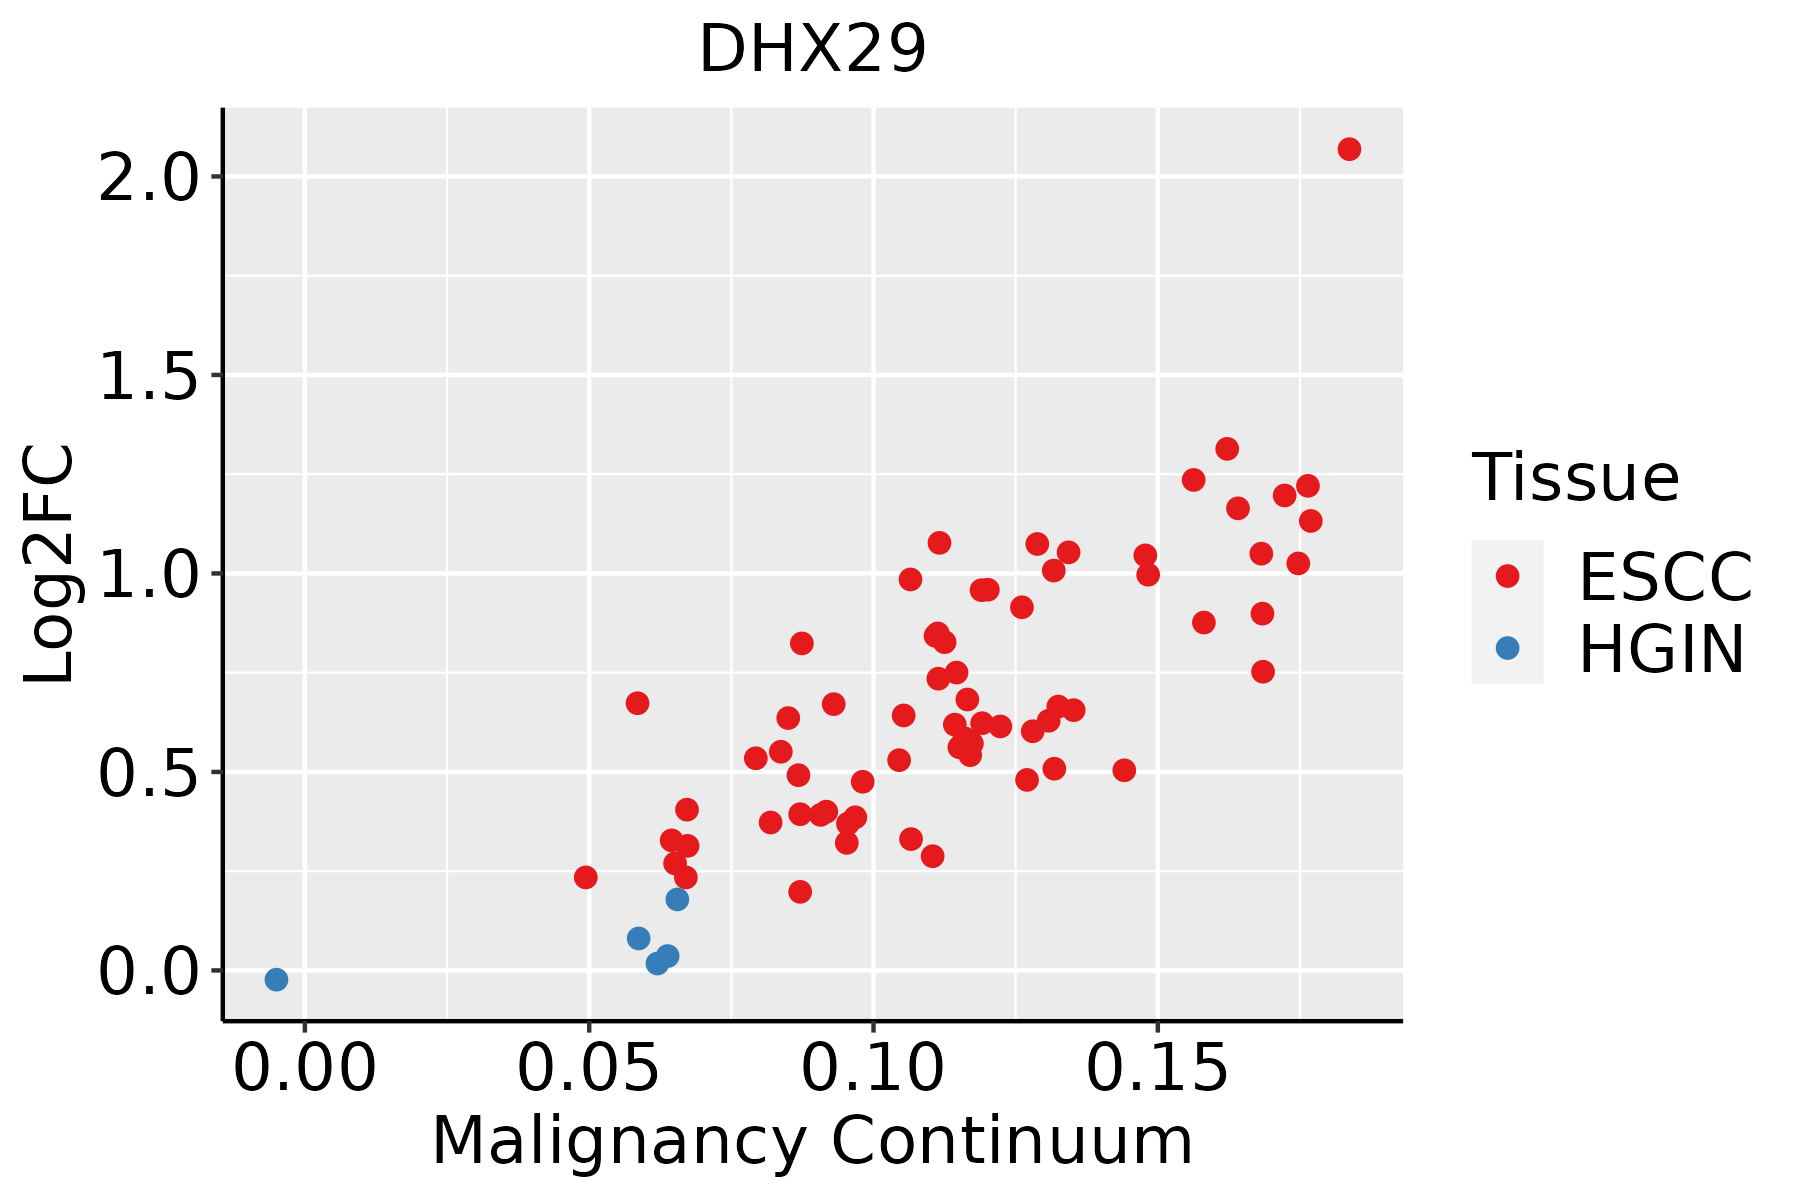
ESCC: Esophageal squamous cell carcinoma
HGIN: High-grade intraepithelial neoplasias
LGIN: Low-grade intraepithelial neoplasias
LiverThe image shows the transcriptomic changes along malignancy continuum.log2FC in expression of this searched gene in stem-like cells from each diseased tissue sample relative to stem-like cells in normal samples in each tissue plotted against the malignancy continuum. Samples are colored based on if they are from different disease stage.
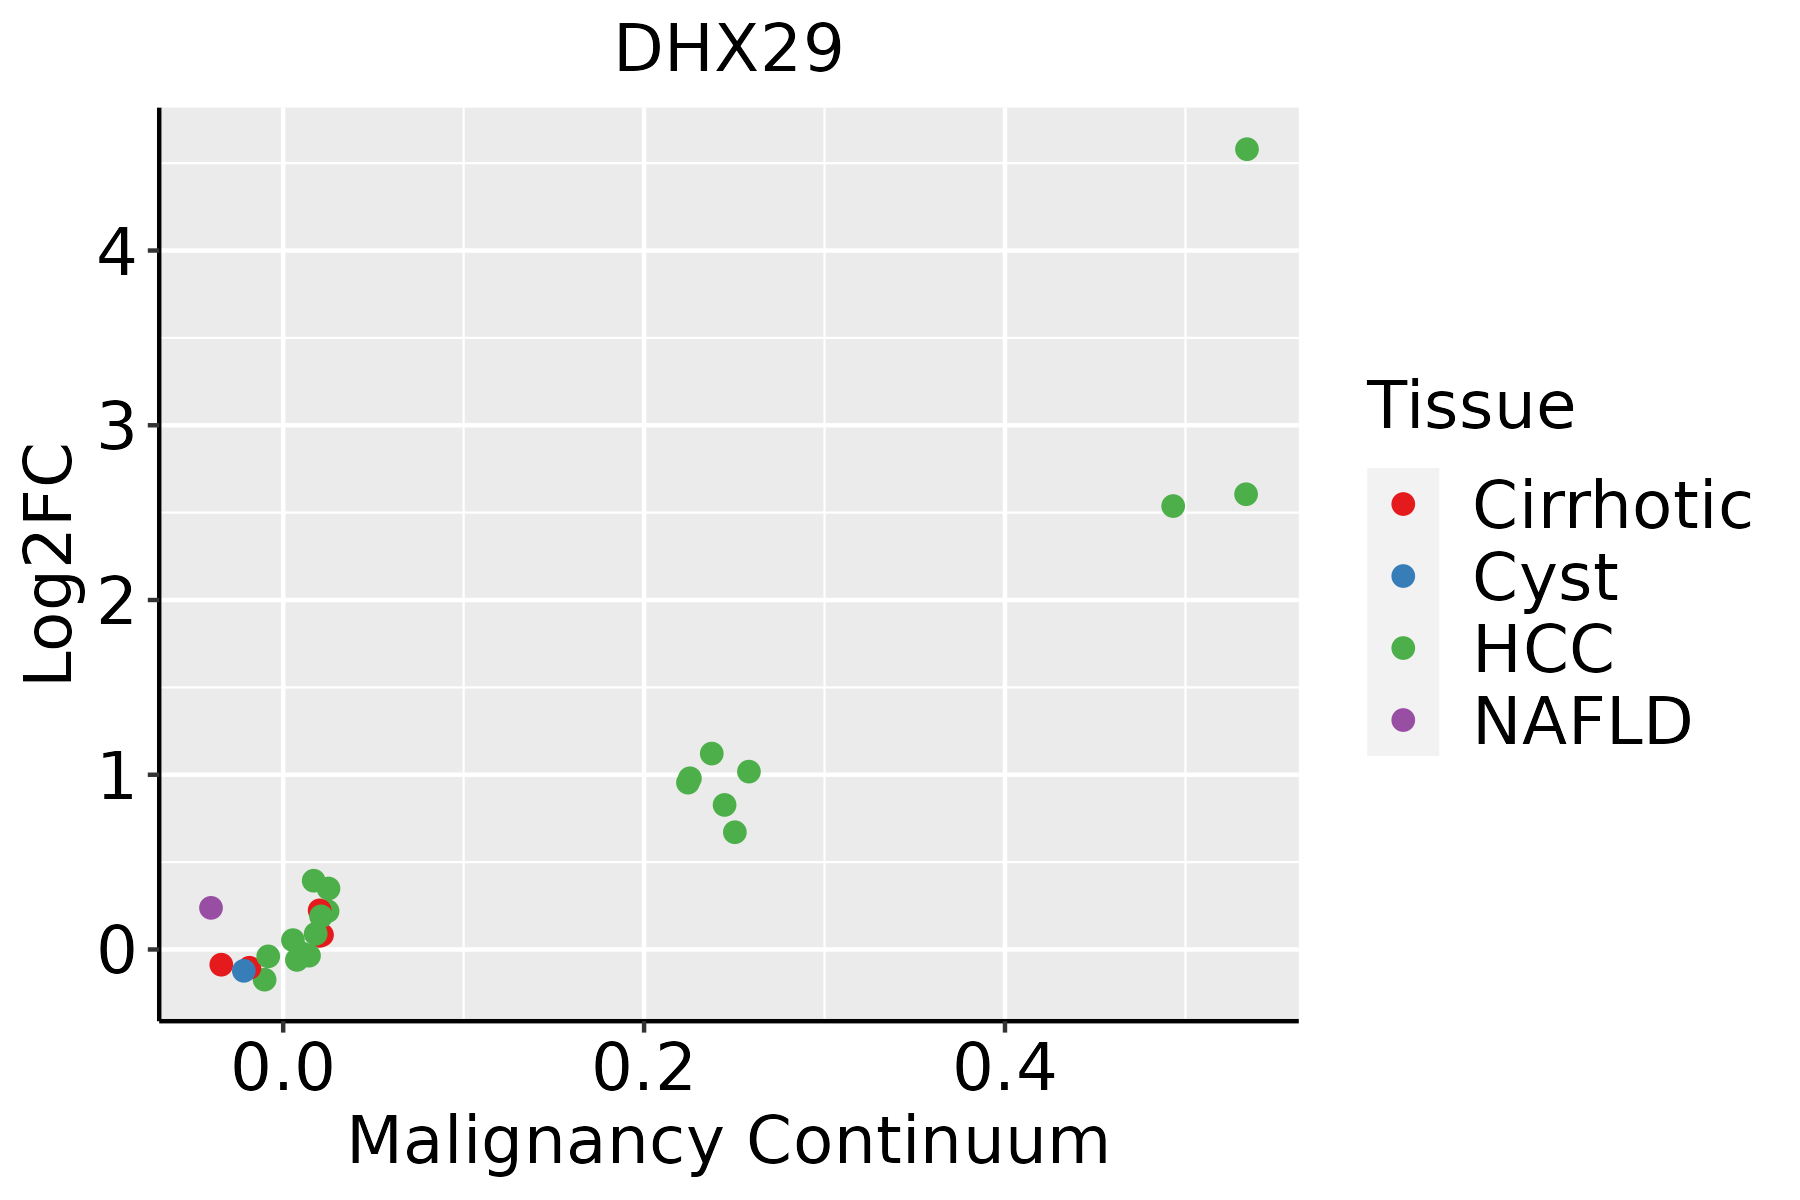
HCC: Hepatocellular carcinoma
NAFLD: Non-alcoholic fatty liver disease
Oral CavityThe image shows the transcriptomic changes along malignancy continuum.log2FC in expression of this searched gene in stem-like cells from each diseased tissue sample relative to stem-like cells in normal samples in each tissue plotted against the malignancy continuum. Samples are colored based on if they are from different disease stage.EOLP: Erosive Oral lichen planus
LP: leukoplakia
NEOLP: Non-erosive oral lichen planus
OSCC: Oral squamous cell carcinoma
SkinThe image shows the transcriptomic changes along malignancy continuum.log2FC in expression of this searched gene in stem-like cells from each diseased tissue sample relative to stem-like cells in normal samples in each tissue plotted against the malignancy continuum. Samples are colored based on if they are from different disease stage.AK: Actinic keratosis
cSCC: Cutaneous squamous cell carcinoma
SCCIS:squamous cell carcinoma in situ
ThyroidThe image shows the transcriptomic changes along malignancy continuum.log2FC in expression of this searched gene in stem-like cells from each diseased tissue sample relative to stem-like cells in normal samples in each tissue plotted against the malignancy continuum. Samples are colored based on if they are from different disease stage.ATC: Anaplastic thyroid cancer
HT: Hashimoto's thyroiditis
PTC: Papillary thyroid cancer
∗log2FC in expression of this searched gene in stem-like cells from each diseased tissue sample relative to stem-like cells in normal samples in each tissue plotted against the malignancy continuum. Samples are colored based on if they are from different disease stage.

Top

Malignant transformation related pathway analysis

check buttonFind out the enriched GO biological processes and KEGG pathways involved in transition from healthy to precancer to cancer
check button Figure of enriched GO biological processes.
TissueDisease StageEnriched GO biological Processes
ColorectumADGO analysis - Figure of enriched GO biological processes: Top 15 enriched GO BP terms are showed in the bar plot of each disease state in each tissue. Each row represents a significant GO biological process which is colored according to the -log10(p.adjust).
ColorectumSERGO analysis - Figure of enriched GO biological processes: Top 15 enriched GO BP terms are showed in the bar plot of each disease state in each tissue. Each row represents a significant GO biological process which is colored according to the -log10(p.adjust).
ColorectumMSSGO analysis - Figure of enriched GO biological processes: Top 15 enriched GO BP terms are showed in the bar plot of each disease state in each tissue. Each row represents a significant GO biological process which is colored according to the -log10(p.adjust).
ColorectumMSI-HGO analysis - Figure of enriched GO biological processes: Top 15 enriched GO BP terms are showed in the bar plot of each disease state in each tissue. Each row represents a significant GO biological process which is colored according to the -log10(p.adjust).
ColorectumFAPGO analysis - Figure of enriched GO biological processes: Top 15 enriched GO BP terms are showed in the bar plot of each disease state in each tissue. Each row represents a significant GO biological process which is colored according to the -log10(p.adjust).
∗Top 15 enriched GO BP terms are showed in the bar plot of each disease state in each tissue. Each row represents a significant GO biological process which is colored according to the -log10(p.adjust).
Page: 1 2 3 4 5 6 7 8 9 

check button Enriched GO biological processes.
GO IDTissueDisease StageDescriptionGene RatioBg Ratiopvaluep.adjustCount
GO:0022613111EsophagusESCCribonucleoprotein complex biogenesis365/8552463/187231.74e-491.11e-45365
GO:0042254111EsophagusESCCribosome biogenesis252/8552299/187233.27e-441.04e-40252
GO:0002181111EsophagusESCCcytoplasmic translation135/8552148/187234.17e-322.65e-29135
GO:0006413110EsophagusESCCtranslational initiation100/8552118/187231.16e-181.25e-16100
GO:0006417111EsophagusESCCregulation of translation304/8552468/187231.53e-171.33e-15304
GO:0071826111EsophagusESCCribonucleoprotein complex subunit organization166/8552227/187232.94e-172.42e-15166
GO:0022618111EsophagusESCCribonucleoprotein complex assembly159/8552220/187238.19e-165.71e-14159
GO:0045727111EsophagusESCCpositive regulation of translation107/8552136/187232.79e-151.68e-13107
GO:0034250111EsophagusESCCpositive regulation of cellular amide metabolic process123/8552162/187233.32e-151.93e-13123
GO:000644617EsophagusESCCregulation of translational initiation65/855279/187232.04e-117.07e-1065
GO:0002183110EsophagusESCCcytoplasmic translational initiation32/855234/187232.18e-094.94e-0832
GO:0042255111EsophagusESCCribosome assembly50/855261/187235.66e-091.17e-0750
GO:00459483EsophagusESCCpositive regulation of translational initiation23/855230/187235.47e-043.00e-0323
GO:00017319EsophagusESCCformation of translation preinitiation complex10/855211/187232.54e-031.08e-0210
GO:000218112LiverCirrhoticcytoplasmic translation120/4634148/187232.95e-471.85e-43120
GO:002261312LiverCirrhoticribonucleoprotein complex biogenesis231/4634463/187233.28e-326.86e-29231
GO:004225412LiverCirrhoticribosome biogenesis154/4634299/187231.18e-236.72e-21154
GO:000641312LiverCirrhotictranslational initiation76/4634118/187238.36e-202.18e-1776
GO:007182612LiverCirrhoticribonucleoprotein complex subunit organization115/4634227/187232.67e-173.63e-15115
GO:002261812LiverCirrhoticribonucleoprotein complex assembly112/4634220/187234.35e-175.81e-15112
Page: 1 2 3 4 5 6 

check button Enriched KEGG pathways.
Pathway IDTissueDisease StageDescriptionGene RatioBg Ratiopvaluep.adjustqvalueCount
Page: 1 

Top

Cell-cell communication analysis

check buttonIdentification of potential cell-cell interactions between two cell types and their ligand-receptor pairs for different disease states
LigandReceptorLRpairPathwayTissueDisease Stage
Page: 1 

Top

Single-cell gene regulatory network inference analysis

check buttonFind out the significant the regulons (TFs) and the target genes of each regulon across cell types for different disease states
TFCell TypeTissueDisease StageTarget GeneRSSRegulon Activity
∗The dot plots of a searched regulon are shown for all cell subpopulations in each disease state of each tissue based on the regulon specific score inferred using pySCENIC and by calculating the average expression.
Page: 1 

Top

Somatic mutation of malignant transformation related genes

check buttonAnnotation of somatic variants for genes involved in malignant transformation
Hugo SymbolVariant ClassVariant ClassificationdbSNP RSHGVScHGVSpHGVSp ShortSWISSPROTBIOTYPESIFTPolyPhenTumor Sample BarcodeTissueHistologySexAgeStageTherapy TypesDrugsOutcome
DHX29SNVMissense_Mutationnovelc.1207C>Gp.Pro403Alap.P403AQ7Z478protein_codingtolerated(0.41)benign(0)TCGA-5L-AAT0-01Breastbreast invasive carcinomaFemale<65I/IIHormone TherapytamoxiphenSD
DHX29SNVMissense_Mutationrs746293690c.1795A>Gp.Ser599Glyp.S599GQ7Z478protein_codingtolerated(0.06)probably_damaging(0.964)TCGA-AN-A0XT-01Breastbreast invasive carcinomaFemale<65III/IVUnknownUnknownSD
DHX29SNVMissense_Mutationc.3761N>Gp.Ala1254Glyp.A1254GQ7Z478protein_codingdeleterious(0)possibly_damaging(0.892)TCGA-BH-A1EV-01Breastbreast invasive carcinomaFemale<65III/IVUnknownUnknownPD
DHX29SNVMissense_Mutationc.1834N>Cp.Asp612Hisp.D612HQ7Z478protein_codingdeleterious(0)possibly_damaging(0.78)TCGA-D8-A1J8-01Breastbreast invasive carcinomaFemale>=65I/IIHormone TherapynolvadexSD
DHX29SNVMissense_Mutationc.1539N>Cp.Lys513Asnp.K513NQ7Z478protein_codingtolerated(0.26)benign(0.021)TCGA-GM-A2D9-01Breastbreast invasive carcinomaFemale>=65I/IIHormone TherapyarimidexSD
DHX29SNVMissense_Mutationnovelc.1033N>Cp.Glu345Glnp.E345QQ7Z478protein_codingdeleterious(0.01)probably_damaging(0.946)TCGA-LD-A74U-01Breastbreast invasive carcinomaFemale>=65III/IVChemotherapytaxotereSD
DHX29deletionFrame_Shift_Delnovelc.1065delNp.Asp356IlefsTer9p.D356Ifs*9Q7Z478protein_codingTCGA-D8-A27V-01Breastbreast invasive carcinomaFemale<65I/IIHormone TherapytamoxiphenSD
DHX29SNVMissense_Mutationnovelc.2900A>Gp.Glu967Glyp.E967GQ7Z478protein_codingdeleterious(0)probably_damaging(0.993)TCGA-2W-A8YY-01Cervixcervical & endocervical cancerFemale<65I/IIChemotherapycisplatinCR
DHX29SNVMissense_Mutationrs778194125c.2494C>Tp.Arg832Cysp.R832CQ7Z478protein_codingdeleterious(0)possibly_damaging(0.719)TCGA-2W-A8YY-01Cervixcervical & endocervical cancerFemale<65I/IIChemotherapycisplatinCR
DHX29SNVMissense_Mutationc.532G>Ap.Glu178Lysp.E178KQ7Z478protein_codingtolerated(0.89)benign(0.001)TCGA-IR-A3LA-01Cervixcervical & endocervical cancerFemale<65I/IIChemotherapycisplatinCR
Page: 1 2 3 4 5 6 7 8 9 10 11 12 13 

Top

Related drugs of malignant transformation related genes

check buttonIdentification of chemicals and drugs interact with genes involved in malignant transfromation
(DGIdb 4.0)
Entrez IDSymbolCategoryInteraction TypesDrug Claim NameDrug NamePMIDs
Page: 1